
|
|||||
|
 | |
| |
| |
| |
| |
| |
|
Gene: ABCA4 |
Gene summary for ABCA4 |
| Gene information | Species | Human | Gene symbol | ABCA4 | Gene ID | 24 |
| Gene name | ATP binding cassette subfamily A member 4 | |
| Gene Alias | ABC10 | |
| Cytomap | 1p22.1 | |
| Gene Type | protein-coding | GO ID | GO:0001523 | UniProtAcc | P78363 |
Top |
Malignant transformation analysis |
| Identification of the aberrant gene expression in precancerous and cancerous lesions by comparing the gene expression of stem-like cells in diseased tissues with normal stem cells |
| Entrez ID | Symbol | Replicates | Species | Organ | Tissue | Adj P-value | Log2FC | Malignancy |
| 24 | ABCA4 | RNA-P6T2-P6T2-1 | Human | Lung | IAC | 3.98e-48 | 1.21e+00 | -0.0166 |
| 24 | ABCA4 | RNA-P6T2-P6T2-2 | Human | Lung | IAC | 3.93e-53 | 1.27e+00 | -0.0132 |
| 24 | ABCA4 | RNA-P6T2-P6T2-3 | Human | Lung | IAC | 4.26e-65 | 1.36e+00 | -0.013 |
| 24 | ABCA4 | RNA-P6T2-P6T2-4 | Human | Lung | IAC | 3.50e-55 | 1.27e+00 | -0.0121 |
| 24 | ABCA4 | RNA-P7T1-P7T1-1 | Human | Lung | AIS | 4.21e-10 | 8.07e-01 | -0.0961 |
| 24 | ABCA4 | RNA-P7T1-P7T1-2 | Human | Lung | AIS | 3.89e-13 | 9.23e-01 | -0.0876 |
| 24 | ABCA4 | RNA-P7T1-P7T1-3 | Human | Lung | AIS | 7.13e-10 | 7.95e-01 | -0.0822 |
| 24 | ABCA4 | RNA-P7T1-P7T1-4 | Human | Lung | AIS | 6.36e-10 | 7.34e-01 | -0.0809 |
| Page: 1 |
| Tissue | Expression Dynamics | Abbreviation |
| Lung | 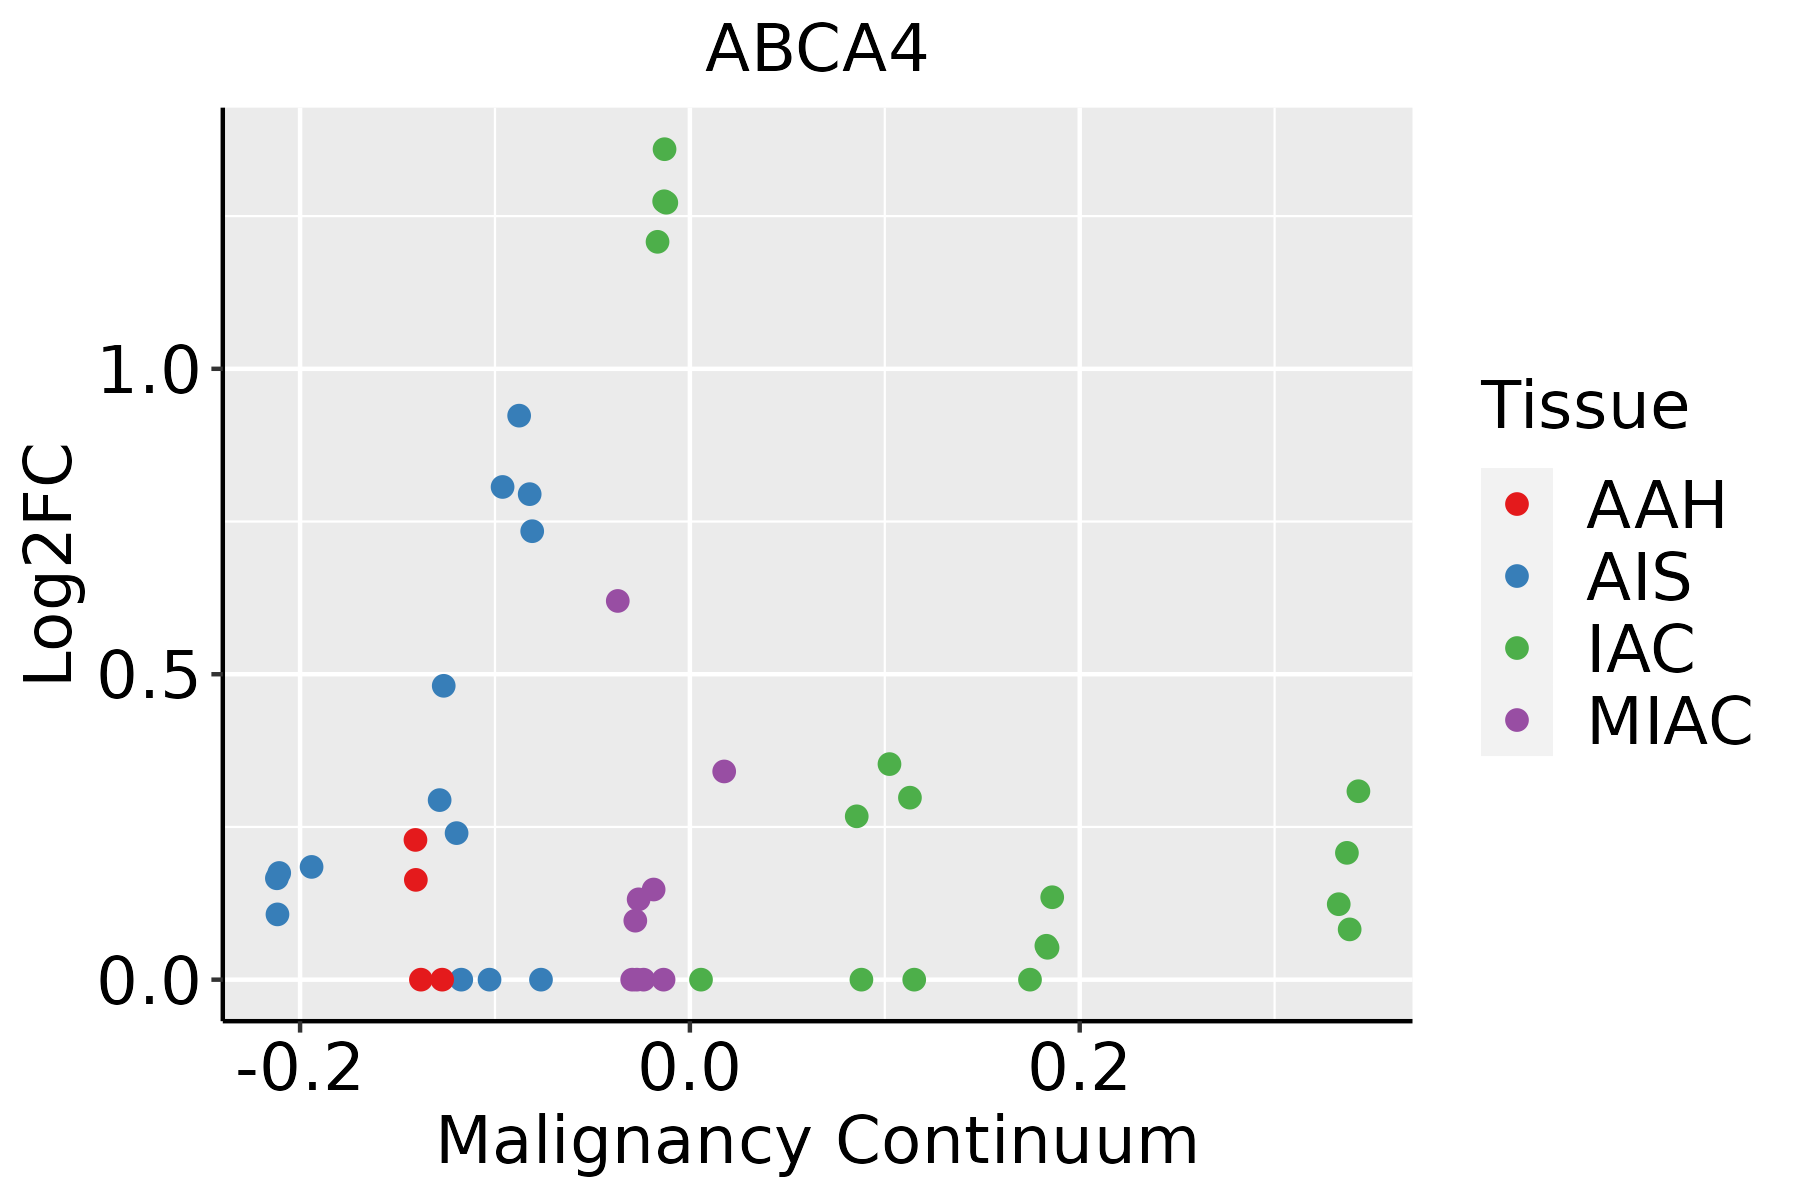 | AAH: Atypical adenomatous hyperplasia |
| AIS: Adenocarcinoma in situ | ||
| IAC: Invasive lung adenocarcinoma | ||
| MIA: Minimally invasive adenocarcinoma |
| ∗log2FC in expression of this searched gene in stem-like cells from each diseased tissue sample relative to stem-like cells in normal samples in each tissue plotted against the malignancy continuum. Samples are colored based on if they are from different disease stage. |
Top |
Malignant transformation related pathway analysis |
| Find out the enriched GO biological processes and KEGG pathways involved in transition from healthy to precancer to cancer |
| Tissue | Disease Stage | Enriched GO biological Processes |
| Colorectum | AD |  |
| Colorectum | SER |  |
| Colorectum | MSS |  |
| Colorectum | MSI-H |  |
| Colorectum | FAP |  |
| ∗Top 15 enriched GO BP terms are showed in the bar plot of each disease state in each tissue. Each row represents a significant GO biological process which is colored according to the -log10(p.adjust). |
| Page: 1 2 3 4 5 6 7 8 9 |
| GO ID | Tissue | Disease Stage | Description | Gene Ratio | Bg Ratio | pvalue | p.adjust | Count |
| GO:00093147 | Lung | IAC | response to radiation | 77/2061 | 456/18723 | 8.59e-05 | 1.74e-03 | 77 |
| GO:00018947 | Lung | IAC | tissue homeostasis | 46/2061 | 268/18723 | 1.50e-03 | 1.60e-02 | 46 |
| GO:00602497 | Lung | IAC | anatomical structure homeostasis | 51/2061 | 314/18723 | 2.91e-03 | 2.61e-02 | 51 |
| GO:00159142 | Lung | IAC | phospholipid transport | 20/2061 | 96/18723 | 3.58e-03 | 3.00e-02 | 20 |
| GO:00157482 | Lung | IAC | organophosphate ester transport | 26/2061 | 140/18723 | 5.22e-03 | 3.97e-02 | 26 |
| GO:000931411 | Lung | AIS | response to radiation | 71/1849 | 456/18723 | 7.33e-05 | 1.91e-03 | 71 |
| GO:000189412 | Lung | AIS | tissue homeostasis | 41/1849 | 268/18723 | 3.13e-03 | 3.01e-02 | 41 |
| GO:00094162 | Lung | AIS | response to light stimulus | 47/1849 | 320/18723 | 3.72e-03 | 3.48e-02 | 47 |
| GO:001591411 | Lung | AIS | phospholipid transport | 18/1849 | 96/18723 | 5.64e-03 | 4.76e-02 | 18 |
| Page: 1 |
| Pathway ID | Tissue | Disease Stage | Description | Gene Ratio | Bg Ratio | pvalue | p.adjust | qvalue | Count |
| Page: 1 |
Top |
Cell-cell communication analysis |
| Identification of potential cell-cell interactions between two cell types and their ligand-receptor pairs for different disease states |
| Ligand | Receptor | LRpair | Pathway | Tissue | Disease Stage |
| Page: 1 |
Top |
Single-cell gene regulatory network inference analysis |
| Find out the significant the regulons (TFs) and the target genes of each regulon across cell types for different disease states |
| TF | Cell Type | Tissue | Disease Stage | Target Gene | RSS | Regulon Activity |
| ∗The dot plots of a searched regulon are shown for all cell subpopulations in each disease state of each tissue based on the regulon specific score inferred using pySCENIC and by calculating the average expression. |
| Page: 1 |
Top |
Somatic mutation of malignant transformation related genes |
| Annotation of somatic variants for genes involved in malignant transformation |
| Hugo Symbol | Variant Class | Variant Classification | dbSNP RS | HGVSc | HGVSp | HGVSp Short | SWISSPROT | BIOTYPE | SIFT | PolyPhen | Tumor Sample Barcode | Tissue | Histology | Sex | Age | Stage | Therapy Types | Drugs | Outcome |
| ABCA4 | SNV | Missense_Mutation | c.2947A>T | p.Thr983Ser | p.T983S | P78363 | protein_coding | tolerated(0.14) | possibly_damaging(0.739) | TCGA-A2-A0SY-01 | Breast | breast invasive carcinoma | Female | <65 | III/IV | Hormone Therapy | arimidex | SD | |
| ABCA4 | SNV | Missense_Mutation | c.1372C>A | p.Pro458Thr | p.P458T | P78363 | protein_coding | deleterious(0.01) | benign(0.094) | TCGA-A2-A0T0-01 | Breast | breast invasive carcinoma | Female | <65 | I/II | Chemotherapy | taxotere | SD | |
| ABCA4 | SNV | Missense_Mutation | c.6427N>T | p.Met2143Leu | p.M2143L | P78363 | protein_coding | deleterious(0.03) | possibly_damaging(0.907) | TCGA-AN-A0G0-01 | Breast | breast invasive carcinoma | Female | <65 | I/II | Unknown | Unknown | SD | |
| ABCA4 | SNV | Missense_Mutation | c.301N>G | p.Ile101Val | p.I101V | P78363 | protein_coding | tolerated(0.11) | benign(0.017) | TCGA-AO-A128-01 | Breast | breast invasive carcinoma | Female | <65 | I/II | Chemotherapy | doxorubicin | SD | |
| ABCA4 | SNV | Missense_Mutation | novel | c.2496C>G | p.Asp832Glu | p.D832E | P78363 | protein_coding | deleterious(0.04) | possibly_damaging(0.604) | TCGA-AQ-A54N-01 | Breast | breast invasive carcinoma | Female | <65 | I/II | Unknown | Unknown | SD |
| ABCA4 | SNV | Missense_Mutation | c.3560C>T | p.Thr1187Met | p.T1187M | P78363 | protein_coding | tolerated(0.05) | benign(0.223) | TCGA-B6-A0I9-01 | Breast | breast invasive carcinoma | Female | <65 | III/IV | Unknown | Unknown | PD | |
| ABCA4 | SNV | Missense_Mutation | c.2536G>T | p.Asp846Tyr | p.D846Y | P78363 | protein_coding | deleterious(0) | probably_damaging(0.938) | TCGA-BH-A1FM-01 | Breast | breast invasive carcinoma | Female | <65 | III/IV | Unknown | Unknown | SD | |
| ABCA4 | SNV | Missense_Mutation | c.1798N>C | p.Asp600His | p.D600H | P78363 | protein_coding | deleterious(0) | possibly_damaging(0.474) | TCGA-C8-A12L-01 | Breast | breast invasive carcinoma | Female | >=65 | I/II | Unknown | Unknown | SD | |
| ABCA4 | SNV | Missense_Mutation | c.4941G>T | p.Arg1647Ser | p.R1647S | P78363 | protein_coding | tolerated(0.43) | benign(0.003) | TCGA-C8-A1HM-01 | Breast | breast invasive carcinoma | Female | >=65 | I/II | Chemotherapy | doxorubicin | CR | |
| ABCA4 | SNV | Missense_Mutation | c.6654C>G | p.Ile2218Met | p.I2218M | P78363 | protein_coding | deleterious(0.02) | probably_damaging(0.962) | TCGA-D8-A1J8-01 | Breast | breast invasive carcinoma | Female | >=65 | I/II | Hormone Therapy | nolvadex | SD |
| Page: 1 2 3 4 5 6 7 8 9 10 11 12 13 14 15 16 17 18 19 20 21 22 23 24 25 26 |
Top |
Related drugs of malignant transformation related genes |
| Identification of chemicals and drugs interact with genes involved in malignant transfromation |
| (DGIdb 4.0) |
| Entrez ID | Symbol | Category | Interaction Types | Drug Claim Name | Drug Name | PMIDs |
| 24 | ABCA4 | TRANSPORTER, ABC TRANSPORTER, DRUGGABLE GENOME | StarGen | |||
| 24 | ABCA4 | TRANSPORTER, ABC TRANSPORTER, DRUGGABLE GENOME | STARGEN |
| Page: 1 |

Copyright 2023-Present -The University of Texas Health Science Center at Houston |