
|
|||||
|
 | |
| |
| |
| |
| |
| |
|
Gene: ABCA13 |
Gene summary for ABCA13 |
| Gene information | Species | Human | Gene symbol | ABCA13 | Gene ID | 154664 |
| Gene name | ATP binding cassette subfamily A member 13 | |
| Gene Alias | ABCA13 | |
| Cytomap | 7p12.3 | |
| Gene Type | protein-coding | GO ID | GO:0006810 | UniProtAcc | A0A0A0MT16 |
Top |
Malignant transformation analysis |
| Identification of the aberrant gene expression in precancerous and cancerous lesions by comparing the gene expression of stem-like cells in diseased tissues with normal stem cells |
| Entrez ID | Symbol | Replicates | Species | Organ | Tissue | Adj P-value | Log2FC | Malignancy |
| 154664 | ABCA13 | CCI_1 | Human | Cervix | CC | 1.42e-12 | 9.31e-01 | 0.528 |
| 154664 | ABCA13 | CCI_2 | Human | Cervix | CC | 1.35e-07 | 5.99e-01 | 0.5249 |
| 154664 | ABCA13 | CCI_3 | Human | Cervix | CC | 1.28e-19 | 1.23e+00 | 0.516 |
| 154664 | ABCA13 | CCII_1 | Human | Cervix | CC | 2.38e-08 | 3.78e-01 | 0.3249 |
| 154664 | ABCA13 | Tumor | Human | Cervix | CC | 7.16e-07 | 2.61e-01 | 0.1241 |
| 154664 | ABCA13 | sample3 | Human | Cervix | CC | 3.26e-18 | 4.25e-01 | 0.1387 |
| 154664 | ABCA13 | T3 | Human | Cervix | CC | 5.83e-21 | 4.16e-01 | 0.1389 |
| 154664 | ABCA13 | HTA11_2951_2000001011 | Human | Colorectum | AD | 3.40e-03 | 2.11e-01 | 0.0216 |
| 154664 | ABCA13 | HTA11_1938_2000001011 | Human | Colorectum | AD | 1.67e-02 | 1.39e-01 | -0.0811 |
| 154664 | ABCA13 | HTA11_78_2000001011 | Human | Colorectum | AD | 5.53e-03 | 1.34e-01 | -0.1088 |
| 154664 | ABCA13 | HTA11_347_2000001011 | Human | Colorectum | AD | 1.97e-02 | 9.21e-02 | -0.1954 |
| 154664 | ABCA13 | HTA11_1391_2000001011 | Human | Colorectum | AD | 3.47e-06 | 1.64e-01 | -0.059 |
| 154664 | ABCA13 | HTA11_11156_2000001011 | Human | Colorectum | AD | 5.23e-34 | 2.37e+00 | 0.0397 |
| 154664 | ABCA13 | HTA11_99999974143_84620 | Human | Colorectum | MSS | 1.46e-160 | 4.01e+00 | 0.3005 |
| 154664 | ABCA13 | A002-C-203 | Human | Colorectum | FAP | 1.98e-07 | 4.14e-01 | 0.2786 |
| 154664 | ABCA13 | A002-C-021 | Human | Colorectum | FAP | 3.10e-04 | 2.25e-01 | 0.1171 |
| 154664 | ABCA13 | F072B | Human | Colorectum | FAP | 8.39e-03 | 2.45e-01 | 0.257 |
| 154664 | ABCA13 | LZE4T | Human | Esophagus | ESCC | 9.56e-12 | 3.17e-01 | 0.0811 |
| 154664 | ABCA13 | LZE5T | Human | Esophagus | ESCC | 4.24e-14 | 1.08e+00 | 0.0514 |
| 154664 | ABCA13 | LZE7T | Human | Esophagus | ESCC | 2.68e-16 | 6.46e-01 | 0.0667 |
| Page: 1 2 3 4 |
| Tissue | Expression Dynamics | Abbreviation |
| Cervix | 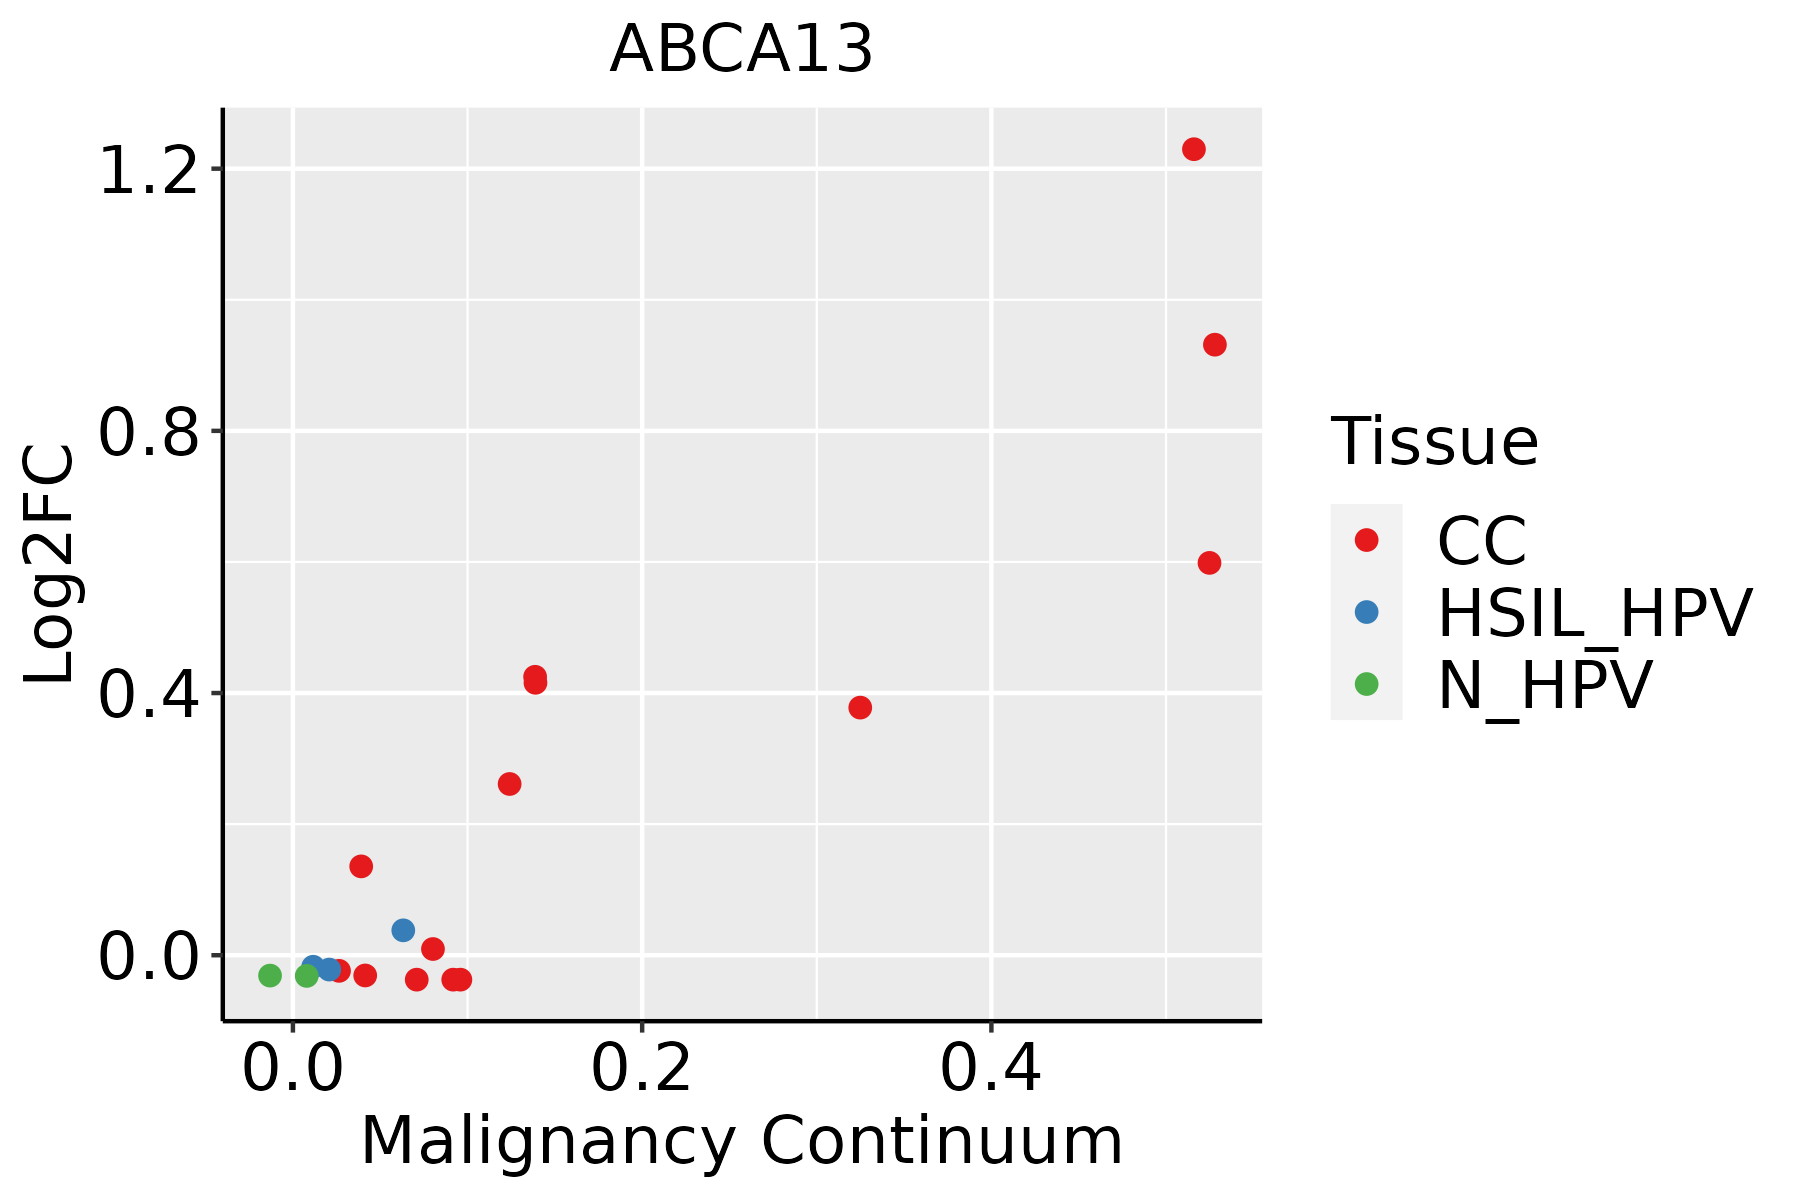 | CC: Cervix cancer |
| HSIL_HPV: HPV-infected high-grade squamous intraepithelial lesions | ||
| N_HPV: HPV-infected normal cervix | ||
| Colorectum (GSE201348) |  | FAP: Familial adenomatous polyposis |
| CRC: Colorectal cancer | ||
| Colorectum (HTA11) |  | AD: Adenomas |
| SER: Sessile serrated lesions | ||
| MSI-H: Microsatellite-high colorectal cancer | ||
| MSS: Microsatellite stable colorectal cancer | ||
| Esophagus |  | ESCC: Esophageal squamous cell carcinoma |
| HGIN: High-grade intraepithelial neoplasias | ||
| LGIN: Low-grade intraepithelial neoplasias | ||
| Lung | 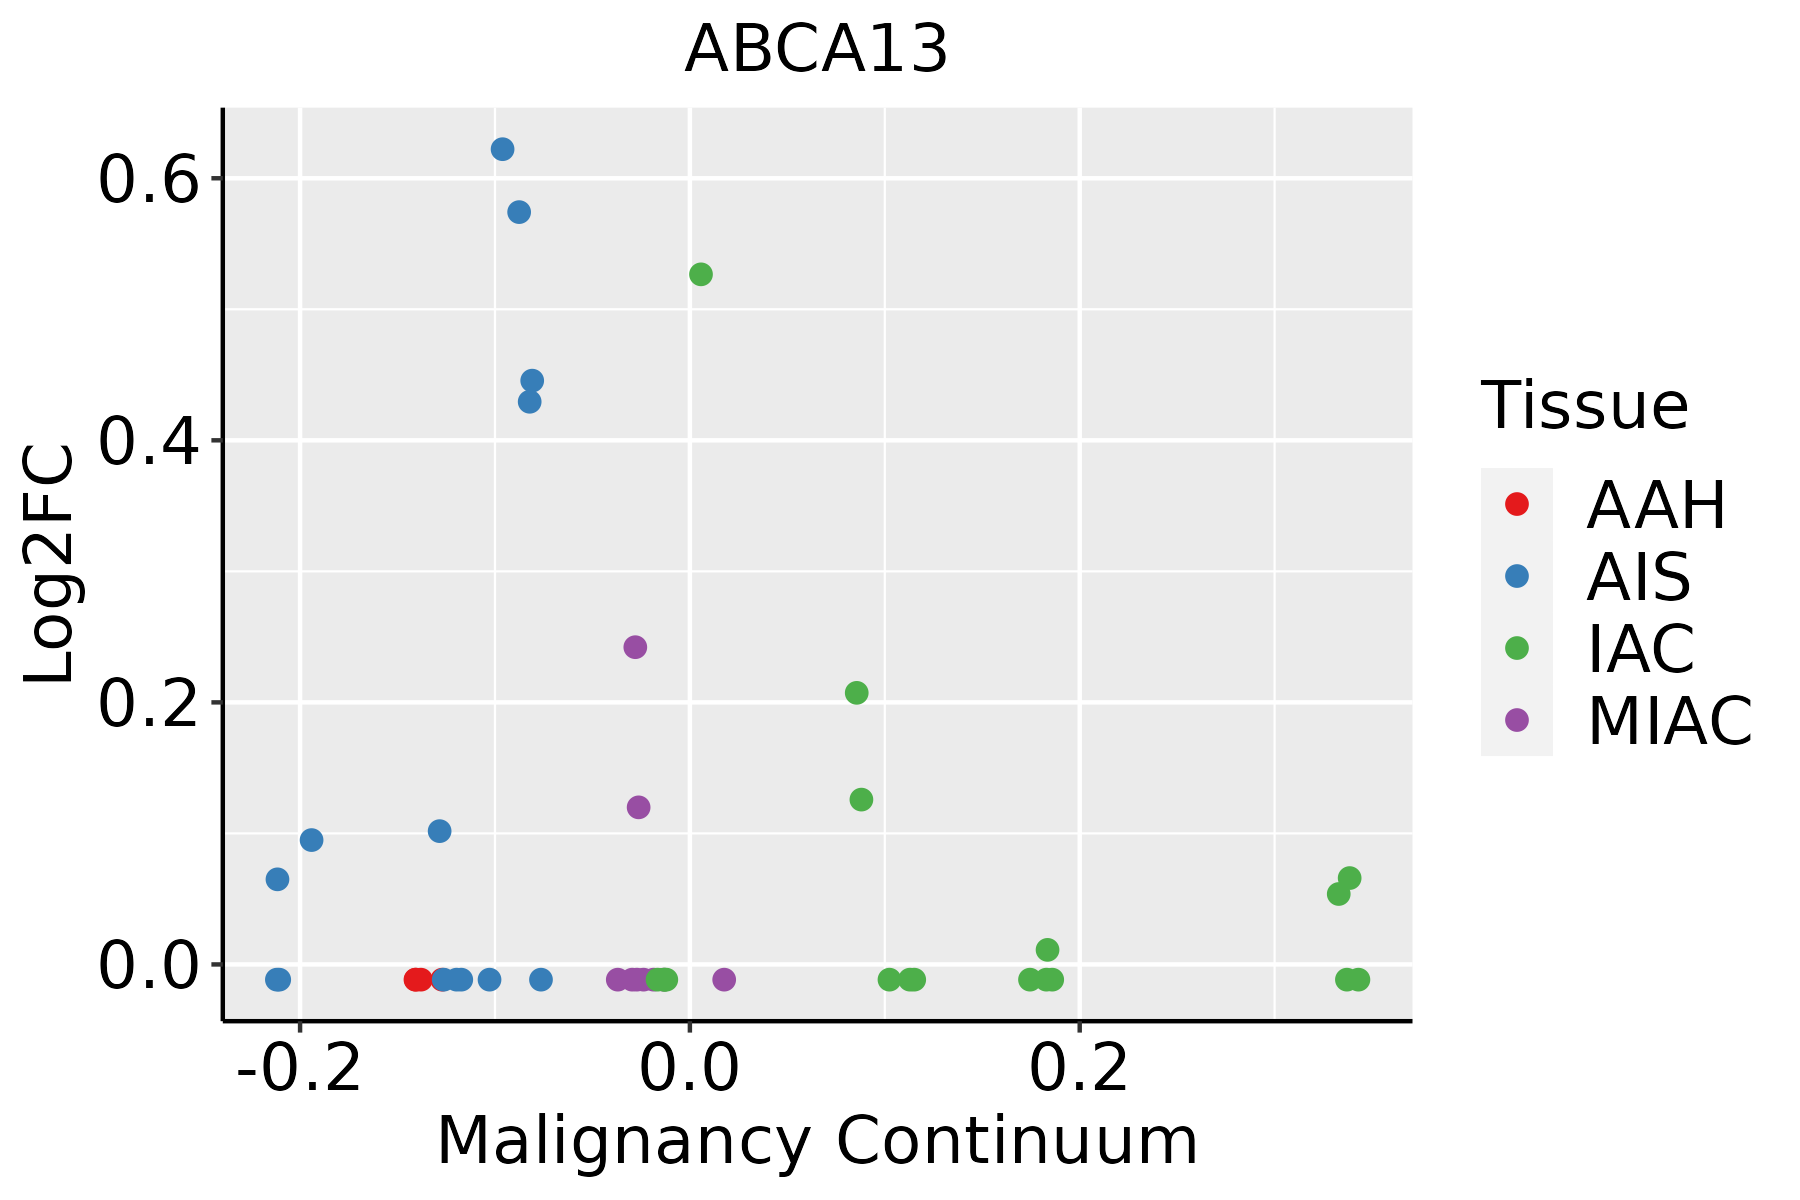 | AAH: Atypical adenomatous hyperplasia |
| AIS: Adenocarcinoma in situ | ||
| IAC: Invasive lung adenocarcinoma | ||
| MIA: Minimally invasive adenocarcinoma | ||
| Oral Cavity | 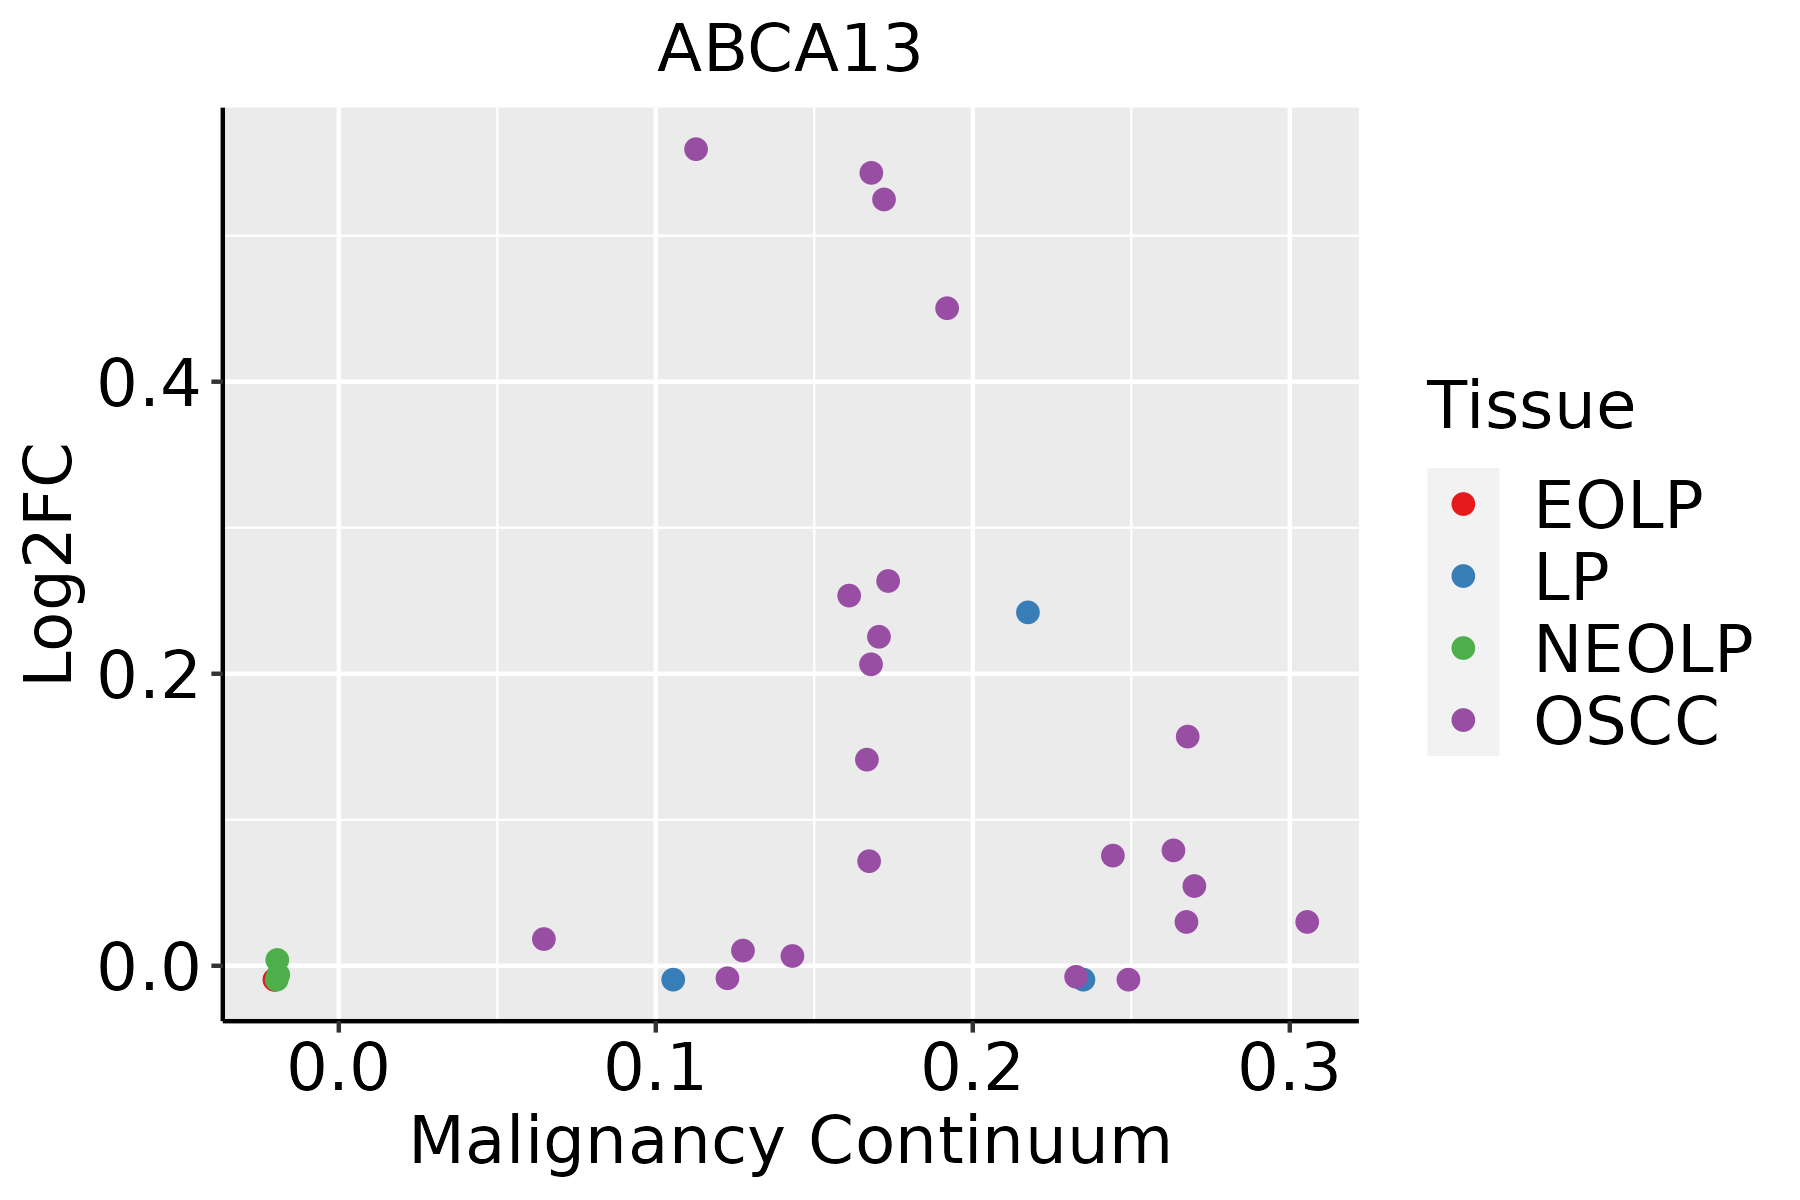 | EOLP: Erosive Oral lichen planus |
| LP: leukoplakia | ||
| NEOLP: Non-erosive oral lichen planus | ||
| OSCC: Oral squamous cell carcinoma |
| ∗log2FC in expression of this searched gene in stem-like cells from each diseased tissue sample relative to stem-like cells in normal samples in each tissue plotted against the malignancy continuum. Samples are colored based on if they are from different disease stage. |
Top |
Malignant transformation related pathway analysis |
| Find out the enriched GO biological processes and KEGG pathways involved in transition from healthy to precancer to cancer |
| Tissue | Disease Stage | Enriched GO biological Processes |
| Colorectum | AD |  |
| Colorectum | SER |  |
| Colorectum | MSS |  |
| Colorectum | MSI-H |  |
| Colorectum | FAP |  |
| ∗Top 15 enriched GO BP terms are showed in the bar plot of each disease state in each tissue. Each row represents a significant GO biological process which is colored according to the -log10(p.adjust). |
| Page: 1 2 3 4 5 6 7 8 9 |
| GO ID | Tissue | Disease Stage | Description | Gene Ratio | Bg Ratio | pvalue | p.adjust | Count |
| GO:00301008 | Cervix | CC | regulation of endocytosis | 47/2311 | 211/18723 | 3.65e-05 | 5.82e-04 | 47 |
| GO:00458077 | Cervix | CC | positive regulation of endocytosis | 27/2311 | 100/18723 | 5.55e-05 | 8.10e-04 | 27 |
| GO:00484883 | Cervix | CC | synaptic vesicle endocytosis | 16/2311 | 62/18723 | 2.87e-03 | 1.91e-02 | 16 |
| GO:01402383 | Cervix | CC | presynaptic endocytosis | 16/2311 | 62/18723 | 2.87e-03 | 1.91e-02 | 16 |
| GO:00364655 | Cervix | CC | synaptic vesicle recycling | 17/2311 | 75/18723 | 8.87e-03 | 4.53e-02 | 17 |
| GO:0030100 | Colorectum | AD | regulation of endocytosis | 67/3918 | 211/18723 | 1.42e-04 | 2.01e-03 | 67 |
| GO:0045807 | Colorectum | AD | positive regulation of endocytosis | 35/3918 | 100/18723 | 7.78e-04 | 7.78e-03 | 35 |
| GO:0010876 | Colorectum | AD | lipid localization | 120/3918 | 448/18723 | 1.59e-03 | 1.33e-02 | 120 |
| GO:0006869 | Colorectum | AD | lipid transport | 108/3918 | 398/18723 | 1.67e-03 | 1.39e-02 | 108 |
| GO:0042886 | Colorectum | AD | amide transport | 83/3918 | 301/18723 | 3.37e-03 | 2.46e-02 | 83 |
| GO:0099003 | Colorectum | AD | vesicle-mediated transport in synapse | 57/3918 | 200/18723 | 6.53e-03 | 4.06e-02 | 57 |
| GO:00301002 | Colorectum | MSS | regulation of endocytosis | 63/3467 | 211/18723 | 4.05e-05 | 7.66e-04 | 63 |
| GO:00458071 | Colorectum | MSS | positive regulation of endocytosis | 33/3467 | 100/18723 | 3.73e-04 | 4.72e-03 | 33 |
| GO:00990031 | Colorectum | MSS | vesicle-mediated transport in synapse | 54/3467 | 200/18723 | 1.94e-03 | 1.67e-02 | 54 |
| GO:00428861 | Colorectum | MSS | amide transport | 76/3467 | 301/18723 | 2.14e-03 | 1.80e-02 | 76 |
| GO:0099504 | Colorectum | MSS | synaptic vesicle cycle | 48/3467 | 181/18723 | 4.85e-03 | 3.39e-02 | 48 |
| GO:0048488 | Colorectum | MSS | synaptic vesicle endocytosis | 20/3467 | 62/18723 | 6.63e-03 | 4.38e-02 | 20 |
| GO:0140238 | Colorectum | MSS | presynaptic endocytosis | 20/3467 | 62/18723 | 6.63e-03 | 4.38e-02 | 20 |
| GO:00108761 | Colorectum | MSS | lipid localization | 104/3467 | 448/18723 | 6.76e-03 | 4.38e-02 | 104 |
| GO:0036465 | Colorectum | MSS | synaptic vesicle recycling | 23/3467 | 75/18723 | 7.49e-03 | 4.72e-02 | 23 |
| Page: 1 2 |
| Pathway ID | Tissue | Disease Stage | Description | Gene Ratio | Bg Ratio | pvalue | p.adjust | qvalue | Count |
| Page: 1 |
Top |
Cell-cell communication analysis |
| Identification of potential cell-cell interactions between two cell types and their ligand-receptor pairs for different disease states |
| Ligand | Receptor | LRpair | Pathway | Tissue | Disease Stage |
| Page: 1 |
Top |
Single-cell gene regulatory network inference analysis |
| Find out the significant the regulons (TFs) and the target genes of each regulon across cell types for different disease states |
| TF | Cell Type | Tissue | Disease Stage | Target Gene | RSS | Regulon Activity |
| ∗The dot plots of a searched regulon are shown for all cell subpopulations in each disease state of each tissue based on the regulon specific score inferred using pySCENIC and by calculating the average expression. |
| Page: 1 |
Top |
Somatic mutation of malignant transformation related genes |
| Annotation of somatic variants for genes involved in malignant transformation |
| Hugo Symbol | Variant Class | Variant Classification | dbSNP RS | HGVSc | HGVSp | HGVSp Short | SWISSPROT | BIOTYPE | SIFT | PolyPhen | Tumor Sample Barcode | Tissue | Histology | Sex | Age | Stage | Therapy Types | Drugs | Outcome |
| ABCA13 | SNV | Missense_Mutation | novel | c.10798N>A | p.Glu3600Lys | p.E3600K | protein_coding | deleterious(0) | probably_damaging(0.999) | TCGA-5L-AAT1-01 | Breast | breast invasive carcinoma | Female | <65 | III/IV | Hormone Therapy | letrozol | SD | |
| ABCA13 | SNV | Missense_Mutation | novel | c.4946N>A | p.Thr1649Asn | p.T1649N | protein_coding | tolerated(1) | benign(0) | TCGA-A1-A0SP-01 | Breast | breast invasive carcinoma | Female | <65 | I/II | Chemotherapy | SD | ||
| ABCA13 | SNV | Missense_Mutation | c.7289N>C | p.Ile2430Thr | p.I2430T | protein_coding | deleterious(0) | benign(0.009) | TCGA-A7-A26G-01 | Breast | breast invasive carcinoma | Female | <65 | I/II | Chemotherapy | taxotere | SD | ||
| ABCA13 | SNV | Missense_Mutation | novel | c.13461G>T | p.Arg4487Ser | p.R4487S | protein_coding | deleterious(0) | probably_damaging(0.996) | TCGA-A7-A3IZ-01 | Breast | breast invasive carcinoma | Female | <65 | I/II | Chemotherapy | cytoxan | SD | |
| ABCA13 | SNV | Missense_Mutation | novel | c.4963G>A | p.Gly1655Ser | p.G1655S | protein_coding | tolerated(0.11) | benign(0.036) | TCGA-A8-A06X-01 | Breast | breast invasive carcinoma | Female | >=65 | I/II | Unknown | Unknown | SD | |
| ABCA13 | SNV | Missense_Mutation | c.6172C>G | p.Leu2058Val | p.L2058V | protein_coding | deleterious(0.03) | possibly_damaging(0.544) | TCGA-A8-A075-01 | Breast | breast invasive carcinoma | Female | <65 | I/II | Chemotherapy | epirubicin | CR | ||
| ABCA13 | SNV | Missense_Mutation | novel | c.1175N>G | p.Val392Gly | p.V392G | protein_coding | deleterious(0) | probably_damaging(0.964) | TCGA-A8-A08O-01 | Breast | breast invasive carcinoma | Female | <65 | III/IV | Chemotherapy | docetaxel | PD | |
| ABCA13 | SNV | Missense_Mutation | c.3705N>T | p.Leu1235Phe | p.L1235F | protein_coding | tolerated(0.12) | benign(0.311) | TCGA-A8-A09A-01 | Breast | breast invasive carcinoma | Female | <65 | I/II | Hormone Therapy | tamoxiphen | SD | ||
| ABCA13 | SNV | Missense_Mutation | c.2082N>T | p.Leu694Phe | p.L694F | protein_coding | tolerated(0.24) | benign(0.034) | TCGA-A8-A09M-01 | Breast | breast invasive carcinoma | Female | >=65 | III/IV | Chemotherapy | paclitaxel | CR | ||
| ABCA13 | SNV | Missense_Mutation | c.3666N>A | p.Phe1222Leu | p.F1222L | protein_coding | tolerated(0.55) | benign(0.409) | TCGA-AC-A23H-01 | Breast | breast invasive carcinoma | Female | >=65 | I/II | Unknown | Unknown | PD |
| Page: 1 2 3 4 5 6 7 8 9 10 11 12 13 14 15 16 17 18 19 20 21 22 23 24 25 26 27 28 29 30 31 32 33 34 35 36 37 38 39 40 41 42 43 44 45 46 47 48 49 50 51 52 53 54 55 56 57 58 59 60 61 62 63 64 65 66 67 68 69 70 71 72 73 74 75 76 77 78 79 80 |
Top |
Related drugs of malignant transformation related genes |
| Identification of chemicals and drugs interact with genes involved in malignant transfromation |
| (DGIdb 4.0) |
| Entrez ID | Symbol | Category | Interaction Types | Drug Claim Name | Drug Name | PMIDs |
| Page: 1 |

Copyright 2023-Present -The University of Texas Health Science Center at Houston |