| Tissue | Expression Dynamics | Abbreviation |
| Cervix |  | CC: Cervix cancer |
| HSIL_HPV: HPV-infected high-grade squamous intraepithelial lesions |
| N_HPV: HPV-infected normal cervix |
| Esophagus | 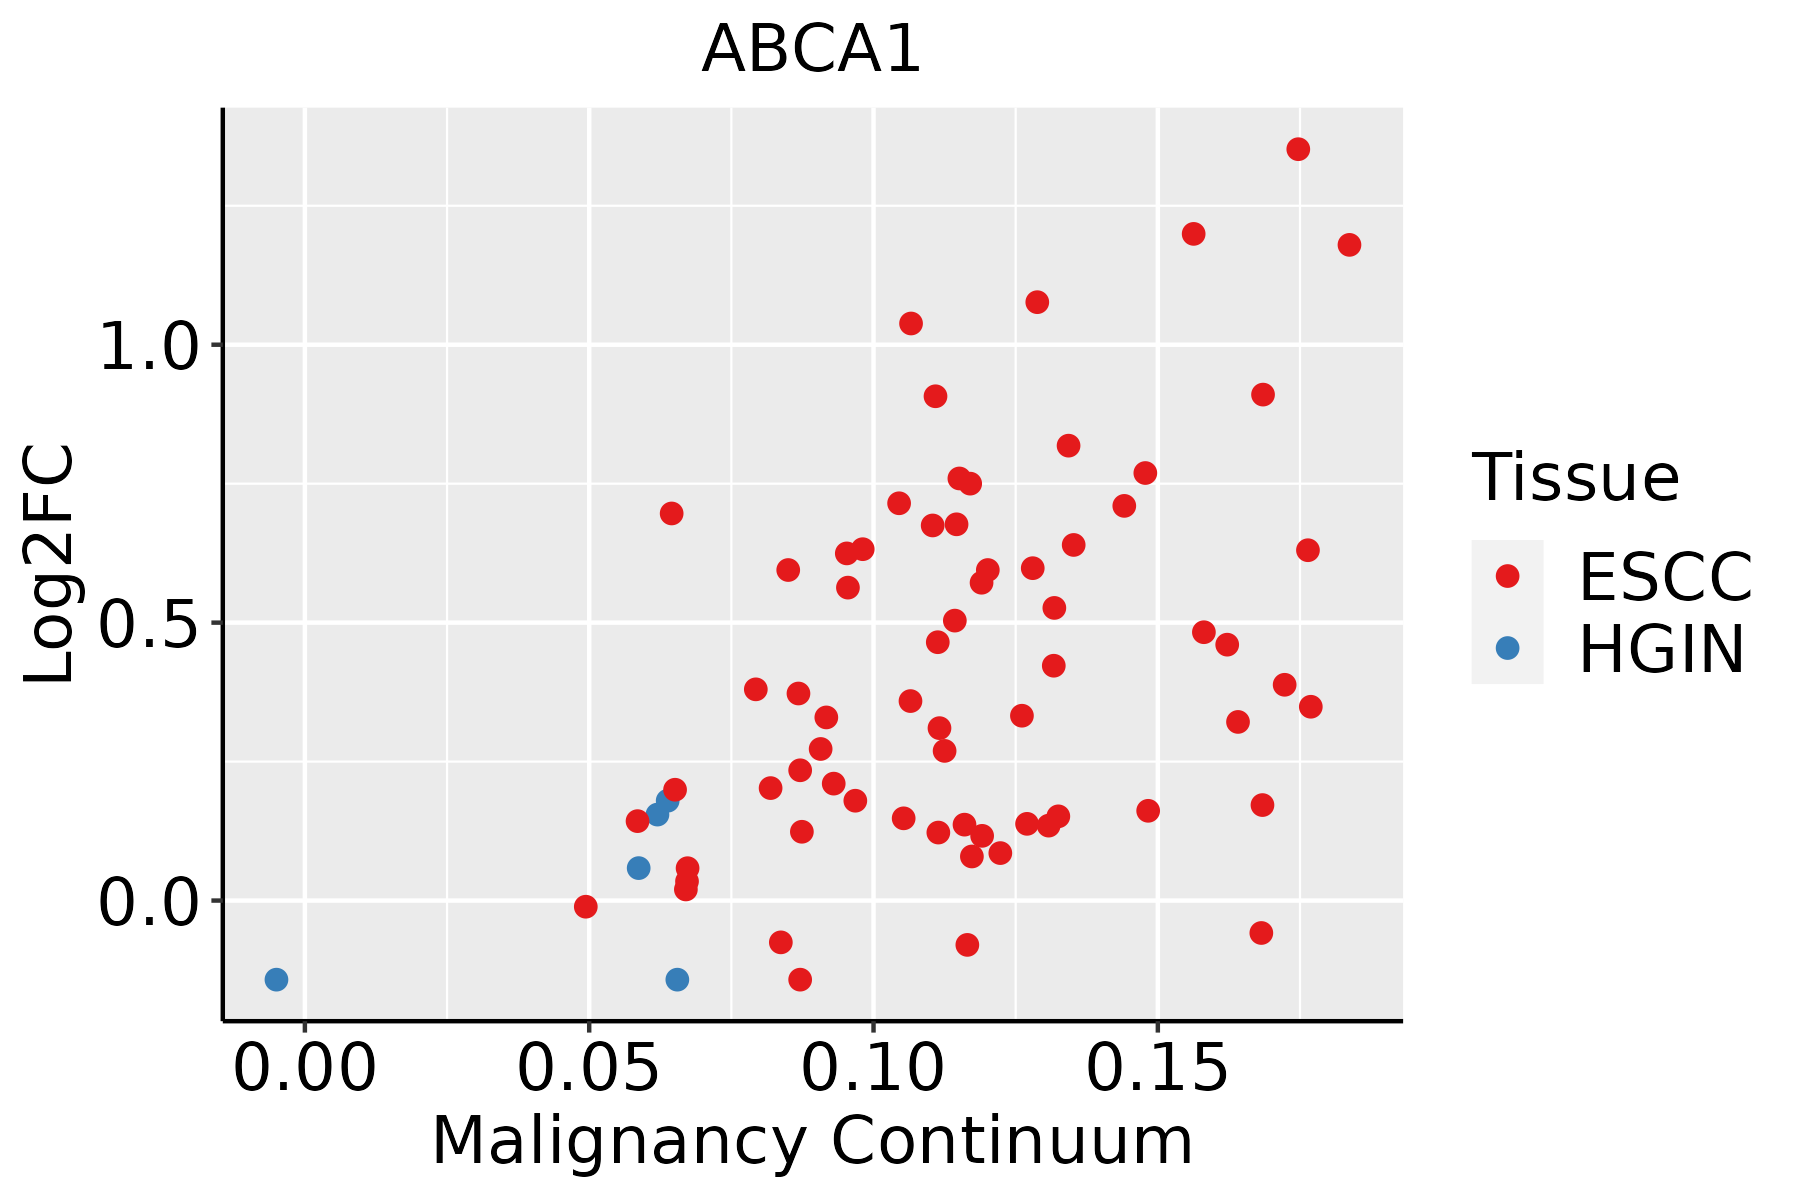 | ESCC: Esophageal squamous cell carcinoma |
| HGIN: High-grade intraepithelial neoplasias |
| LGIN: Low-grade intraepithelial neoplasias |
| Liver | 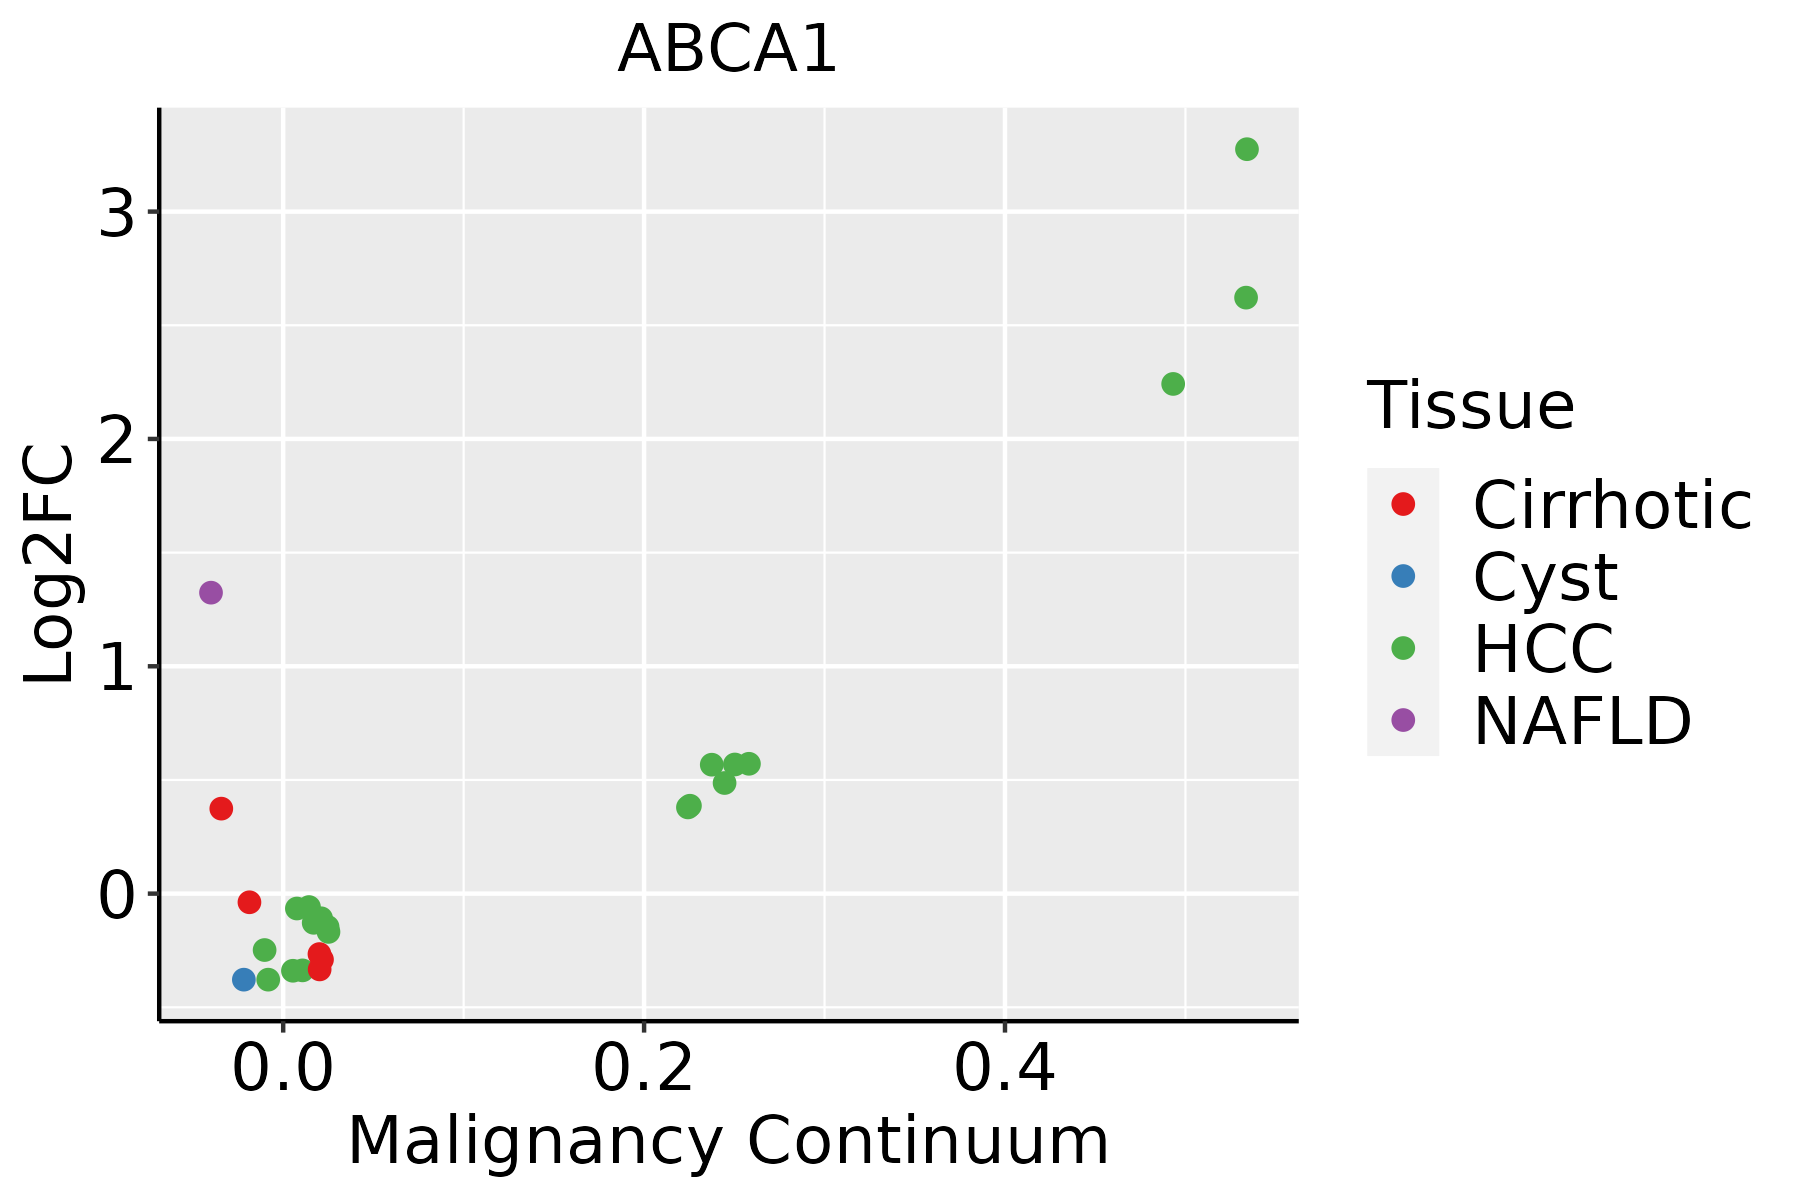 | HCC: Hepatocellular carcinoma |
| NAFLD: Non-alcoholic fatty liver disease |
| Oral Cavity |  | EOLP: Erosive Oral lichen planus |
| LP: leukoplakia |
| NEOLP: Non-erosive oral lichen planus |
| OSCC: Oral squamous cell carcinoma |
| Skin |  | AK: Actinic keratosis |
| cSCC: Cutaneous squamous cell carcinoma |
| SCCIS:squamous cell carcinoma in situ |
| Thyroid | 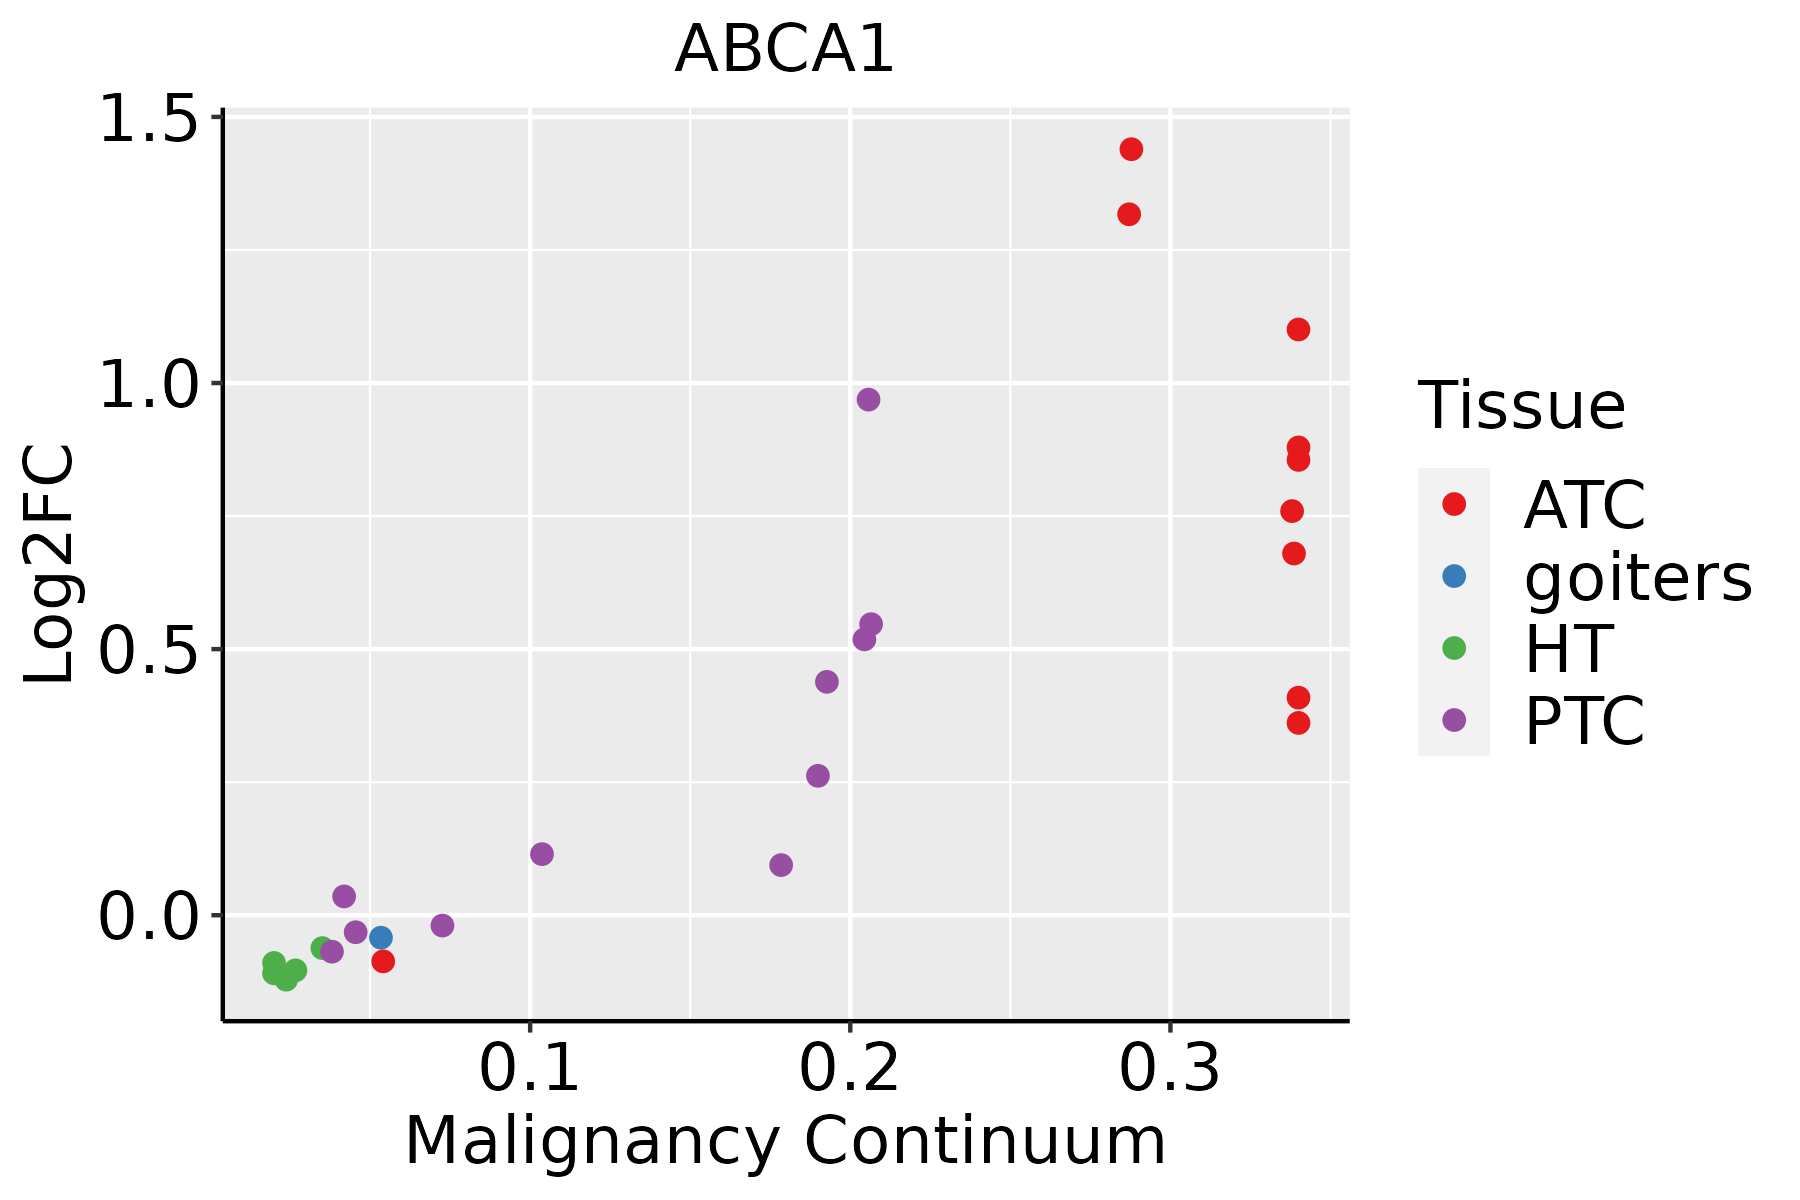 | ATC: Anaplastic thyroid cancer |
| HT: Hashimoto's thyroiditis |
| PTC: Papillary thyroid cancer |
| GO ID | Tissue | Disease Stage | Description | Gene Ratio | Bg Ratio | pvalue | p.adjust | Count |
| GO:00510566 | Cervix | CC | regulation of small GTPase mediated signal transduction | 75/2311 | 302/18723 | 1.54e-09 | 1.74e-07 | 75 |
| GO:004325410 | Cervix | CC | regulation of protein-containing complex assembly | 96/2311 | 428/18723 | 2.91e-09 | 3.05e-07 | 96 |
| GO:00512359 | Cervix | CC | maintenance of location | 78/2311 | 327/18723 | 5.18e-09 | 4.92e-07 | 78 |
| GO:00072656 | Cervix | CC | Ras protein signal transduction | 79/2311 | 337/18723 | 9.49e-09 | 7.77e-07 | 79 |
| GO:00022379 | Cervix | CC | response to molecule of bacterial origin | 78/2311 | 363/18723 | 5.55e-07 | 2.06e-05 | 78 |
| GO:00324969 | Cervix | CC | response to lipopolysaccharide | 74/2311 | 343/18723 | 9.15e-07 | 3.25e-05 | 74 |
| GO:003133410 | Cervix | CC | positive regulation of protein-containing complex assembly | 55/2311 | 237/18723 | 2.25e-06 | 6.73e-05 | 55 |
| GO:003166710 | Cervix | CC | response to nutrient levels | 92/2311 | 474/18723 | 5.80e-06 | 1.42e-04 | 92 |
| GO:00072666 | Cervix | CC | Rho protein signal transduction | 35/2311 | 137/18723 | 1.77e-05 | 3.33e-04 | 35 |
| GO:00465785 | Cervix | CC | regulation of Ras protein signal transduction | 44/2311 | 189/18723 | 2.05e-05 | 3.73e-04 | 44 |
| GO:00301008 | Cervix | CC | regulation of endocytosis | 47/2311 | 211/18723 | 3.65e-05 | 5.82e-04 | 47 |
| GO:00458077 | Cervix | CC | positive regulation of endocytosis | 27/2311 | 100/18723 | 5.55e-05 | 8.10e-04 | 27 |
| GO:00161977 | Cervix | CC | endosomal transport | 48/2311 | 230/18723 | 1.65e-04 | 1.97e-03 | 48 |
| GO:00350235 | Cervix | CC | regulation of Rho protein signal transduction | 22/2311 | 86/18723 | 5.93e-04 | 5.60e-03 | 22 |
| GO:00714042 | Cervix | CC | cellular response to low-density lipoprotein particle stimulus | 9/2311 | 22/18723 | 7.19e-04 | 6.49e-03 | 9 |
| GO:00712228 | Cervix | CC | cellular response to lipopolysaccharide | 41/2311 | 209/18723 | 1.69e-03 | 1.29e-02 | 41 |
| GO:00094109 | Cervix | CC | response to xenobiotic stimulus | 78/2311 | 462/18723 | 2.39e-03 | 1.70e-02 | 78 |
| GO:00712168 | Cervix | CC | cellular response to biotic stimulus | 46/2311 | 246/18723 | 2.53e-03 | 1.76e-02 | 46 |
| GO:00160506 | Cervix | CC | vesicle organization | 54/2311 | 300/18723 | 2.71e-03 | 1.85e-02 | 54 |
| GO:00712198 | Cervix | CC | cellular response to molecule of bacterial origin | 42/2311 | 221/18723 | 2.79e-03 | 1.87e-02 | 42 |
| Pathway ID | Tissue | Disease Stage | Description | Gene Ratio | Bg Ratio | pvalue | p.adjust | qvalue | Count |
| hsa0541720 | Cervix | CC | Lipid and atherosclerosis | 65/1267 | 215/8465 | 6.47e-09 | 1.10e-07 | 6.52e-08 | 65 |
| hsa05417110 | Cervix | CC | Lipid and atherosclerosis | 65/1267 | 215/8465 | 6.47e-09 | 1.10e-07 | 6.52e-08 | 65 |
| hsa05417211 | Esophagus | ESCC | Lipid and atherosclerosis | 143/4205 | 215/8465 | 3.30e-07 | 2.45e-06 | 1.26e-06 | 143 |
| hsa05417310 | Esophagus | ESCC | Lipid and atherosclerosis | 143/4205 | 215/8465 | 3.30e-07 | 2.45e-06 | 1.26e-06 | 143 |
| hsa049792 | Liver | Cirrhotic | Cholesterol metabolism | 30/2530 | 51/8465 | 1.59e-05 | 1.39e-04 | 8.60e-05 | 30 |
| hsa0541722 | Liver | Cirrhotic | Lipid and atherosclerosis | 80/2530 | 215/8465 | 1.18e-02 | 3.81e-02 | 2.35e-02 | 80 |
| hsa049793 | Liver | Cirrhotic | Cholesterol metabolism | 30/2530 | 51/8465 | 1.59e-05 | 1.39e-04 | 8.60e-05 | 30 |
| hsa0541732 | Liver | Cirrhotic | Lipid and atherosclerosis | 80/2530 | 215/8465 | 1.18e-02 | 3.81e-02 | 2.35e-02 | 80 |
| hsa049794 | Liver | HCC | Cholesterol metabolism | 41/4020 | 51/8465 | 1.33e-06 | 1.35e-05 | 7.49e-06 | 41 |
| hsa020102 | Liver | HCC | ABC transporters | 29/4020 | 45/8465 | 1.62e-02 | 3.88e-02 | 2.16e-02 | 29 |
| hsa0541742 | Liver | HCC | Lipid and atherosclerosis | 118/4020 | 215/8465 | 1.66e-02 | 3.92e-02 | 2.18e-02 | 118 |
| hsa049795 | Liver | HCC | Cholesterol metabolism | 41/4020 | 51/8465 | 1.33e-06 | 1.35e-05 | 7.49e-06 | 41 |
| hsa020103 | Liver | HCC | ABC transporters | 29/4020 | 45/8465 | 1.62e-02 | 3.88e-02 | 2.16e-02 | 29 |
| hsa0541752 | Liver | HCC | Lipid and atherosclerosis | 118/4020 | 215/8465 | 1.66e-02 | 3.92e-02 | 2.18e-02 | 118 |
| hsa0541730 | Oral cavity | OSCC | Lipid and atherosclerosis | 131/3704 | 215/8465 | 2.20e-07 | 1.45e-06 | 7.37e-07 | 131 |
| hsa05417113 | Oral cavity | OSCC | Lipid and atherosclerosis | 131/3704 | 215/8465 | 2.20e-07 | 1.45e-06 | 7.37e-07 | 131 |
| Hugo Symbol | Variant Class | Variant Classification | dbSNP RS | HGVSc | HGVSp | HGVSp Short | SWISSPROT | BIOTYPE | SIFT | PolyPhen | Tumor Sample Barcode | Tissue | Histology | Sex | Age | Stage | Therapy Types | Drugs | Outcome |
| ABCA1 | SNV | Missense_Mutation | novel | c.1055N>A | p.Thr352Asn | p.T352N | O95477 | protein_coding | tolerated(0.06) | benign(0.014) | TCGA-A2-A0CR-01 | Breast | breast invasive carcinoma | Female | <65 | I/II | Chemotherapy | adriamycin | CR |
| ABCA1 | SNV | Missense_Mutation | | c.2179N>T | p.Val727Leu | p.V727L | O95477 | protein_coding | tolerated(0.11) | benign(0.011) | TCGA-A8-A06X-01 | Breast | breast invasive carcinoma | Female | >=65 | I/II | Unknown | Unknown | SD |
| ABCA1 | SNV | Missense_Mutation | | c.5552N>A | p.Arg1851Gln | p.R1851Q | O95477 | protein_coding | deleterious(0.02) | benign(0.015) | TCGA-AC-A3QQ-01 | Breast | breast invasive carcinoma | Female | <65 | I/II | Unknown | Unknown | SD |
| ABCA1 | SNV | Missense_Mutation | novel | c.4559N>T | p.Ser1520Ile | p.S1520I | O95477 | protein_coding | deleterious(0.01) | probably_damaging(0.93) | TCGA-AN-A046-01 | Breast | breast invasive carcinoma | Female | >=65 | I/II | Unknown | Unknown | SD |
| ABCA1 | SNV | Missense_Mutation | novel | c.380N>C | p.Lys127Thr | p.K127T | O95477 | protein_coding | tolerated(0.22) | benign(0.007) | TCGA-AN-A046-01 | Breast | breast invasive carcinoma | Female | >=65 | I/II | Unknown | Unknown | SD |
| ABCA1 | SNV | Missense_Mutation | | c.6082N>T | p.Ala2028Ser | p.A2028S | O95477 | protein_coding | tolerated(0.11) | benign(0.038) | TCGA-AN-A0XW-01 | Breast | breast invasive carcinoma | Female | <65 | III/IV | Unknown | Unknown | SD |
| ABCA1 | SNV | Missense_Mutation | | c.5240N>T | p.Trp1747Leu | p.W1747L | O95477 | protein_coding | deleterious(0) | possibly_damaging(0.708) | TCGA-AR-A24Q-01 | Breast | breast invasive carcinoma | Female | <65 | I/II | Chemotherapy | doxorubicin | SD |
| ABCA1 | SNV | Missense_Mutation | | c.6065G>C | p.Gly2022Ala | p.G2022A | O95477 | protein_coding | tolerated(1) | benign(0.006) | TCGA-B6-A0RI-01 | Breast | breast invasive carcinoma | Female | <65 | III/IV | Unknown | Unknown | PD |
| ABCA1 | SNV | Missense_Mutation | | c.4457N>T | p.Pro1486Leu | p.P1486L | O95477 | protein_coding | deleterious(0) | probably_damaging(1) | TCGA-BH-A0HN-01 | Breast | breast invasive carcinoma | Female | >=65 | I/II | Hormone Therapy | arimidex | SD |
| ABCA1 | SNV | Missense_Mutation | novel | c.363N>A | p.Ser121Arg | p.S121R | O95477 | protein_coding | tolerated(0.48) | benign(0.005) | TCGA-D8-A27G-01 | Breast | breast invasive carcinoma | Female | >=65 | I/II | Unknown | Unknown | SD |
| Entrez ID | Symbol | Category | Interaction Types | Drug Claim Name | Drug Name | PMIDs |
| 19 | ABCA1 | TRANSPORTER, DRUGGABLE GENOME, ABC TRANSPORTER, CELL SURFACE, EXTERNAL SIDE OF PLASMA MEMBRANE | | pravastatin | PRAVASTATIN | 19673941,20031551 |
| 19 | ABCA1 | TRANSPORTER, DRUGGABLE GENOME, ABC TRANSPORTER, CELL SURFACE, EXTERNAL SIDE OF PLASMA MEMBRANE | inhibitor | CHEMBL608 | PROBUCOL | |
| 19 | ABCA1 | TRANSPORTER, DRUGGABLE GENOME, ABC TRANSPORTER, CELL SURFACE, EXTERNAL SIDE OF PLASMA MEMBRANE | inhibitor | 178103851 | PROBUCOL | |
| 19 | ABCA1 | TRANSPORTER, DRUGGABLE GENOME, ABC TRANSPORTER, CELL SURFACE, EXTERNAL SIDE OF PLASMA MEMBRANE | | fenofibrate | FENOFIBRATE | |
| 19 | ABCA1 | TRANSPORTER, DRUGGABLE GENOME, ABC TRANSPORTER, CELL SURFACE, EXTERNAL SIDE OF PLASMA MEMBRANE | | 315661263 | | |
| 19 | ABCA1 | TRANSPORTER, DRUGGABLE GENOME, ABC TRANSPORTER, CELL SURFACE, EXTERNAL SIDE OF PLASMA MEMBRANE | | atorvastatin | ATORVASTATIN | 20031551 |
| 19 | ABCA1 | TRANSPORTER, DRUGGABLE GENOME, ABC TRANSPORTER, CELL SURFACE, EXTERNAL SIDE OF PLASMA MEMBRANE | | CSA | CYCLOSPORINE | 15084924 |
| 19 | ABCA1 | TRANSPORTER, DRUGGABLE GENOME, ABC TRANSPORTER, CELL SURFACE, EXTERNAL SIDE OF PLASMA MEMBRANE | | simvastatin | SIMVASTATIN | 20031551 |
| 19 | ABCA1 | TRANSPORTER, DRUGGABLE GENOME, ABC TRANSPORTER, CELL SURFACE, EXTERNAL SIDE OF PLASMA MEMBRANE | | Probucol | PROBUCOL | |


