
|
|||||
|
 | |
| |
| |
| |
| |
| |
|
Gene: AATF |
Gene summary for AATF |
| Gene information | Species | Human | Gene symbol | AATF | Gene ID | 26574 |
| Gene name | apoptosis antagonizing transcription factor | |
| Gene Alias | BFR2 | |
| Cytomap | 17q12 | |
| Gene Type | protein-coding | GO ID | GO:0000278 | UniProtAcc | Q9NY61 |
Top |
Malignant transformation analysis |
| Identification of the aberrant gene expression in precancerous and cancerous lesions by comparing the gene expression of stem-like cells in diseased tissues with normal stem cells |
| Entrez ID | Symbol | Replicates | Species | Organ | Tissue | Adj P-value | Log2FC | Malignancy |
| 26574 | AATF | LZE2T | Human | Esophagus | ESCC | 1.89e-03 | 1.05e+00 | 0.082 |
| 26574 | AATF | LZE4T | Human | Esophagus | ESCC | 3.84e-10 | 4.91e-01 | 0.0811 |
| 26574 | AATF | LZE7T | Human | Esophagus | ESCC | 4.21e-06 | 6.33e-01 | 0.0667 |
| 26574 | AATF | LZE8T | Human | Esophagus | ESCC | 1.77e-05 | 3.55e-01 | 0.067 |
| 26574 | AATF | LZE20T | Human | Esophagus | ESCC | 1.06e-02 | 1.55e-01 | 0.0662 |
| 26574 | AATF | LZE22T | Human | Esophagus | ESCC | 2.39e-08 | 6.61e-01 | 0.068 |
| 26574 | AATF | LZE24T | Human | Esophagus | ESCC | 4.61e-27 | 8.76e-01 | 0.0596 |
| 26574 | AATF | LZE21T | Human | Esophagus | ESCC | 1.74e-07 | 6.26e-01 | 0.0655 |
| 26574 | AATF | LZE6T | Human | Esophagus | ESCC | 1.00e-05 | 4.87e-01 | 0.0845 |
| 26574 | AATF | P1T-E | Human | Esophagus | ESCC | 1.99e-06 | 4.83e-01 | 0.0875 |
| 26574 | AATF | P2T-E | Human | Esophagus | ESCC | 6.16e-37 | 6.35e-01 | 0.1177 |
| 26574 | AATF | P4T-E | Human | Esophagus | ESCC | 1.77e-35 | 9.78e-01 | 0.1323 |
| 26574 | AATF | P5T-E | Human | Esophagus | ESCC | 7.17e-29 | 6.17e-01 | 0.1327 |
| 26574 | AATF | P8T-E | Human | Esophagus | ESCC | 2.34e-35 | 5.74e-01 | 0.0889 |
| 26574 | AATF | P9T-E | Human | Esophagus | ESCC | 1.04e-27 | 6.62e-01 | 0.1131 |
| 26574 | AATF | P10T-E | Human | Esophagus | ESCC | 1.14e-17 | 2.57e-01 | 0.116 |
| 26574 | AATF | P11T-E | Human | Esophagus | ESCC | 4.08e-18 | 8.40e-01 | 0.1426 |
| 26574 | AATF | P12T-E | Human | Esophagus | ESCC | 1.31e-55 | 1.02e+00 | 0.1122 |
| 26574 | AATF | P15T-E | Human | Esophagus | ESCC | 2.70e-27 | 6.88e-01 | 0.1149 |
| 26574 | AATF | P16T-E | Human | Esophagus | ESCC | 1.24e-33 | 6.19e-01 | 0.1153 |
| Page: 1 2 3 4 5 6 |
| Tissue | Expression Dynamics | Abbreviation |
| Esophagus | 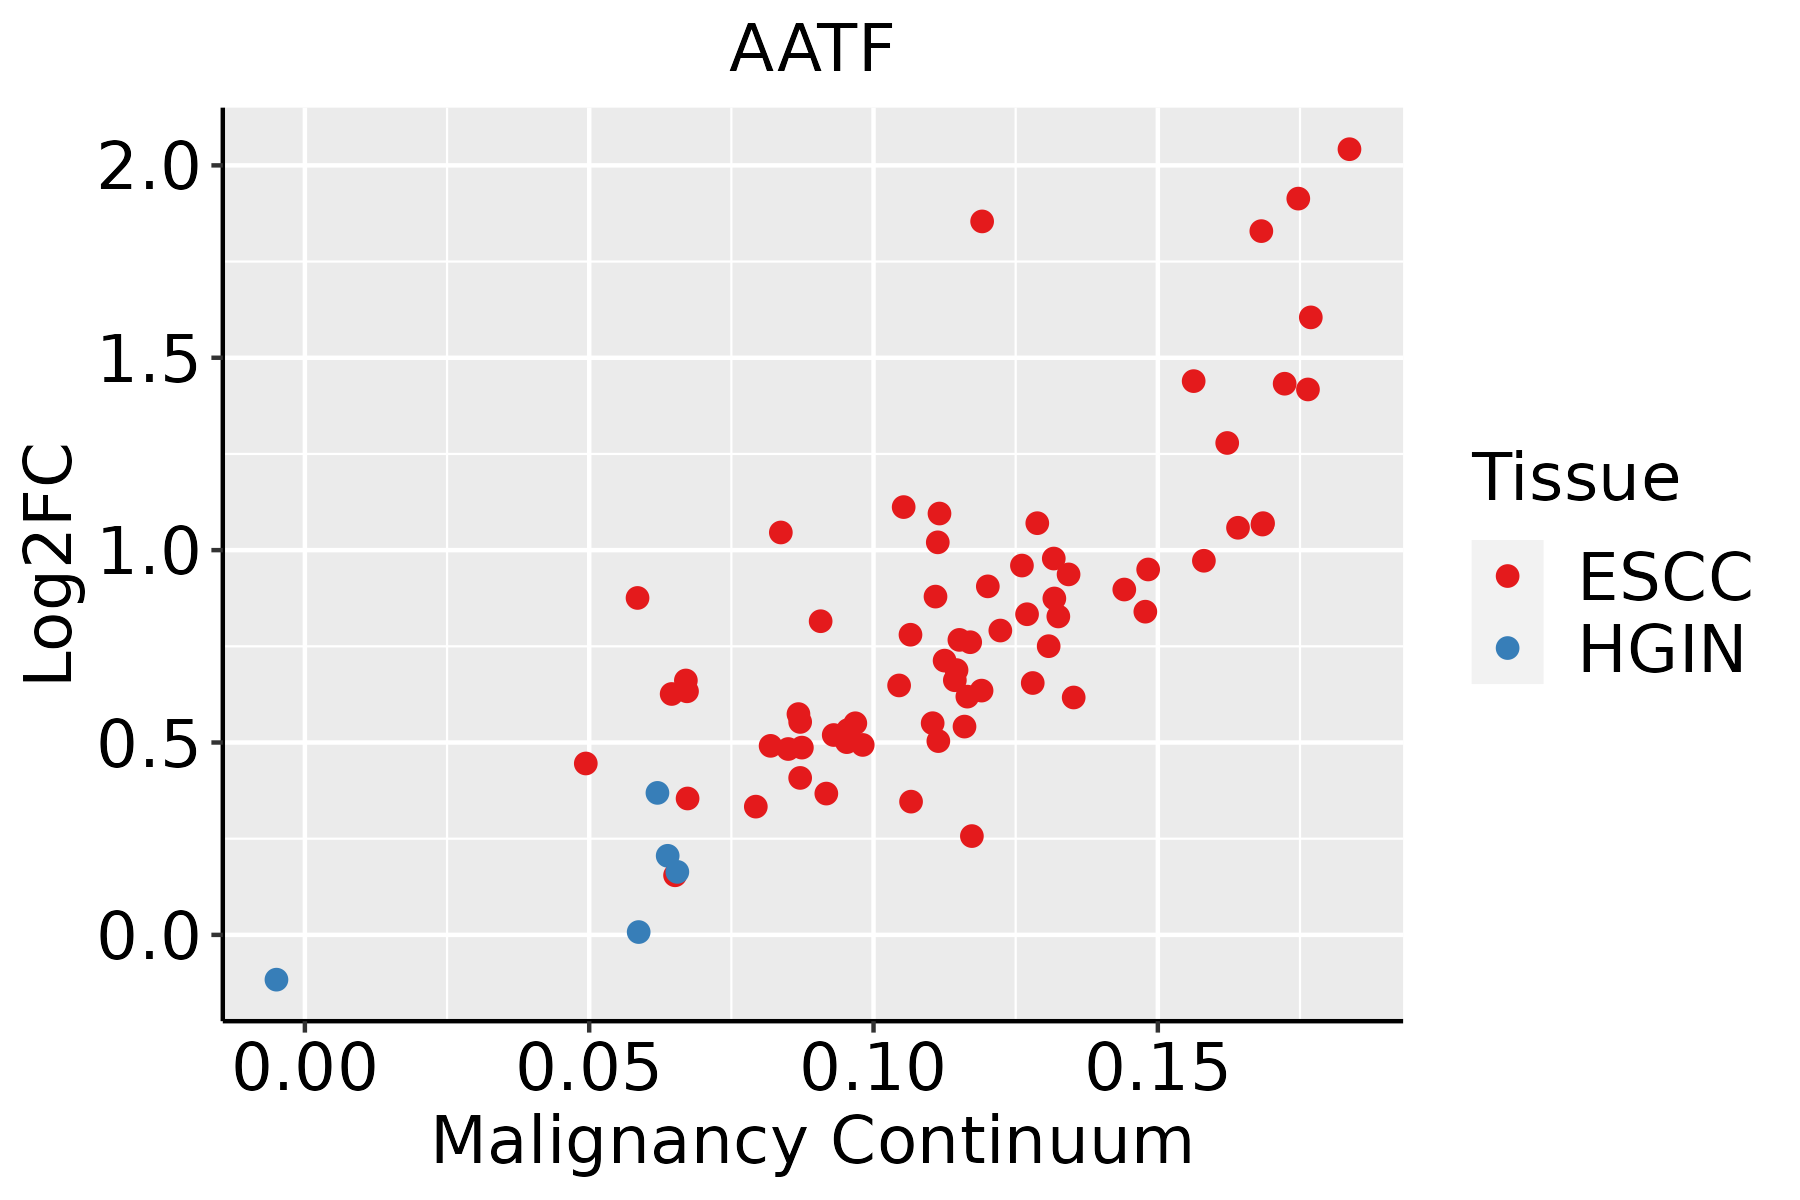 | ESCC: Esophageal squamous cell carcinoma |
| HGIN: High-grade intraepithelial neoplasias | ||
| LGIN: Low-grade intraepithelial neoplasias | ||
| Liver | 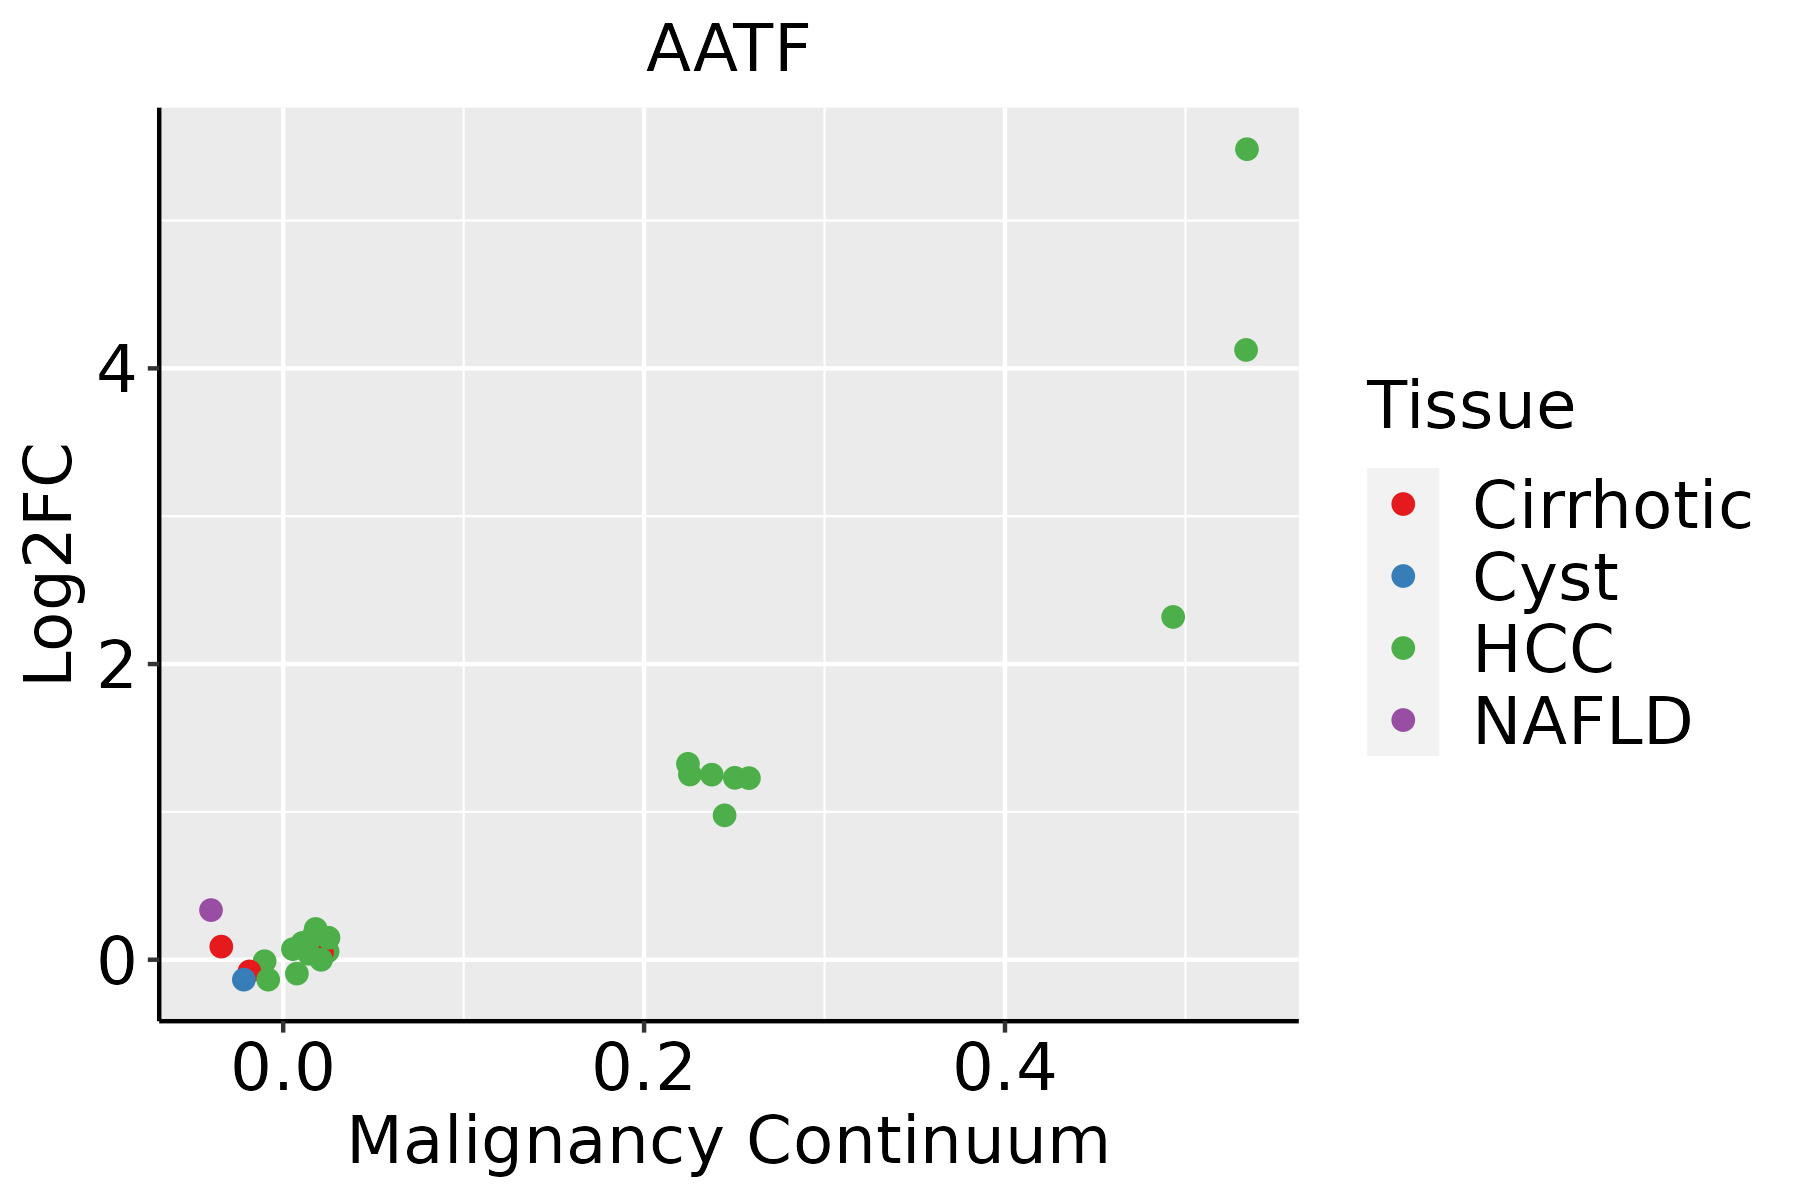 | HCC: Hepatocellular carcinoma |
| NAFLD: Non-alcoholic fatty liver disease | ||
| Oral Cavity | 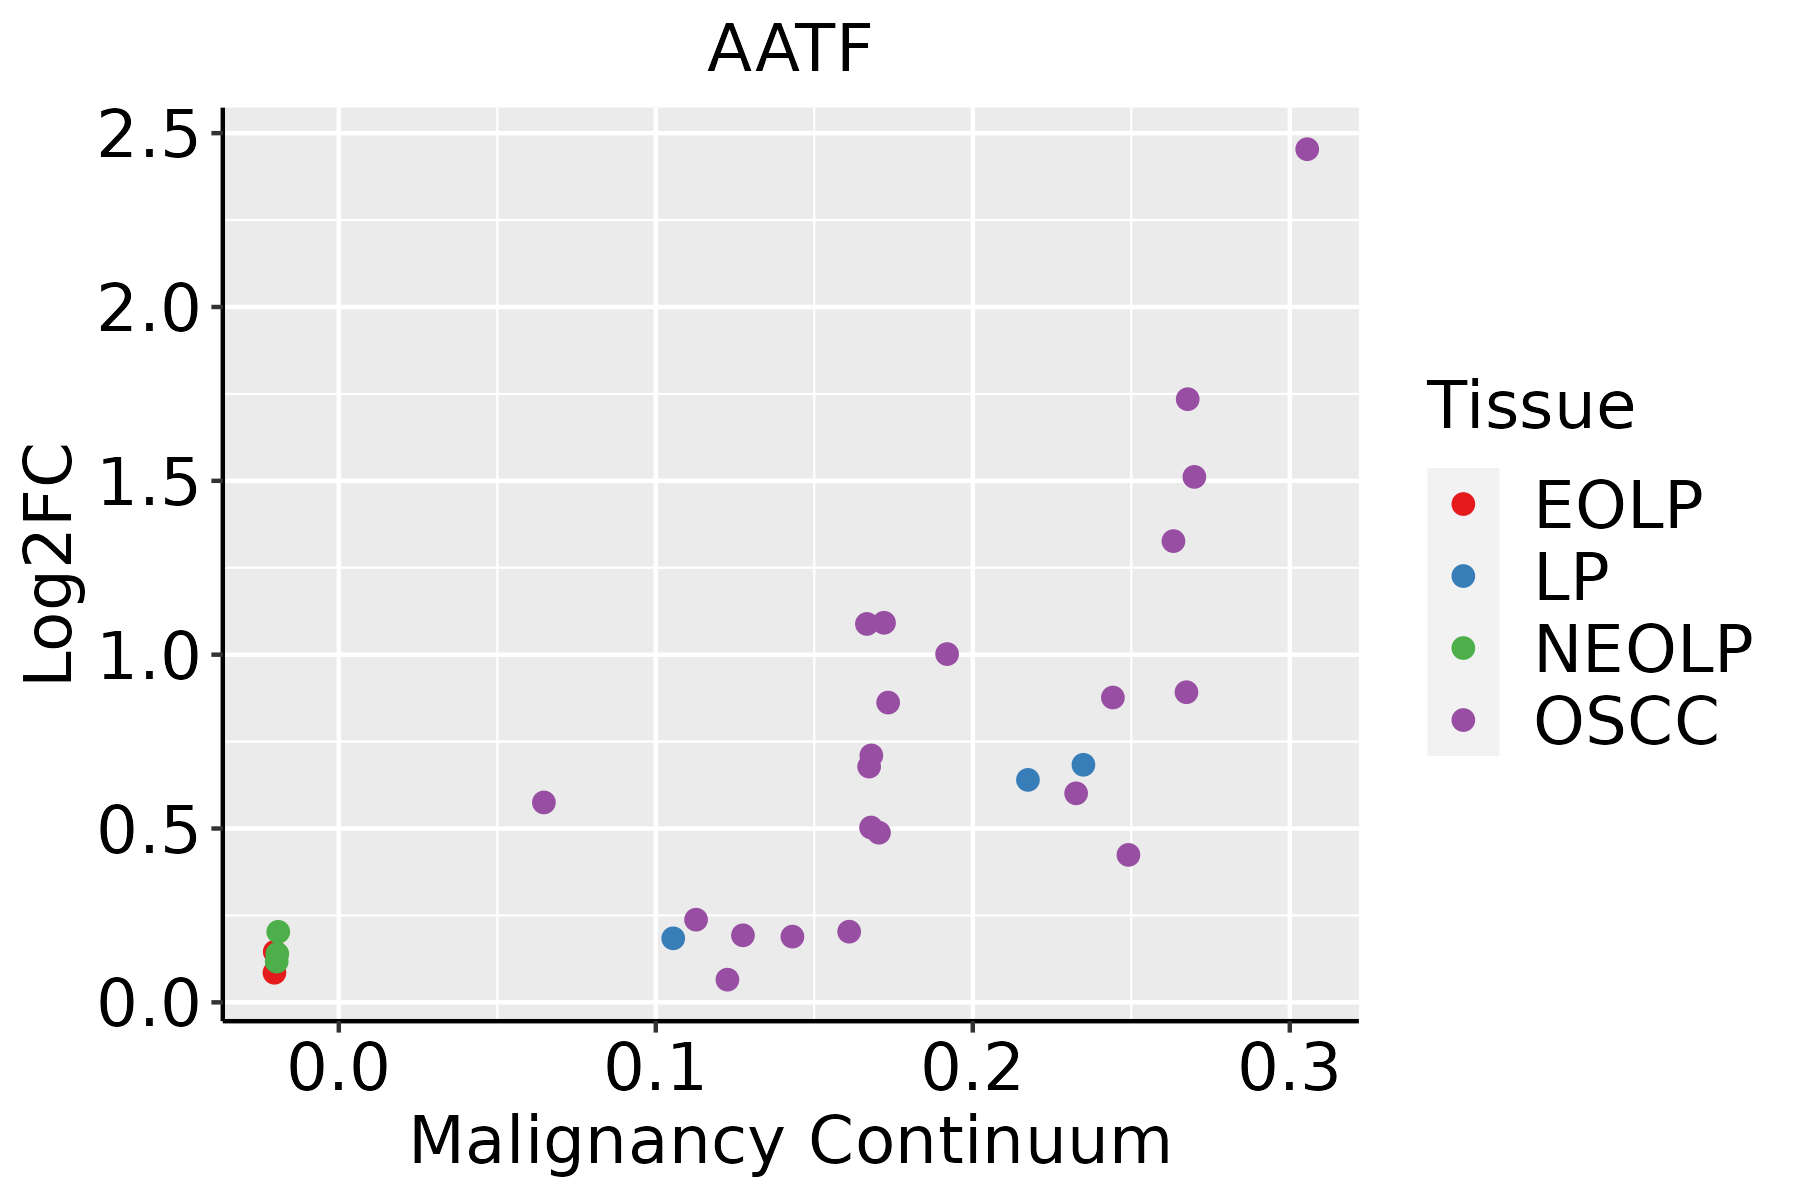 | EOLP: Erosive Oral lichen planus |
| LP: leukoplakia | ||
| NEOLP: Non-erosive oral lichen planus | ||
| OSCC: Oral squamous cell carcinoma | ||
| Skin | 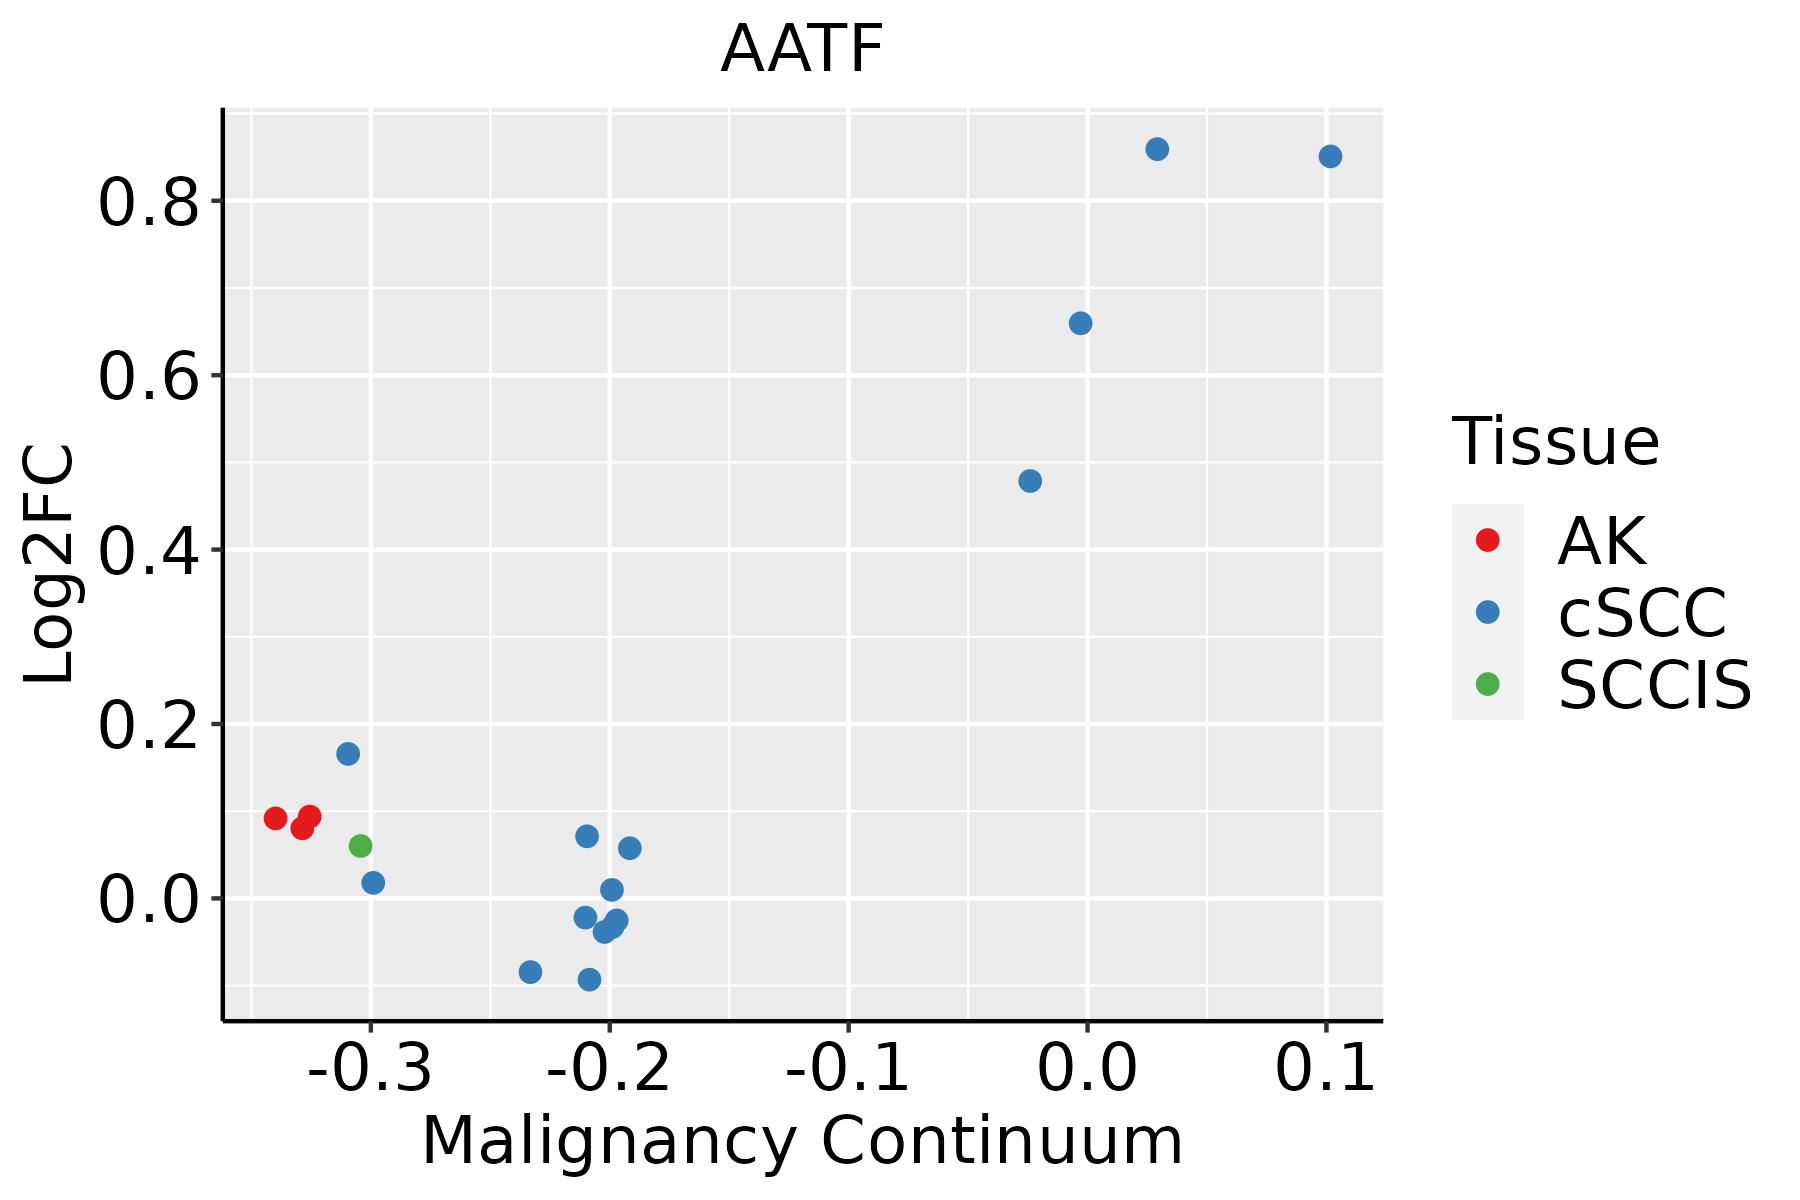 | AK: Actinic keratosis |
| cSCC: Cutaneous squamous cell carcinoma | ||
| SCCIS:squamous cell carcinoma in situ | ||
| Thyroid | 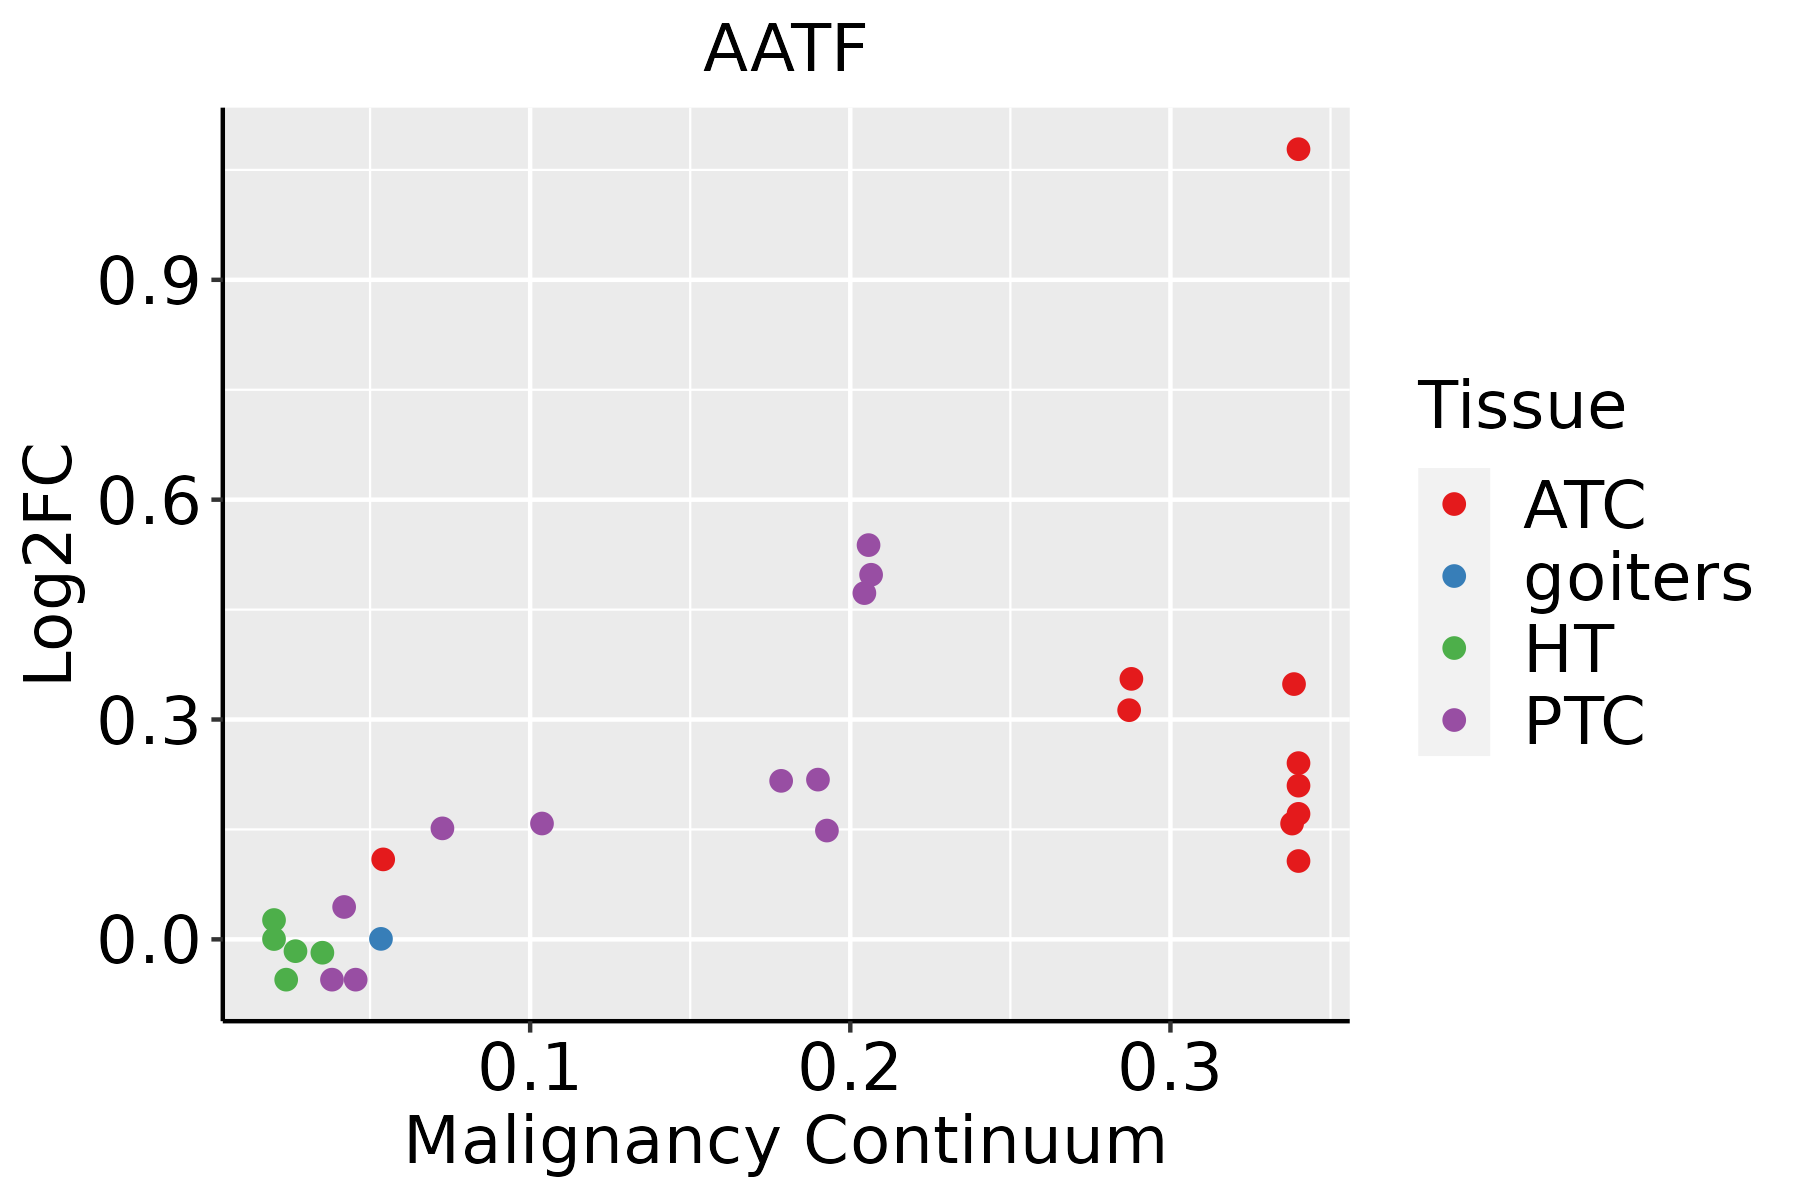 | ATC: Anaplastic thyroid cancer |
| HT: Hashimoto's thyroiditis | ||
| PTC: Papillary thyroid cancer |
| ∗log2FC in expression of this searched gene in stem-like cells from each diseased tissue sample relative to stem-like cells in normal samples in each tissue plotted against the malignancy continuum. Samples are colored based on if they are from different disease stage. |
Top |
Malignant transformation related pathway analysis |
| Find out the enriched GO biological processes and KEGG pathways involved in transition from healthy to precancer to cancer |
| Tissue | Disease Stage | Enriched GO biological Processes |
| Colorectum | AD |  |
| Colorectum | SER |  |
| Colorectum | MSS |  |
| Colorectum | MSI-H |  |
| Colorectum | FAP |  |
| ∗Top 15 enriched GO BP terms are showed in the bar plot of each disease state in each tissue. Each row represents a significant GO biological process which is colored according to the -log10(p.adjust). |
| Page: 1 2 3 4 5 6 7 8 9 |
| GO ID | Tissue | Disease Stage | Description | Gene Ratio | Bg Ratio | pvalue | p.adjust | Count |
| GO:0022613111 | Esophagus | ESCC | ribonucleoprotein complex biogenesis | 365/8552 | 463/18723 | 1.74e-49 | 1.11e-45 | 365 |
| GO:0042254111 | Esophagus | ESCC | ribosome biogenesis | 252/8552 | 299/18723 | 3.27e-44 | 1.04e-40 | 252 |
| GO:2001233111 | Esophagus | ESCC | regulation of apoptotic signaling pathway | 256/8552 | 356/18723 | 4.11e-24 | 1.04e-21 | 256 |
| GO:000734615 | Esophagus | ESCC | regulation of mitotic cell cycle | 293/8552 | 457/18723 | 8.00e-16 | 5.64e-14 | 293 |
| GO:2001234111 | Esophagus | ESCC | negative regulation of apoptotic signaling pathway | 161/8552 | 224/18723 | 1.24e-15 | 8.09e-14 | 161 |
| GO:00091002 | Esophagus | ESCC | glycoprotein metabolic process | 226/8552 | 387/18723 | 2.64e-07 | 3.94e-06 | 226 |
| GO:200037718 | Esophagus | ESCC | regulation of reactive oxygen species metabolic process | 100/8552 | 157/18723 | 3.87e-06 | 4.17e-05 | 100 |
| GO:00091012 | Esophagus | ESCC | glycoprotein biosynthetic process | 181/8552 | 317/18723 | 2.54e-05 | 2.15e-04 | 181 |
| GO:007259318 | Esophagus | ESCC | reactive oxygen species metabolic process | 137/8552 | 239/18723 | 1.82e-04 | 1.16e-03 | 137 |
| GO:20003783 | Esophagus | ESCC | negative regulation of reactive oxygen species metabolic process | 34/8552 | 52/18723 | 3.26e-03 | 1.35e-02 | 34 |
| GO:00226137 | Liver | NAFLD | ribonucleoprotein complex biogenesis | 76/1882 | 463/18723 | 1.19e-05 | 3.67e-04 | 76 |
| GO:00422547 | Liver | NAFLD | ribosome biogenesis | 52/1882 | 299/18723 | 6.03e-05 | 1.32e-03 | 52 |
| GO:20012337 | Liver | NAFLD | regulation of apoptotic signaling pathway | 57/1882 | 356/18723 | 2.73e-04 | 4.41e-03 | 57 |
| GO:20003777 | Liver | NAFLD | regulation of reactive oxygen species metabolic process | 28/1882 | 157/18723 | 1.91e-03 | 1.93e-02 | 28 |
| GO:002261322 | Liver | HCC | ribonucleoprotein complex biogenesis | 355/7958 | 463/18723 | 7.76e-52 | 4.92e-48 | 355 |
| GO:004225422 | Liver | HCC | ribosome biogenesis | 246/7958 | 299/18723 | 4.99e-46 | 1.58e-42 | 246 |
| GO:200123322 | Liver | HCC | regulation of apoptotic signaling pathway | 226/7958 | 356/18723 | 7.26e-16 | 5.68e-14 | 226 |
| GO:200123412 | Liver | HCC | negative regulation of apoptotic signaling pathway | 145/7958 | 224/18723 | 1.33e-11 | 5.36e-10 | 145 |
| GO:000734611 | Liver | HCC | regulation of mitotic cell cycle | 255/7958 | 457/18723 | 4.96e-09 | 1.30e-07 | 255 |
| GO:200037722 | Liver | HCC | regulation of reactive oxygen species metabolic process | 92/7958 | 157/18723 | 3.34e-05 | 3.35e-04 | 92 |
| Page: 1 2 3 4 |
| Pathway ID | Tissue | Disease Stage | Description | Gene Ratio | Bg Ratio | pvalue | p.adjust | qvalue | Count |
| Page: 1 |
Top |
Cell-cell communication analysis |
| Identification of potential cell-cell interactions between two cell types and their ligand-receptor pairs for different disease states |
| Ligand | Receptor | LRpair | Pathway | Tissue | Disease Stage |
| Page: 1 |
Top |
Single-cell gene regulatory network inference analysis |
| Find out the significant the regulons (TFs) and the target genes of each regulon across cell types for different disease states |
| TF | Cell Type | Tissue | Disease Stage | Target Gene | RSS | Regulon Activity |
| ∗The dot plots of a searched regulon are shown for all cell subpopulations in each disease state of each tissue based on the regulon specific score inferred using pySCENIC and by calculating the average expression. |
| Page: 1 |
Top |
Somatic mutation of malignant transformation related genes |
| Annotation of somatic variants for genes involved in malignant transformation |
| Hugo Symbol | Variant Class | Variant Classification | dbSNP RS | HGVSc | HGVSp | HGVSp Short | SWISSPROT | BIOTYPE | SIFT | PolyPhen | Tumor Sample Barcode | Tissue | Histology | Sex | Age | Stage | Therapy Types | Drugs | Outcome |
| AATF | SNV | Missense_Mutation | novel | c.959N>A | p.Ser320Tyr | p.S320Y | Q9NY61 | protein_coding | deleterious(0.05) | possibly_damaging(0.744) | TCGA-AN-A046-01 | Breast | breast invasive carcinoma | Female | >=65 | I/II | Unknown | Unknown | SD |
| AATF | SNV | Missense_Mutation | rs370934170 | c.1189N>A | p.Asp397Asn | p.D397N | Q9NY61 | protein_coding | deleterious(0) | benign(0.125) | TCGA-2W-A8YY-01 | Cervix | cervical & endocervical cancer | Female | <65 | I/II | Chemotherapy | cisplatin | CR |
| AATF | SNV | Missense_Mutation | novel | c.1020G>C | p.Lys340Asn | p.K340N | Q9NY61 | protein_coding | deleterious(0) | possibly_damaging(0.841) | TCGA-C5-A7UI-01 | Cervix | cervical & endocervical cancer | Female | <65 | I/II | Unknown | Unknown | SD |
| AATF | SNV | Missense_Mutation | novel | c.908C>T | p.Thr303Ile | p.T303I | Q9NY61 | protein_coding | deleterious(0.05) | benign(0.349) | TCGA-VS-A9UH-01 | Cervix | cervical & endocervical cancer | Female | <65 | I/II | Chemotherapy | cisplatin | CR |
| AATF | SNV | Missense_Mutation | novel | c.833N>A | p.Ser278Asn | p.S278N | Q9NY61 | protein_coding | tolerated(0.15) | benign(0.06) | TCGA-AA-A00N-01 | Colorectum | colon adenocarcinoma | Male | >=65 | I/II | Unknown | Unknown | PD |
| AATF | SNV | Missense_Mutation | rs199725061 | c.1546C>T | p.Arg516Trp | p.R516W | Q9NY61 | protein_coding | deleterious(0) | probably_damaging(1) | TCGA-AA-A010-01 | Colorectum | colon adenocarcinoma | Female | <65 | I/II | Chemotherapy | folinic | CR |
| AATF | SNV | Missense_Mutation | rs200375945 | c.941N>T | p.Ala314Val | p.A314V | Q9NY61 | protein_coding | tolerated(0.16) | benign(0.007) | TCGA-G4-6628-01 | Colorectum | colon adenocarcinoma | Male | >=65 | I/II | Unknown | Unknown | SD |
| AATF | SNV | Missense_Mutation | novel | c.1553N>G | p.His518Arg | p.H518R | Q9NY61 | protein_coding | deleterious(0.01) | possibly_damaging(0.788) | TCGA-NH-A5IV-01 | Colorectum | colon adenocarcinoma | Female | >=65 | I/II | Unknown | Unknown | SD |
| AATF | SNV | Missense_Mutation | novel | c.291N>C | p.Glu97Asp | p.E97D | Q9NY61 | protein_coding | tolerated(0.24) | benign(0.003) | TCGA-F5-6814-01 | Colorectum | rectum adenocarcinoma | Male | <65 | I/II | Unknown | Unknown | SD |
| AATF | SNV | Missense_Mutation | rs770259796 | c.1241N>A | p.Arg414His | p.R414H | Q9NY61 | protein_coding | deleterious(0) | probably_damaging(0.999) | TCGA-A5-A1OF-01 | Endometrium | uterine corpus endometrioid carcinoma | Female | <65 | I/II | Unknown | Unknown | SD |
| Page: 1 2 3 4 5 |
Top |
Related drugs of malignant transformation related genes |
| Identification of chemicals and drugs interact with genes involved in malignant transfromation |
| (DGIdb 4.0) |
| Entrez ID | Symbol | Category | Interaction Types | Drug Claim Name | Drug Name | PMIDs |
| Page: 1 |

Copyright 2023-Present -The University of Texas Health Science Center at Houston |