
|
|||||
|
 | |
| |
| |
| |
| |
| |
|
Gene: AASS |
Gene summary for AASS |
| Gene information | Species | Human | Gene symbol | AASS | Gene ID | 10157 |
| Gene name | aminoadipate-semialdehyde synthase | |
| Gene Alias | LKR/SDH | |
| Cytomap | 7q31.32 | |
| Gene Type | protein-coding | GO ID | GO:0000122 | UniProtAcc | A4D0W4 |
Top |
Malignant transformation analysis |
| Identification of the aberrant gene expression in precancerous and cancerous lesions by comparing the gene expression of stem-like cells in diseased tissues with normal stem cells |
| Entrez ID | Symbol | Replicates | Species | Organ | Tissue | Adj P-value | Log2FC | Malignancy |
| 10157 | AASS | NAFLD1 | Human | Liver | NAFLD | 8.29e-11 | 1.08e+00 | -0.04 |
| 10157 | AASS | S41 | Human | Liver | Cirrhotic | 8.90e-04 | 6.38e-01 | -0.0343 |
| 10157 | AASS | HCC1_Meng | Human | Liver | HCC | 8.02e-06 | -1.96e-01 | 0.0246 |
| 10157 | AASS | HCC2_Meng | Human | Liver | HCC | 2.60e-03 | -2.02e-01 | 0.0107 |
| 10157 | AASS | HCC1 | Human | Liver | HCC | 3.15e-12 | 3.20e+00 | 0.5336 |
| 10157 | AASS | HCC2 | Human | Liver | HCC | 4.11e-08 | 3.36e+00 | 0.5341 |
| 10157 | AASS | RNA-P10T2-P10T2-1 | Human | Lung | AAH | 1.51e-05 | 8.32e-01 | -0.1271 |
| 10157 | AASS | RNA-P10T2-P10T2-3 | Human | Lung | AAH | 1.25e-03 | 7.06e-01 | -0.1408 |
| 10157 | AASS | RNA-P10T2-P10T2-4 | Human | Lung | AAH | 7.56e-03 | 7.10e-01 | -0.138 |
| 10157 | AASS | RNA-P18T-P18T-2 | Human | Lung | IAC | 6.10e-03 | 9.96e-01 | 0.1129 |
| 10157 | AASS | RNA-P25T1-P25T1-1 | Human | Lung | AIS | 9.74e-16 | 6.70e-01 | -0.2116 |
| 10157 | AASS | RNA-P25T1-P25T1-2 | Human | Lung | AIS | 8.04e-06 | 6.24e-01 | -0.1941 |
| 10157 | AASS | RNA-P25T1-P25T1-3 | Human | Lung | AIS | 1.64e-06 | 6.51e-01 | -0.2107 |
| 10157 | AASS | RNA-P25T1-P25T1-4 | Human | Lung | AIS | 1.02e-11 | 6.45e-01 | -0.2119 |
| 10157 | AASS | RNA-P6T2-P6T2-1 | Human | Lung | IAC | 2.96e-28 | 8.32e-01 | -0.0166 |
| 10157 | AASS | RNA-P6T2-P6T2-2 | Human | Lung | IAC | 3.13e-26 | 7.50e-01 | -0.0132 |
| 10157 | AASS | RNA-P6T2-P6T2-3 | Human | Lung | IAC | 8.29e-27 | 7.25e-01 | -0.013 |
| 10157 | AASS | RNA-P6T2-P6T2-4 | Human | Lung | IAC | 8.70e-26 | 7.28e-01 | -0.0121 |
| 10157 | AASS | RNA-P7T1-P7T1-1 | Human | Lung | AIS | 1.05e-13 | 1.11e+00 | -0.0961 |
| 10157 | AASS | RNA-P7T1-P7T1-2 | Human | Lung | AIS | 2.00e-16 | 1.21e+00 | -0.0876 |
| Page: 1 2 |
| Tissue | Expression Dynamics | Abbreviation |
| Liver | 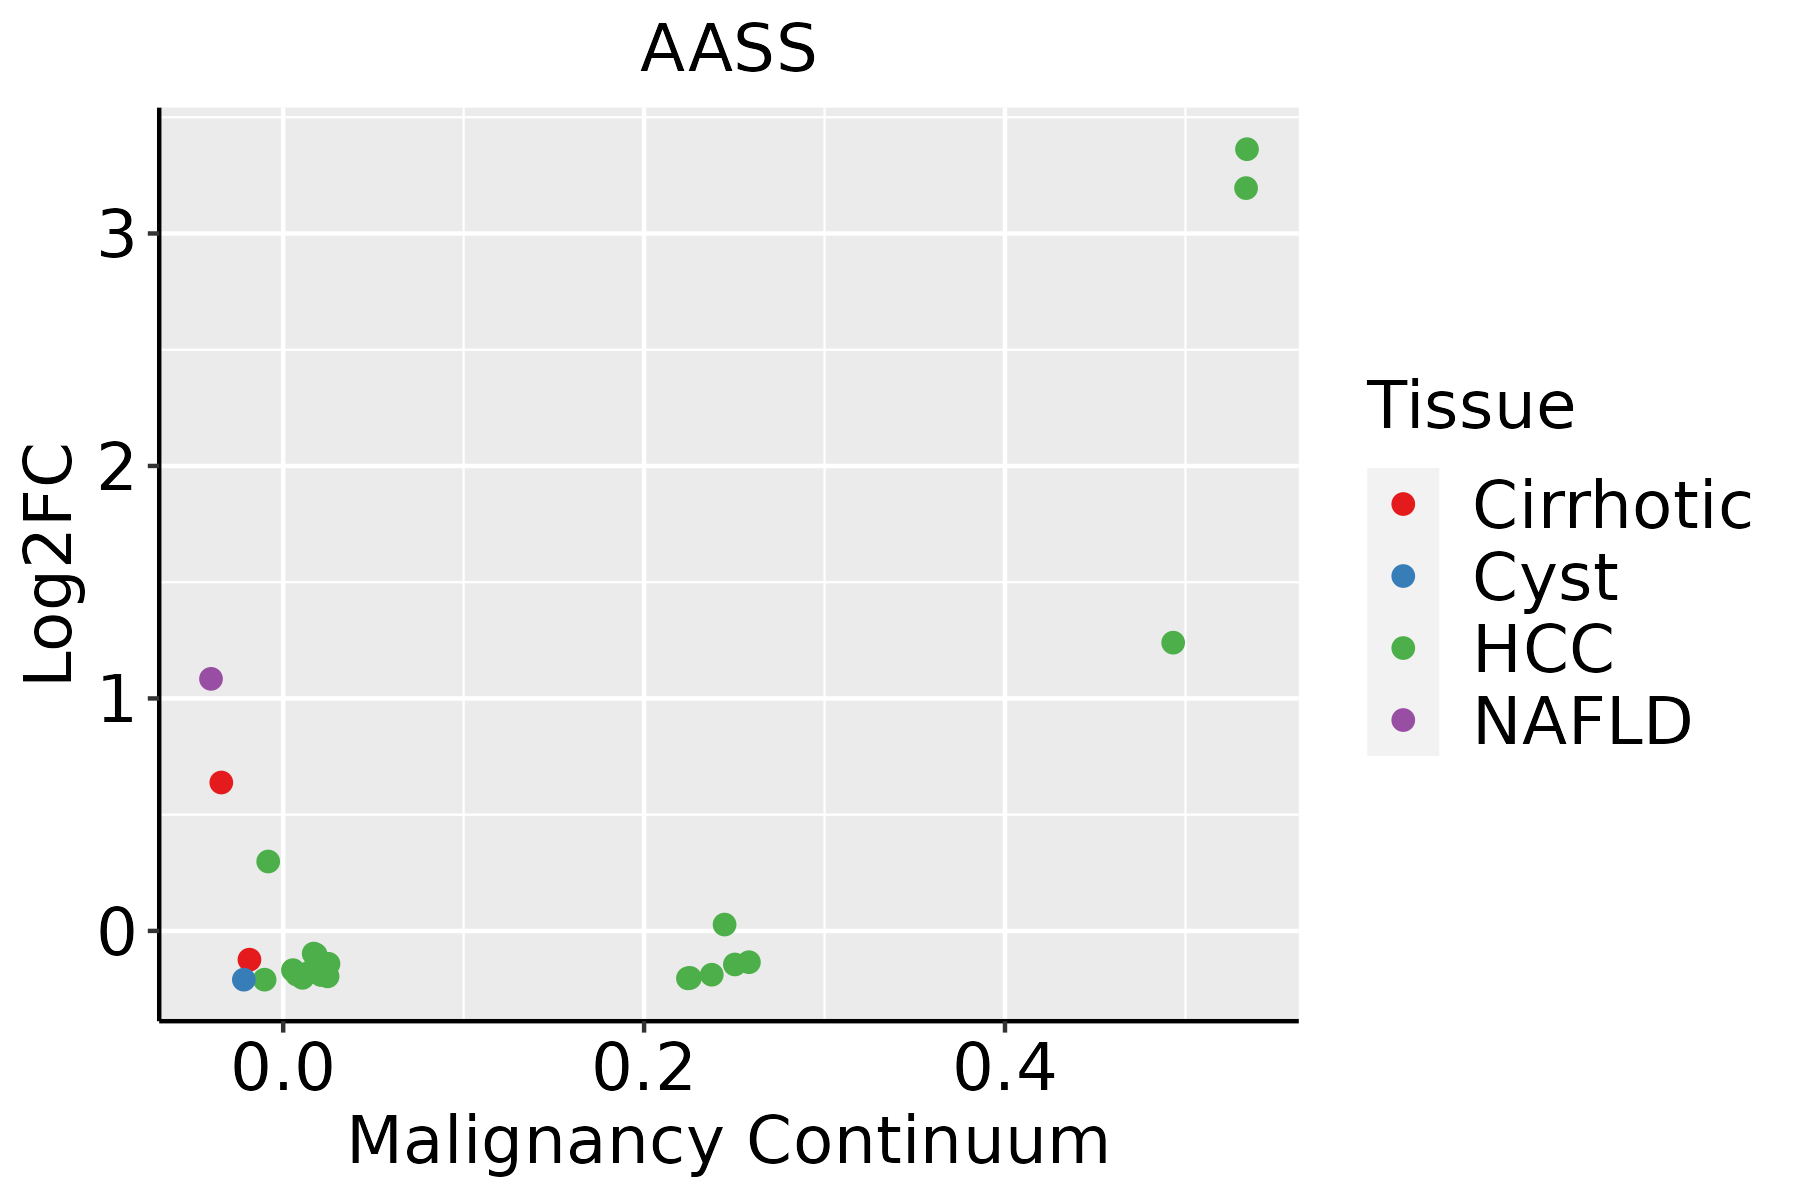 | HCC: Hepatocellular carcinoma |
| NAFLD: Non-alcoholic fatty liver disease | ||
| Lung |  | AAH: Atypical adenomatous hyperplasia |
| AIS: Adenocarcinoma in situ | ||
| IAC: Invasive lung adenocarcinoma | ||
| MIA: Minimally invasive adenocarcinoma |
| ∗log2FC in expression of this searched gene in stem-like cells from each diseased tissue sample relative to stem-like cells in normal samples in each tissue plotted against the malignancy continuum. Samples are colored based on if they are from different disease stage. |
Top |
Malignant transformation related pathway analysis |
| Find out the enriched GO biological processes and KEGG pathways involved in transition from healthy to precancer to cancer |
| Tissue | Disease Stage | Enriched GO biological Processes |
| Colorectum | AD |  |
| Colorectum | SER |  |
| Colorectum | MSS |  |
| Colorectum | MSI-H |  |
| Colorectum | FAP |  |
| ∗Top 15 enriched GO BP terms are showed in the bar plot of each disease state in each tissue. Each row represents a significant GO biological process which is colored according to the -log10(p.adjust). |
| Page: 1 2 3 4 5 6 7 8 9 |
| GO ID | Tissue | Disease Stage | Description | Gene Ratio | Bg Ratio | pvalue | p.adjust | Count |
| GO:00463953 | Liver | NAFLD | carboxylic acid catabolic process | 73/1882 | 236/18723 | 4.16e-19 | 1.22e-15 | 73 |
| GO:00160544 | Liver | NAFLD | organic acid catabolic process | 73/1882 | 240/18723 | 1.20e-18 | 2.34e-15 | 73 |
| GO:00442825 | Liver | NAFLD | small molecule catabolic process | 91/1882 | 376/18723 | 8.96e-16 | 1.31e-12 | 91 |
| GO:00160535 | Liver | NAFLD | organic acid biosynthetic process | 77/1882 | 316/18723 | 1.03e-13 | 6.69e-11 | 77 |
| GO:00463945 | Liver | NAFLD | carboxylic acid biosynthetic process | 75/1882 | 314/18723 | 6.37e-13 | 3.39e-10 | 75 |
| GO:0009063 | Liver | NAFLD | cellular amino acid catabolic process | 36/1882 | 110/18723 | 6.56e-11 | 1.99e-08 | 36 |
| GO:00165703 | Liver | NAFLD | histone modification | 90/1882 | 463/18723 | 5.74e-10 | 1.28e-07 | 90 |
| GO:00065203 | Liver | NAFLD | cellular amino acid metabolic process | 63/1882 | 284/18723 | 1.14e-09 | 2.17e-07 | 63 |
| GO:00086523 | Liver | NAFLD | cellular amino acid biosynthetic process | 26/1882 | 76/18723 | 1.00e-08 | 1.33e-06 | 26 |
| GO:19016053 | Liver | NAFLD | alpha-amino acid metabolic process | 46/1882 | 195/18723 | 2.74e-08 | 2.86e-06 | 46 |
| GO:00092596 | Liver | NAFLD | ribonucleotide metabolic process | 72/1882 | 385/18723 | 1.51e-07 | 1.09e-05 | 72 |
| GO:00196936 | Liver | NAFLD | ribose phosphate metabolic process | 73/1882 | 396/18723 | 2.23e-07 | 1.53e-05 | 73 |
| GO:00091177 | Liver | NAFLD | nucleotide metabolic process | 85/1882 | 489/18723 | 3.31e-07 | 2.18e-05 | 85 |
| GO:19016073 | Liver | NAFLD | alpha-amino acid biosynthetic process | 22/1882 | 68/18723 | 4.13e-07 | 2.62e-05 | 22 |
| GO:00067537 | Liver | NAFLD | nucleoside phosphate metabolic process | 85/1882 | 497/18723 | 6.69e-07 | 3.83e-05 | 85 |
| GO:00725217 | Liver | NAFLD | purine-containing compound metabolic process | 74/1882 | 416/18723 | 7.73e-07 | 4.27e-05 | 74 |
| GO:1901606 | Liver | NAFLD | alpha-amino acid catabolic process | 25/1882 | 87/18723 | 8.67e-07 | 4.60e-05 | 25 |
| GO:00091507 | Liver | NAFLD | purine ribonucleotide metabolic process | 67/1882 | 368/18723 | 1.10e-06 | 5.44e-05 | 67 |
| GO:00061637 | Liver | NAFLD | purine nucleotide metabolic process | 70/1882 | 396/18723 | 1.93e-06 | 8.23e-05 | 70 |
| GO:00067904 | Liver | NAFLD | sulfur compound metabolic process | 58/1882 | 339/18723 | 3.79e-05 | 9.38e-04 | 58 |
| Page: 1 2 3 4 5 6 7 |
| Pathway ID | Tissue | Disease Stage | Description | Gene Ratio | Bg Ratio | pvalue | p.adjust | qvalue | Count |
| hsa003109 | Lung | IAC | Lysine degradation | 17/1053 | 63/8465 | 1.35e-03 | 8.63e-03 | 5.73e-03 | 17 |
| hsa0031012 | Lung | IAC | Lysine degradation | 17/1053 | 63/8465 | 1.35e-03 | 8.63e-03 | 5.73e-03 | 17 |
| hsa0031022 | Lung | AIS | Lysine degradation | 16/961 | 63/8465 | 1.41e-03 | 9.49e-03 | 6.07e-03 | 16 |
| hsa0031032 | Lung | AIS | Lysine degradation | 16/961 | 63/8465 | 1.41e-03 | 9.49e-03 | 6.07e-03 | 16 |
| Page: 1 |
Top |
Cell-cell communication analysis |
| Identification of potential cell-cell interactions between two cell types and their ligand-receptor pairs for different disease states |
| Ligand | Receptor | LRpair | Pathway | Tissue | Disease Stage |
| Page: 1 |
Top |
Single-cell gene regulatory network inference analysis |
| Find out the significant the regulons (TFs) and the target genes of each regulon across cell types for different disease states |
| TF | Cell Type | Tissue | Disease Stage | Target Gene | RSS | Regulon Activity |
| ∗The dot plots of a searched regulon are shown for all cell subpopulations in each disease state of each tissue based on the regulon specific score inferred using pySCENIC and by calculating the average expression. |
| Page: 1 |
Top |
Somatic mutation of malignant transformation related genes |
| Annotation of somatic variants for genes involved in malignant transformation |
| Hugo Symbol | Variant Class | Variant Classification | dbSNP RS | HGVSc | HGVSp | HGVSp Short | SWISSPROT | BIOTYPE | SIFT | PolyPhen | Tumor Sample Barcode | Tissue | Histology | Sex | Age | Stage | Therapy Types | Drugs | Outcome |
| AASS | SNV | Missense_Mutation | rs746536178 | c.788N>T | p.Thr263Met | p.T263M | Q9UDR5 | protein_coding | deleterious(0) | probably_damaging(0.986) | TCGA-A2-A0EN-01 | Breast | breast invasive carcinoma | Female | >=65 | I/II | Hormone Therapy | tamoxiphen | SD |
| AASS | SNV | Missense_Mutation | c.1004N>T | p.Ser335Leu | p.S335L | Q9UDR5 | protein_coding | tolerated(0.74) | benign(0.243) | TCGA-AC-A23H-01 | Breast | breast invasive carcinoma | Female | >=65 | I/II | Unknown | Unknown | PD | |
| AASS | SNV | Missense_Mutation | c.1301C>T | p.Pro434Leu | p.P434L | Q9UDR5 | protein_coding | deleterious(0) | probably_damaging(0.913) | TCGA-C8-A1HI-01 | Breast | breast invasive carcinoma | Female | <65 | III/IV | Unknown | Unknown | SD | |
| AASS | insertion | Nonsense_Mutation | novel | c.2278_2279insAGT | p.Thr759_Trp760insTer | p.T759_W760ins* | Q9UDR5 | protein_coding | TCGA-A7-A0CD-01 | Breast | breast invasive carcinoma | Female | >=65 | I/II | Hormone Therapy | arimidex | SD | ||
| AASS | insertion | Nonsense_Mutation | novel | c.2276_2277insTTGGACTTCCTGAAAGTGAGAATCCATGAGAGTTA | p.Lys761ThrfsTer3 | p.K761Tfs*3 | Q9UDR5 | protein_coding | TCGA-A7-A0CD-01 | Breast | breast invasive carcinoma | Female | >=65 | I/II | Hormone Therapy | arimidex | SD | ||
| AASS | insertion | Nonsense_Mutation | novel | c.1190_1191insTTTATAATGGTAAATGTTTAA | p.Met397delinsIleLeuTerTrpTerMetPheLys | p.M397delinsIL*W*MFK | Q9UDR5 | protein_coding | TCGA-AO-A0JB-01 | Breast | breast invasive carcinoma | Female | <65 | III/IV | Chemotherapy | cyclophosphamide | SD | ||
| AASS | deletion | Frame_Shift_Del | novel | c.2015delN | p.Lys672ArgfsTer3 | p.K672Rfs*3 | Q9UDR5 | protein_coding | TCGA-D8-A27V-01 | Breast | breast invasive carcinoma | Female | <65 | I/II | Hormone Therapy | tamoxiphen | SD | ||
| AASS | deletion | Frame_Shift_Del | novel | c.2390delN | p.Ala797ValfsTer28 | p.A797Vfs*28 | Q9UDR5 | protein_coding | TCGA-EW-A2FV-01 | Breast | breast invasive carcinoma | Female | <65 | III/IV | Chemotherapy | docetaxel | SD | ||
| AASS | SNV | Missense_Mutation | rs756447554 | c.824C>T | p.Thr275Ile | p.T275I | Q9UDR5 | protein_coding | tolerated(0.23) | benign(0.329) | TCGA-2W-A8YY-01 | Cervix | cervical & endocervical cancer | Female | <65 | I/II | Chemotherapy | cisplatin | CR |
| AASS | SNV | Missense_Mutation | c.2554G>A | p.Glu852Lys | p.E852K | Q9UDR5 | protein_coding | deleterious(0) | possibly_damaging(0.549) | TCGA-IR-A3LA-01 | Cervix | cervical & endocervical cancer | Female | <65 | I/II | Chemotherapy | cisplatin | CR |
| Page: 1 2 3 4 5 6 7 8 9 10 11 12 13 |
Top |
Related drugs of malignant transformation related genes |
| Identification of chemicals and drugs interact with genes involved in malignant transfromation |
| (DGIdb 4.0) |
| Entrez ID | Symbol | Category | Interaction Types | Drug Claim Name | Drug Name | PMIDs |
| Page: 1 |

Copyright 2023-Present -The University of Texas Health Science Center at Houston |