
|
|||||
|
 | |
| |
| |
| |
| |
| |
|
Gene: AASDHPPT |
Gene summary for AASDHPPT |
| Gene information | Species | Human | Gene symbol | AASDHPPT | Gene ID | 60496 |
| Gene name | aminoadipate-semialdehyde dehydrogenase-phosphopantetheinyl transferase | |
| Gene Alias | AASD-PPT | |
| Cytomap | 11q22.3 | |
| Gene Type | protein-coding | GO ID | GO:0006082 | UniProtAcc | Q9NRN7 |
Top |
Malignant transformation analysis |
| Identification of the aberrant gene expression in precancerous and cancerous lesions by comparing the gene expression of stem-like cells in diseased tissues with normal stem cells |
| Entrez ID | Symbol | Replicates | Species | Organ | Tissue | Adj P-value | Log2FC | Malignancy |
| 60496 | AASDHPPT | LZE2T | Human | Esophagus | ESCC | 2.94e-02 | 3.79e-01 | 0.082 |
| 60496 | AASDHPPT | LZE4T | Human | Esophagus | ESCC | 2.48e-23 | 6.08e-01 | 0.0811 |
| 60496 | AASDHPPT | LZE7T | Human | Esophagus | ESCC | 3.44e-06 | 2.31e-01 | 0.0667 |
| 60496 | AASDHPPT | LZE8T | Human | Esophagus | ESCC | 1.26e-11 | 3.65e-01 | 0.067 |
| 60496 | AASDHPPT | LZE20T | Human | Esophagus | ESCC | 3.53e-07 | 1.94e-01 | 0.0662 |
| 60496 | AASDHPPT | LZE22D1 | Human | Esophagus | HGIN | 4.81e-13 | 4.91e-01 | 0.0595 |
| 60496 | AASDHPPT | LZE22T | Human | Esophagus | ESCC | 2.57e-17 | 1.63e+00 | 0.068 |
| 60496 | AASDHPPT | LZE24T | Human | Esophagus | ESCC | 1.48e-31 | 7.24e-01 | 0.0596 |
| 60496 | AASDHPPT | LZE6T | Human | Esophagus | ESCC | 7.75e-14 | 5.28e-01 | 0.0845 |
| 60496 | AASDHPPT | P1T-E | Human | Esophagus | ESCC | 7.62e-03 | 1.72e-01 | 0.0875 |
| 60496 | AASDHPPT | P2T-E | Human | Esophagus | ESCC | 2.61e-32 | 6.15e-01 | 0.1177 |
| 60496 | AASDHPPT | P4T-E | Human | Esophagus | ESCC | 2.16e-65 | 1.38e+00 | 0.1323 |
| 60496 | AASDHPPT | P5T-E | Human | Esophagus | ESCC | 1.75e-53 | 1.06e+00 | 0.1327 |
| 60496 | AASDHPPT | P8T-E | Human | Esophagus | ESCC | 7.54e-21 | 2.63e-01 | 0.0889 |
| 60496 | AASDHPPT | P9T-E | Human | Esophagus | ESCC | 6.26e-22 | 5.49e-01 | 0.1131 |
| 60496 | AASDHPPT | P10T-E | Human | Esophagus | ESCC | 1.35e-40 | 6.83e-01 | 0.116 |
| 60496 | AASDHPPT | P11T-E | Human | Esophagus | ESCC | 2.02e-31 | 9.64e-01 | 0.1426 |
| 60496 | AASDHPPT | P12T-E | Human | Esophagus | ESCC | 1.73e-50 | 9.92e-01 | 0.1122 |
| 60496 | AASDHPPT | P15T-E | Human | Esophagus | ESCC | 4.03e-22 | 3.75e-01 | 0.1149 |
| 60496 | AASDHPPT | P16T-E | Human | Esophagus | ESCC | 2.32e-51 | 8.77e-01 | 0.1153 |
| Page: 1 2 3 4 5 6 |
| Tissue | Expression Dynamics | Abbreviation |
| Esophagus | 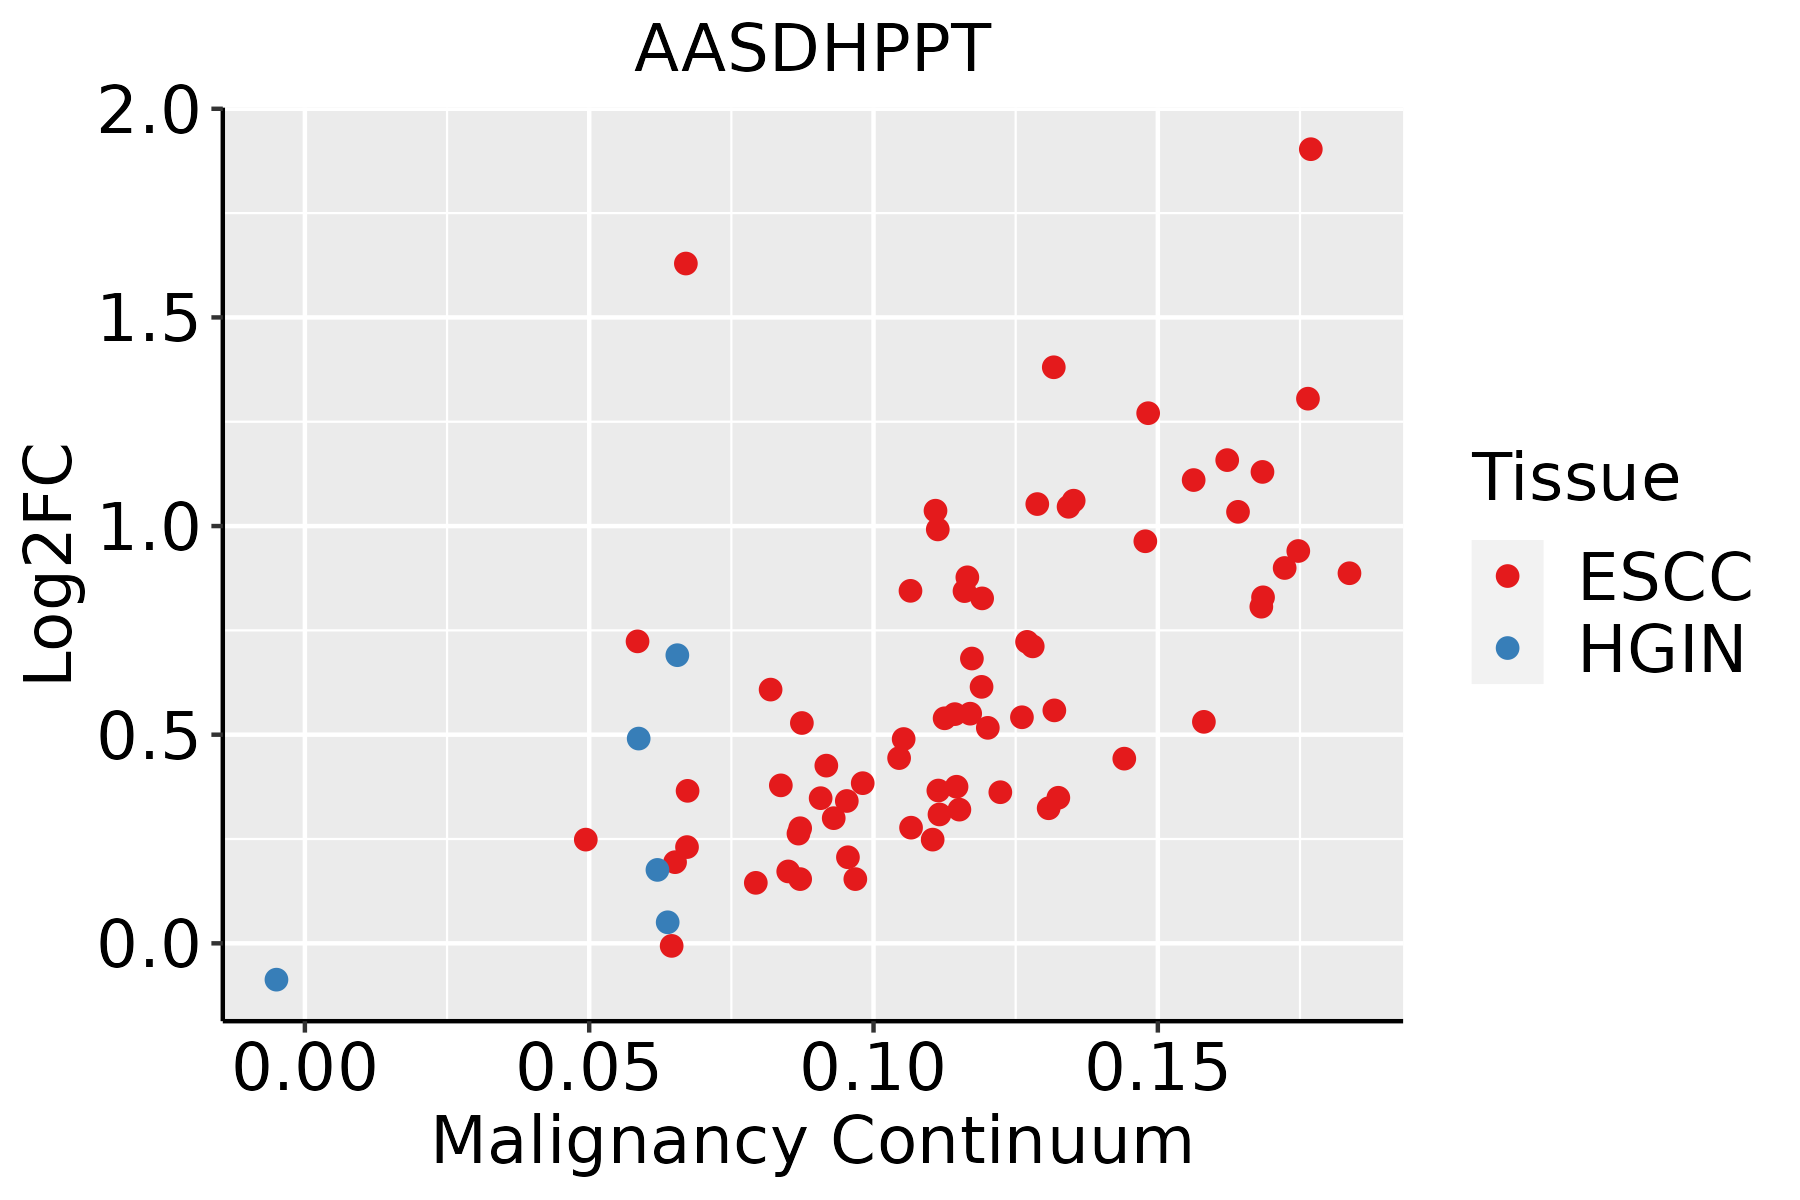 | ESCC: Esophageal squamous cell carcinoma |
| HGIN: High-grade intraepithelial neoplasias | ||
| LGIN: Low-grade intraepithelial neoplasias | ||
| Liver | 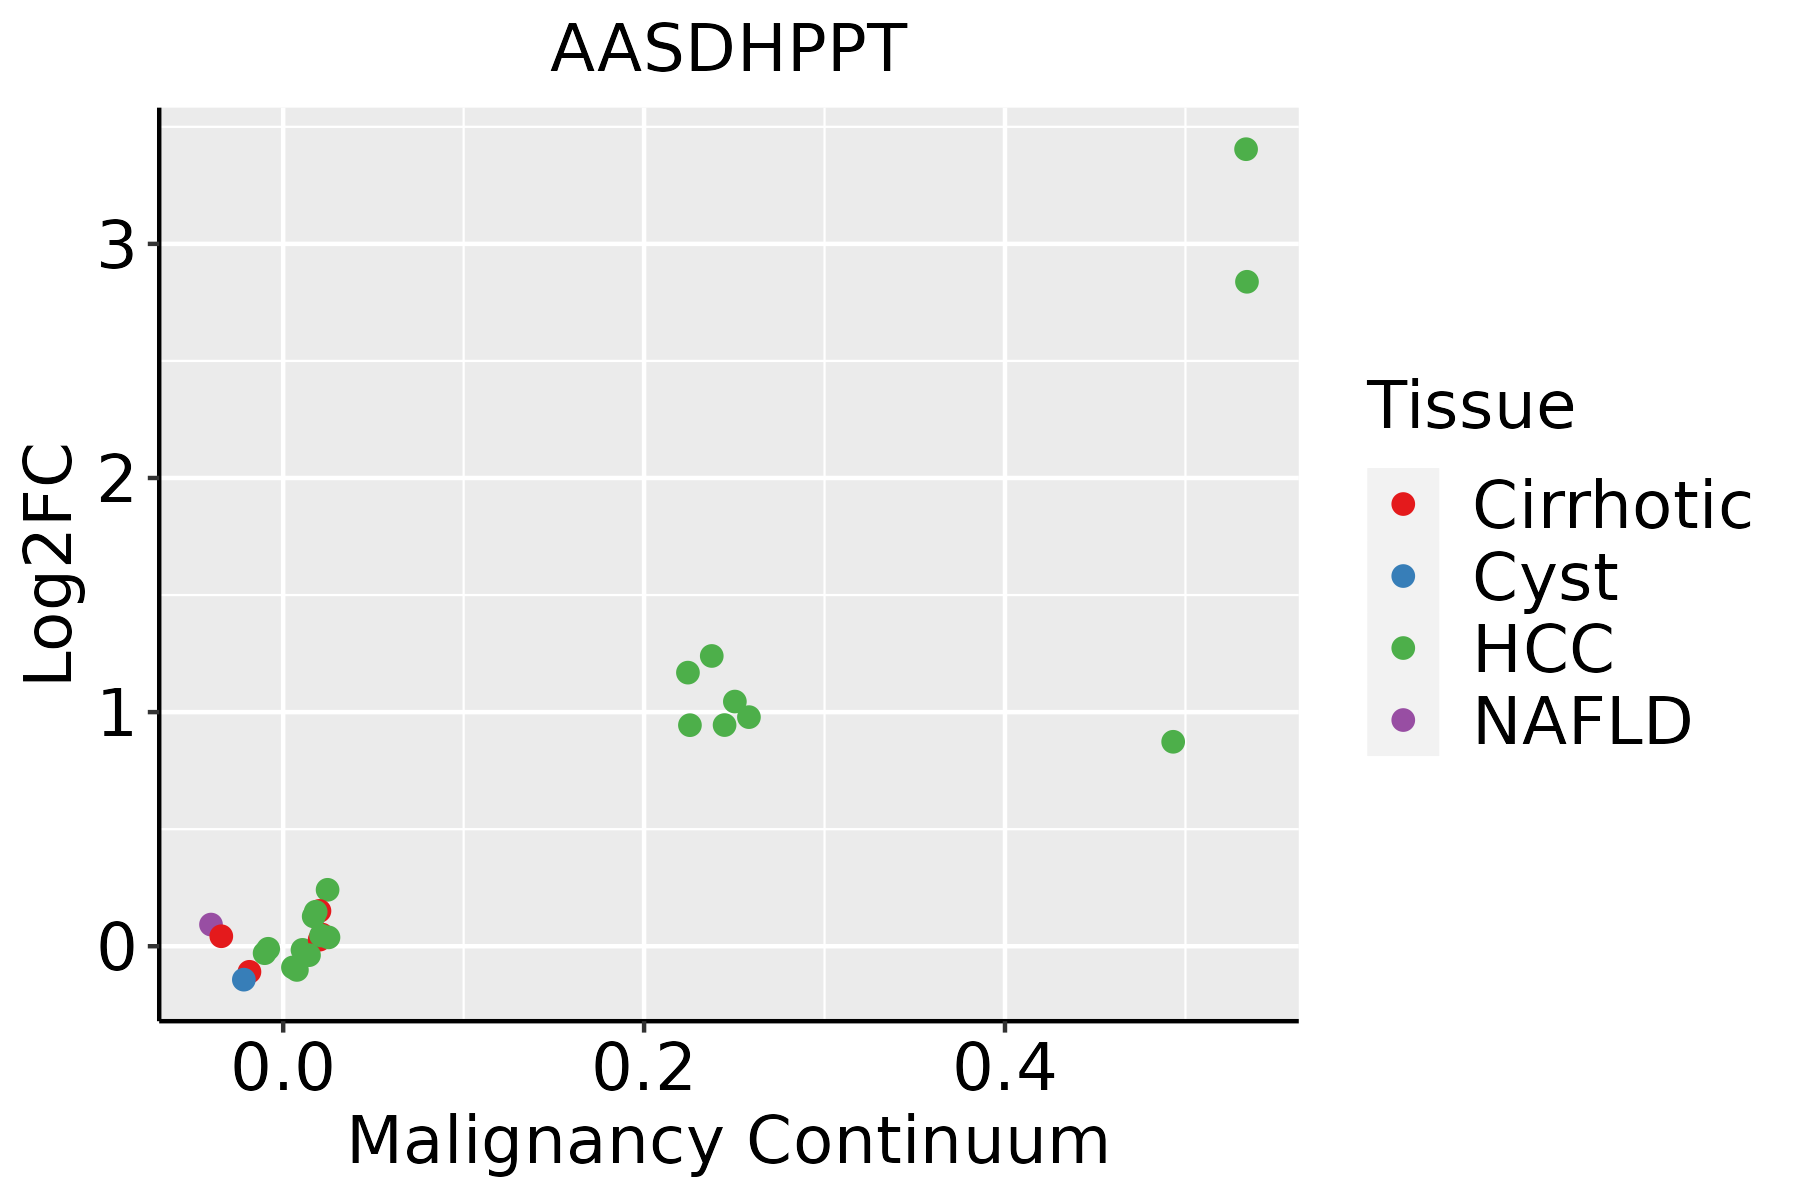 | HCC: Hepatocellular carcinoma |
| NAFLD: Non-alcoholic fatty liver disease | ||
| Oral Cavity |  | EOLP: Erosive Oral lichen planus |
| LP: leukoplakia | ||
| NEOLP: Non-erosive oral lichen planus | ||
| OSCC: Oral squamous cell carcinoma | ||
| Skin | 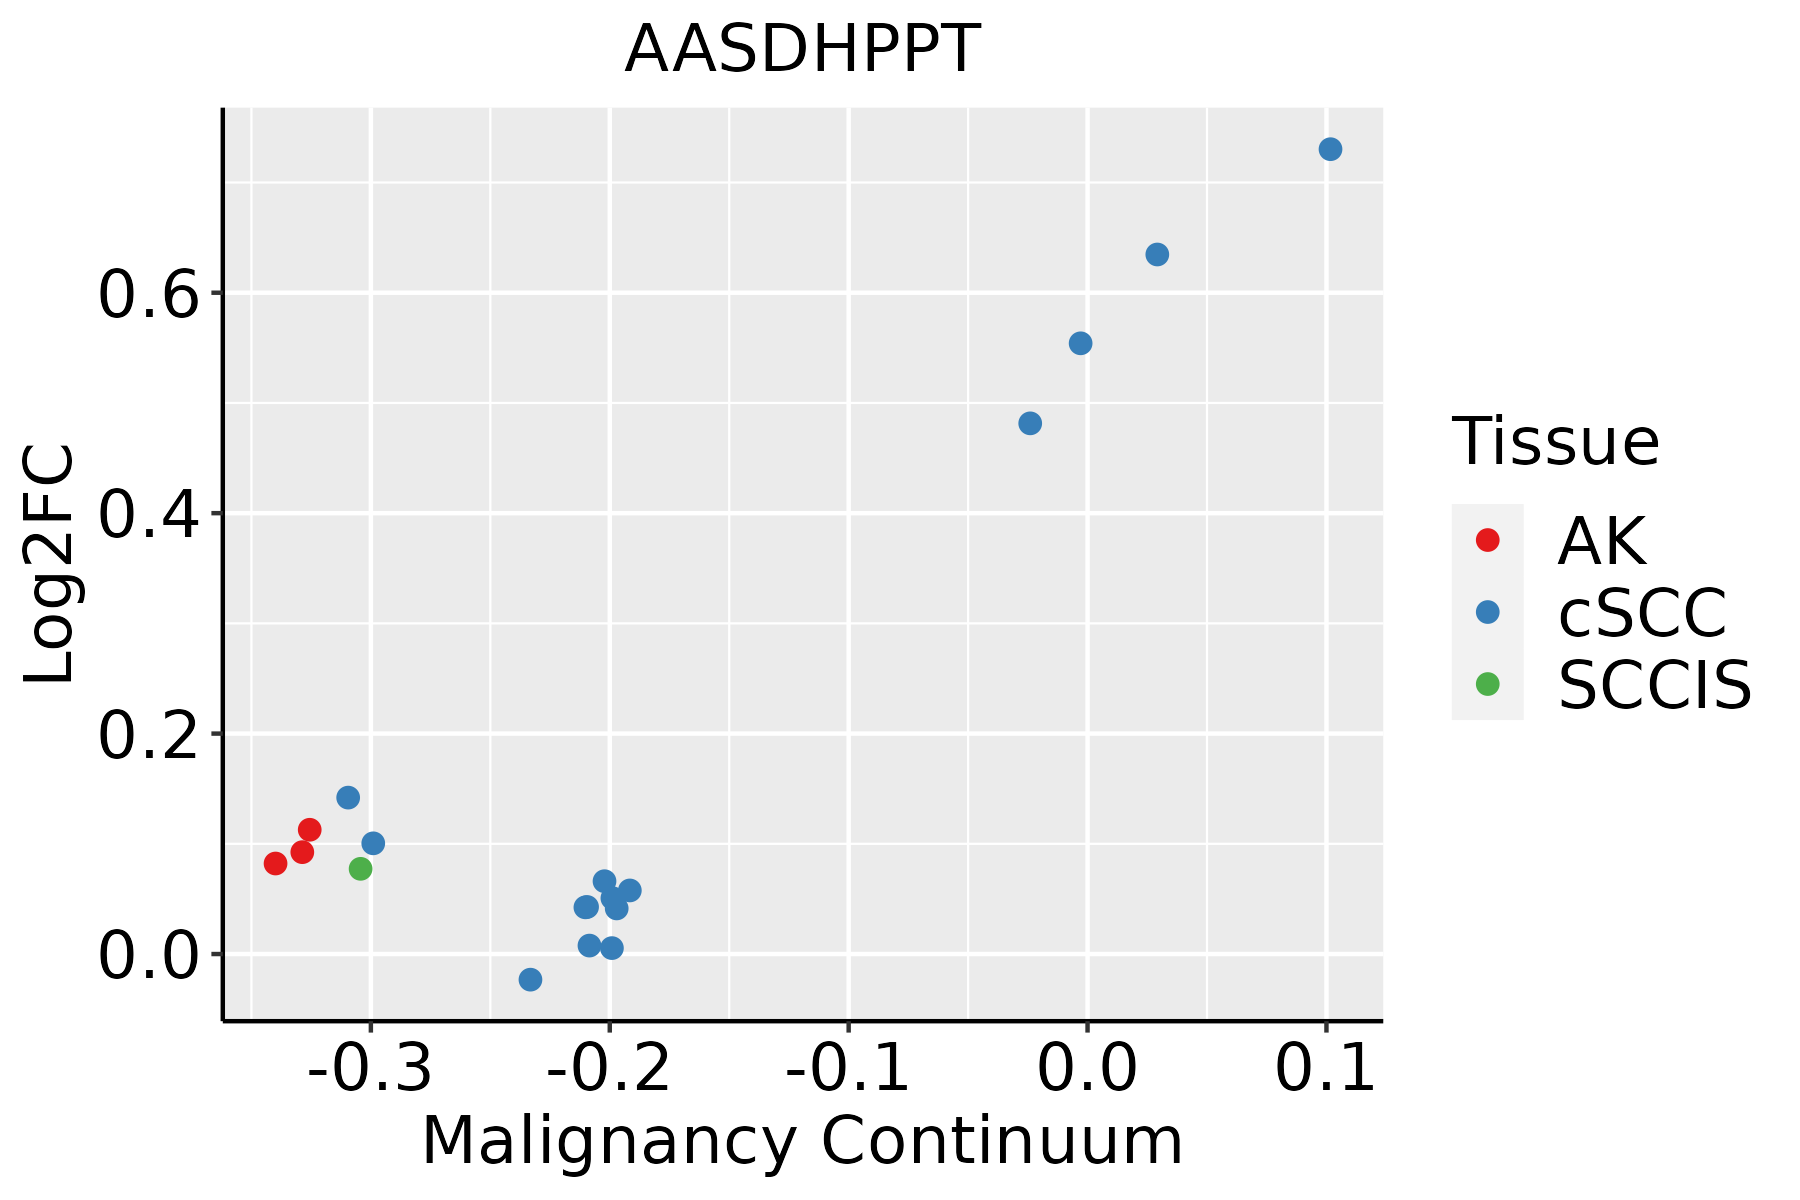 | AK: Actinic keratosis |
| cSCC: Cutaneous squamous cell carcinoma | ||
| SCCIS:squamous cell carcinoma in situ | ||
| Thyroid |  | ATC: Anaplastic thyroid cancer |
| HT: Hashimoto's thyroiditis | ||
| PTC: Papillary thyroid cancer |
| ∗log2FC in expression of this searched gene in stem-like cells from each diseased tissue sample relative to stem-like cells in normal samples in each tissue plotted against the malignancy continuum. Samples are colored based on if they are from different disease stage. |
Top |
Malignant transformation related pathway analysis |
| Find out the enriched GO biological processes and KEGG pathways involved in transition from healthy to precancer to cancer |
| Tissue | Disease Stage | Enriched GO biological Processes |
| Colorectum | AD |  |
| Colorectum | SER |  |
| Colorectum | MSS |  |
| Colorectum | MSI-H |  |
| Colorectum | FAP |  |
| ∗Top 15 enriched GO BP terms are showed in the bar plot of each disease state in each tissue. Each row represents a significant GO biological process which is colored according to the -log10(p.adjust). |
| Page: 1 2 3 4 5 6 7 8 9 |
| GO ID | Tissue | Disease Stage | Description | Gene Ratio | Bg Ratio | pvalue | p.adjust | Count |
| GO:00065757 | Esophagus | ESCC | cellular modified amino acid metabolic process | 112/8552 | 188/18723 | 8.31e-05 | 6.06e-04 | 112 |
| GO:00086525 | Esophagus | ESCC | cellular amino acid biosynthetic process | 51/8552 | 76/18723 | 1.30e-04 | 8.88e-04 | 51 |
| GO:00067671 | Esophagus | ESCC | water-soluble vitamin metabolic process | 41/8552 | 59/18723 | 1.84e-04 | 1.17e-03 | 41 |
| GO:00463948 | Esophagus | ESCC | carboxylic acid biosynthetic process | 175/8552 | 314/18723 | 1.98e-04 | 1.26e-03 | 175 |
| GO:00067661 | Esophagus | ESCC | vitamin metabolic process | 67/8552 | 106/18723 | 2.03e-04 | 1.28e-03 | 67 |
| GO:00160538 | Esophagus | ESCC | organic acid biosynthetic process | 175/8552 | 316/18723 | 3.04e-04 | 1.82e-03 | 175 |
| GO:19016075 | Esophagus | ESCC | alpha-amino acid biosynthetic process | 45/8552 | 68/18723 | 5.13e-04 | 2.84e-03 | 45 |
| GO:00090674 | Esophagus | ESCC | aspartate family amino acid biosynthetic process | 17/8552 | 21/18723 | 1.03e-03 | 5.19e-03 | 17 |
| GO:001605312 | Liver | Cirrhotic | organic acid biosynthetic process | 139/4634 | 316/18723 | 4.28e-14 | 3.83e-12 | 139 |
| GO:004639412 | Liver | Cirrhotic | carboxylic acid biosynthetic process | 137/4634 | 314/18723 | 1.40e-13 | 1.14e-11 | 137 |
| GO:19016051 | Liver | Cirrhotic | alpha-amino acid metabolic process | 82/4634 | 195/18723 | 7.72e-08 | 2.30e-06 | 82 |
| GO:000652011 | Liver | Cirrhotic | cellular amino acid metabolic process | 103/4634 | 284/18723 | 8.88e-06 | 1.30e-04 | 103 |
| GO:00086521 | Liver | Cirrhotic | cellular amino acid biosynthetic process | 36/4634 | 76/18723 | 1.55e-05 | 2.11e-04 | 36 |
| GO:19016071 | Liver | Cirrhotic | alpha-amino acid biosynthetic process | 33/4634 | 68/18723 | 1.84e-05 | 2.49e-04 | 33 |
| GO:000657511 | Liver | Cirrhotic | cellular modified amino acid metabolic process | 70/4634 | 188/18723 | 9.04e-05 | 9.69e-04 | 70 |
| GO:00090661 | Liver | Cirrhotic | aspartate family amino acid metabolic process | 21/4634 | 49/18723 | 4.13e-03 | 2.21e-02 | 21 |
| GO:00090671 | Liver | Cirrhotic | aspartate family amino acid biosynthetic process | 11/4634 | 21/18723 | 5.89e-03 | 2.95e-02 | 11 |
| GO:001605321 | Liver | HCC | organic acid biosynthetic process | 200/7958 | 316/18723 | 5.24e-14 | 3.22e-12 | 200 |
| GO:004639421 | Liver | HCC | carboxylic acid biosynthetic process | 198/7958 | 314/18723 | 1.19e-13 | 6.78e-12 | 198 |
| GO:00086522 | Liver | HCC | cellular amino acid biosynthetic process | 58/7958 | 76/18723 | 1.98e-09 | 5.63e-08 | 58 |
| Page: 1 2 3 |
| Pathway ID | Tissue | Disease Stage | Description | Gene Ratio | Bg Ratio | pvalue | p.adjust | qvalue | Count |
| hsa00770 | Liver | Cirrhotic | Pantothenate and CoA biosynthesis | 13/2530 | 21/8465 | 2.32e-03 | 9.90e-03 | 6.10e-03 | 13 |
| hsa007701 | Liver | Cirrhotic | Pantothenate and CoA biosynthesis | 13/2530 | 21/8465 | 2.32e-03 | 9.90e-03 | 6.10e-03 | 13 |
| Page: 1 |
Top |
Cell-cell communication analysis |
| Identification of potential cell-cell interactions between two cell types and their ligand-receptor pairs for different disease states |
| Ligand | Receptor | LRpair | Pathway | Tissue | Disease Stage |
| Page: 1 |
Top |
Single-cell gene regulatory network inference analysis |
| Find out the significant the regulons (TFs) and the target genes of each regulon across cell types for different disease states |
| TF | Cell Type | Tissue | Disease Stage | Target Gene | RSS | Regulon Activity |
| ∗The dot plots of a searched regulon are shown for all cell subpopulations in each disease state of each tissue based on the regulon specific score inferred using pySCENIC and by calculating the average expression. |
| Page: 1 |
Top |
Somatic mutation of malignant transformation related genes |
| Annotation of somatic variants for genes involved in malignant transformation |
| Hugo Symbol | Variant Class | Variant Classification | dbSNP RS | HGVSc | HGVSp | HGVSp Short | SWISSPROT | BIOTYPE | SIFT | PolyPhen | Tumor Sample Barcode | Tissue | Histology | Sex | Age | Stage | Therapy Types | Drugs | Outcome |
| AASDHPPT | SNV | Missense_Mutation | c.27N>G | p.Cys9Trp | p.C9W | Q9NRN7 | protein_coding | deleterious_low_confidence(0.01) | benign(0) | TCGA-AR-A1AQ-01 | Breast | breast invasive carcinoma | Female | <65 | I/II | Chemotherapy | doxorubicin | SD | |
| AASDHPPT | SNV | Missense_Mutation | c.604N>G | p.Leu202Val | p.L202V | Q9NRN7 | protein_coding | tolerated(1) | benign(0) | TCGA-BH-A0B0-01 | Breast | breast invasive carcinoma | Female | <65 | I/II | Chemotherapy | adriamycin | CR | |
| AASDHPPT | SNV | Missense_Mutation | novel | c.94G>A | p.Glu32Lys | p.E32K | Q9NRN7 | protein_coding | deleterious(0.01) | benign(0.328) | TCGA-C8-A3M7-01 | Breast | breast invasive carcinoma | Female | <65 | III/IV | Unknown | Unknown | PD |
| AASDHPPT | SNV | Missense_Mutation | c.622N>C | p.Asp208His | p.D208H | Q9NRN7 | protein_coding | deleterious(0.04) | benign(0.005) | TCGA-E9-A22E-01 | Breast | breast invasive carcinoma | Female | <65 | III/IV | Chemotherapy | cyclophosphane | SD | |
| AASDHPPT | deletion | Frame_Shift_Del | novel | c.208delN | p.Leu70Ter | p.L70* | Q9NRN7 | protein_coding | TCGA-D8-A27V-01 | Breast | breast invasive carcinoma | Female | <65 | I/II | Hormone Therapy | tamoxiphen | SD | ||
| AASDHPPT | deletion | Frame_Shift_Del | novel | c.11_23delNNNNNNNNNNNNN | p.Lys6TrpfsTer56 | p.K6Wfs*56 | Q9NRN7 | protein_coding | TCGA-E9-A5FL-01 | Breast | breast invasive carcinoma | Female | >=65 | I/II | Unknown | Unknown | SD | ||
| AASDHPPT | SNV | Missense_Mutation | rs761620246 | c.911N>A | p.Arg304Gln | p.R304Q | Q9NRN7 | protein_coding | deleterious_low_confidence(0.03) | possibly_damaging(0.676) | TCGA-2W-A8YY-01 | Cervix | cervical & endocervical cancer | Female | <65 | I/II | Chemotherapy | cisplatin | CR |
| AASDHPPT | SNV | Missense_Mutation | novel | c.94N>A | p.Glu32Lys | p.E32K | Q9NRN7 | protein_coding | deleterious(0.01) | benign(0.328) | TCGA-VS-A9UZ-01 | Cervix | cervical & endocervical cancer | Female | <65 | I/II | Unknown | Unknown | SD |
| AASDHPPT | SNV | Missense_Mutation | c.412C>T | p.Arg138Cys | p.R138C | Q9NRN7 | protein_coding | tolerated(0.05) | possibly_damaging(0.85) | TCGA-AA-3680-01 | Colorectum | colon adenocarcinoma | Female | >=65 | III/IV | Chemotherapy | folinic | PD | |
| AASDHPPT | SNV | Missense_Mutation | c.878N>T | p.Asp293Val | p.D293V | Q9NRN7 | protein_coding | deleterious(0.04) | benign(0.067) | TCGA-AA-3821-01 | Colorectum | colon adenocarcinoma | Female | >=65 | I/II | Unknown | Unknown | SD |
| Page: 1 2 3 4 5 |
Top |
Related drugs of malignant transformation related genes |
| Identification of chemicals and drugs interact with genes involved in malignant transfromation |
| (DGIdb 4.0) |
| Entrez ID | Symbol | Category | Interaction Types | Drug Claim Name | Drug Name | PMIDs |
| Page: 1 |

Copyright 2023-Present -The University of Texas Health Science Center at Houston |