Schematic overview of the cellular and molecular mechanisms involved in the cancer progression, including the proposed cellular and molecular mechanisms in cancer cells trajectory. AT1: alveolar type 1 cells; AT2: alveolar type 2 cells; AAH: atypical adenomatous hyperplasia; AIS: adenocarcinoma in situ; MIA: minimally invasive adenocarcinoma; IA: invasive adenocarcinoma; EMT: epithelial-mesenchymal transition

Home

Download

Statistics

Help

Contact

Center for Computational Systems Medicine
leaf

Gene summary

leaf

Malignant transformation analysis

leaf

Malignant transformation related pathway analysis

leaf

Cell-cell communication analysis

leaf

Single-cell gene regulatory network inference analysis

leaf

Somatic mutation of malignant transformation related genes

leaf

Related drugs of malignant transformation related genes

Gene: AARS

Gene summary for AARS

check button Gene summary.

Gene informationSpeciesHuman
Gene symbol

AARS

Gene ID

16

Gene namealanyl-tRNA synthetase 1
Gene AliasAARS
Cytomap16q22.1
Gene Typeprotein-coding
GO ID

GO:0002181

UniProtAcc

P49588


Top

Malignant transformation analysis

check button Identification of the aberrant gene expression in precancerous and cancerous lesions by comparing the gene expression of stem-like cells in diseased tissues with normal stem cells
check button Malignant transformation involving gene list.
Entrez IDSymbolReplicatesSpeciesOrganTissueAdj P-valueLog2FCMalignancy
16AARSLZE4THumanEsophagusESCC1.03e-176.33e-010.0811
16AARSLZE7THumanEsophagusESCC2.06e-085.65e-010.0667
16AARSLZE8THumanEsophagusESCC1.58e-072.42e-010.067
16AARSLZE20THumanEsophagusESCC5.94e-053.26e-010.0662
16AARSLZE24D1HumanEsophagusHGIN1.52e-026.23e-010.054
16AARSLZE24THumanEsophagusESCC3.08e-226.92e-010.0596
16AARSLZE21THumanEsophagusESCC2.53e-127.04e-010.0655
16AARSP1T-EHumanEsophagusESCC6.22e-105.30e-010.0875
16AARSP2T-EHumanEsophagusESCC3.99e-234.05e-010.1177
16AARSP4T-EHumanEsophagusESCC2.62e-317.22e-010.1323
16AARSP5T-EHumanEsophagusESCC3.57e-234.20e-010.1327
16AARSP8T-EHumanEsophagusESCC8.03e-183.37e-010.0889
16AARSP9T-EHumanEsophagusESCC8.46e-101.34e-010.1131
16AARSP10T-EHumanEsophagusESCC3.52e-234.87e-010.116
16AARSP11T-EHumanEsophagusESCC1.59e-167.53e-010.1426
16AARSP12T-EHumanEsophagusESCC5.89e-346.49e-010.1122
16AARSP15T-EHumanEsophagusESCC1.09e-235.58e-010.1149
16AARSP16T-EHumanEsophagusESCC2.53e-254.81e-010.1153
16AARSP17T-EHumanEsophagusESCC4.15e-114.93e-010.1278
16AARSP19T-EHumanEsophagusESCC2.17e-171.04e+000.1662
Page: 1 2 3 4 5 6 

check button Transcriptomic changes along malignancy continuum.
TissueExpression DynamicsAbbreviation
EsophagusThe image shows the transcriptomic changes along malignancy continuum.log2FC in expression of this searched gene in stem-like cells from each diseased tissue sample relative to stem-like cells in normal samples in each tissue plotted against the malignancy continuum. Samples are colored based on if they are from different disease stage.
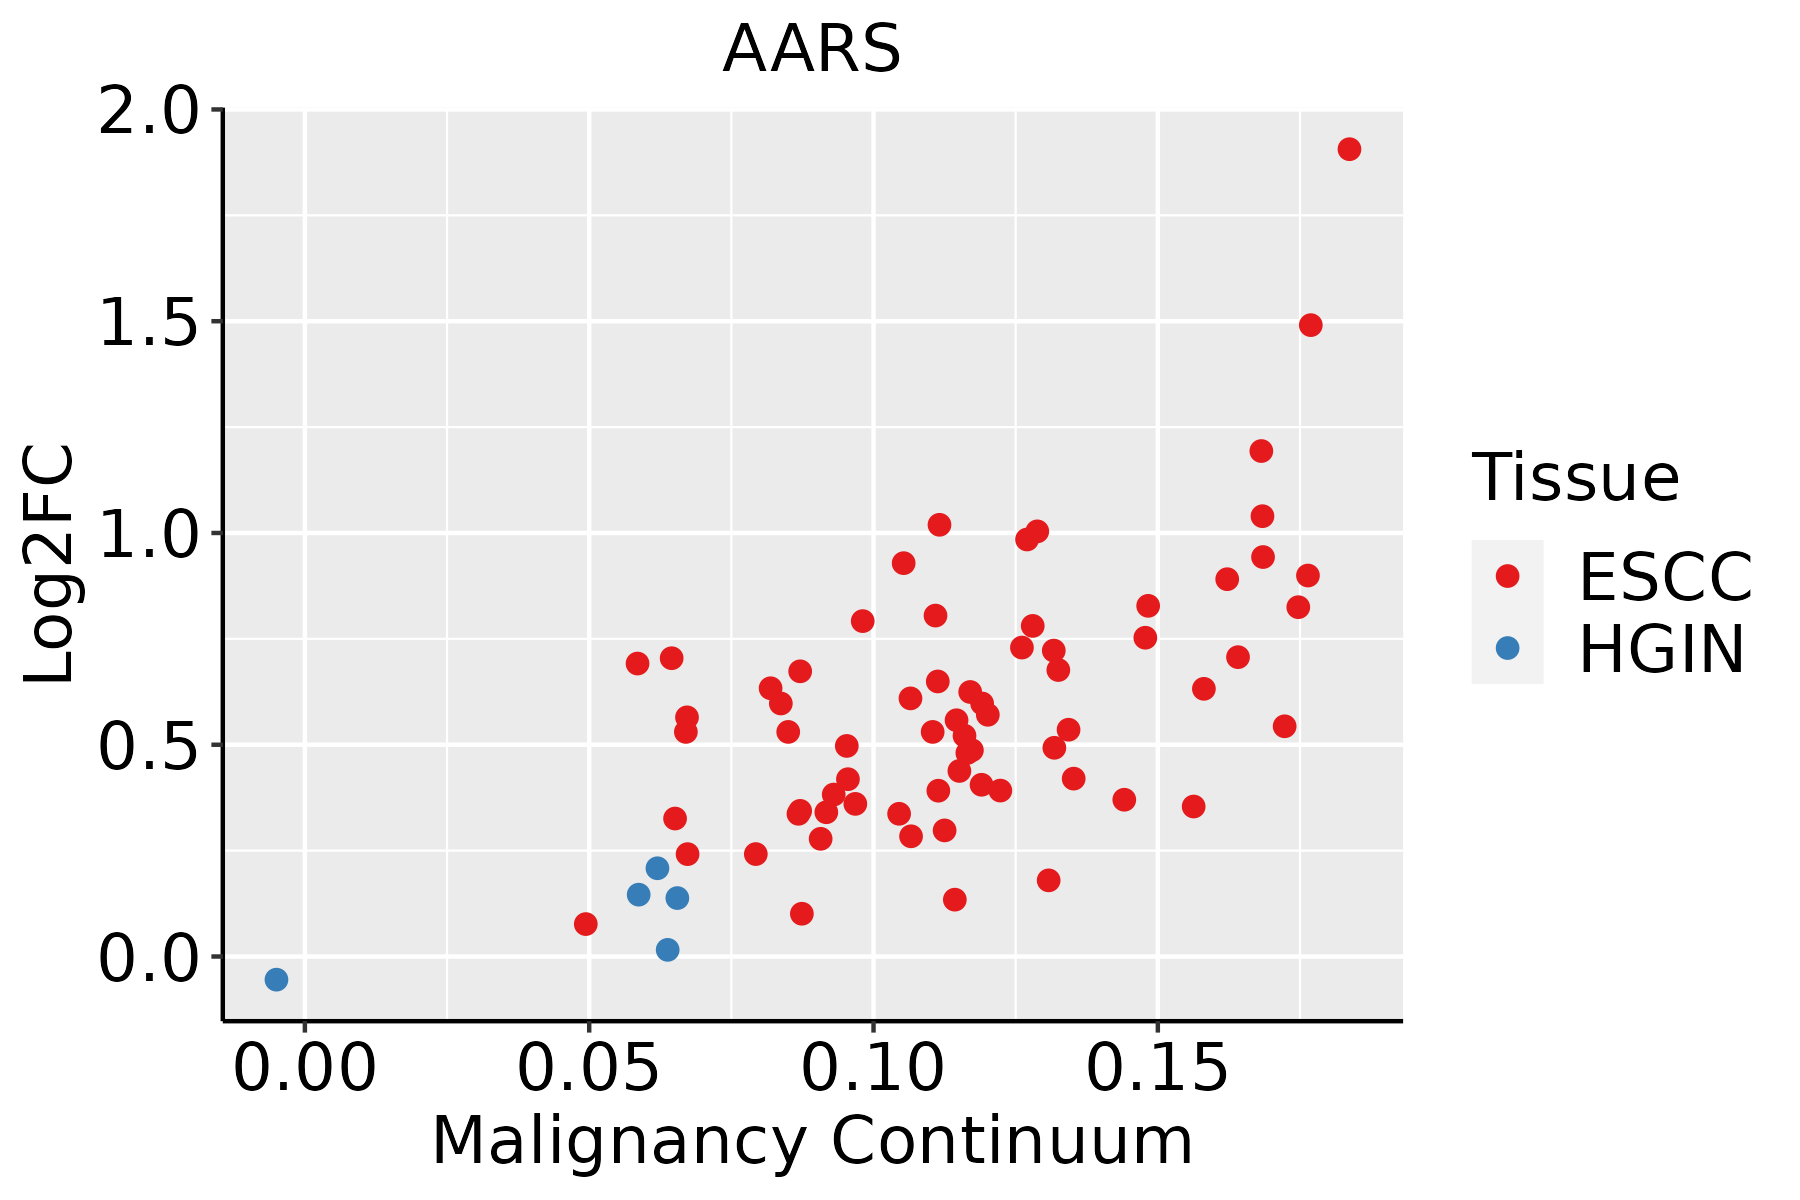
ESCC: Esophageal squamous cell carcinoma
HGIN: High-grade intraepithelial neoplasias
LGIN: Low-grade intraepithelial neoplasias
LiverThe image shows the transcriptomic changes along malignancy continuum.log2FC in expression of this searched gene in stem-like cells from each diseased tissue sample relative to stem-like cells in normal samples in each tissue plotted against the malignancy continuum. Samples are colored based on if they are from different disease stage.
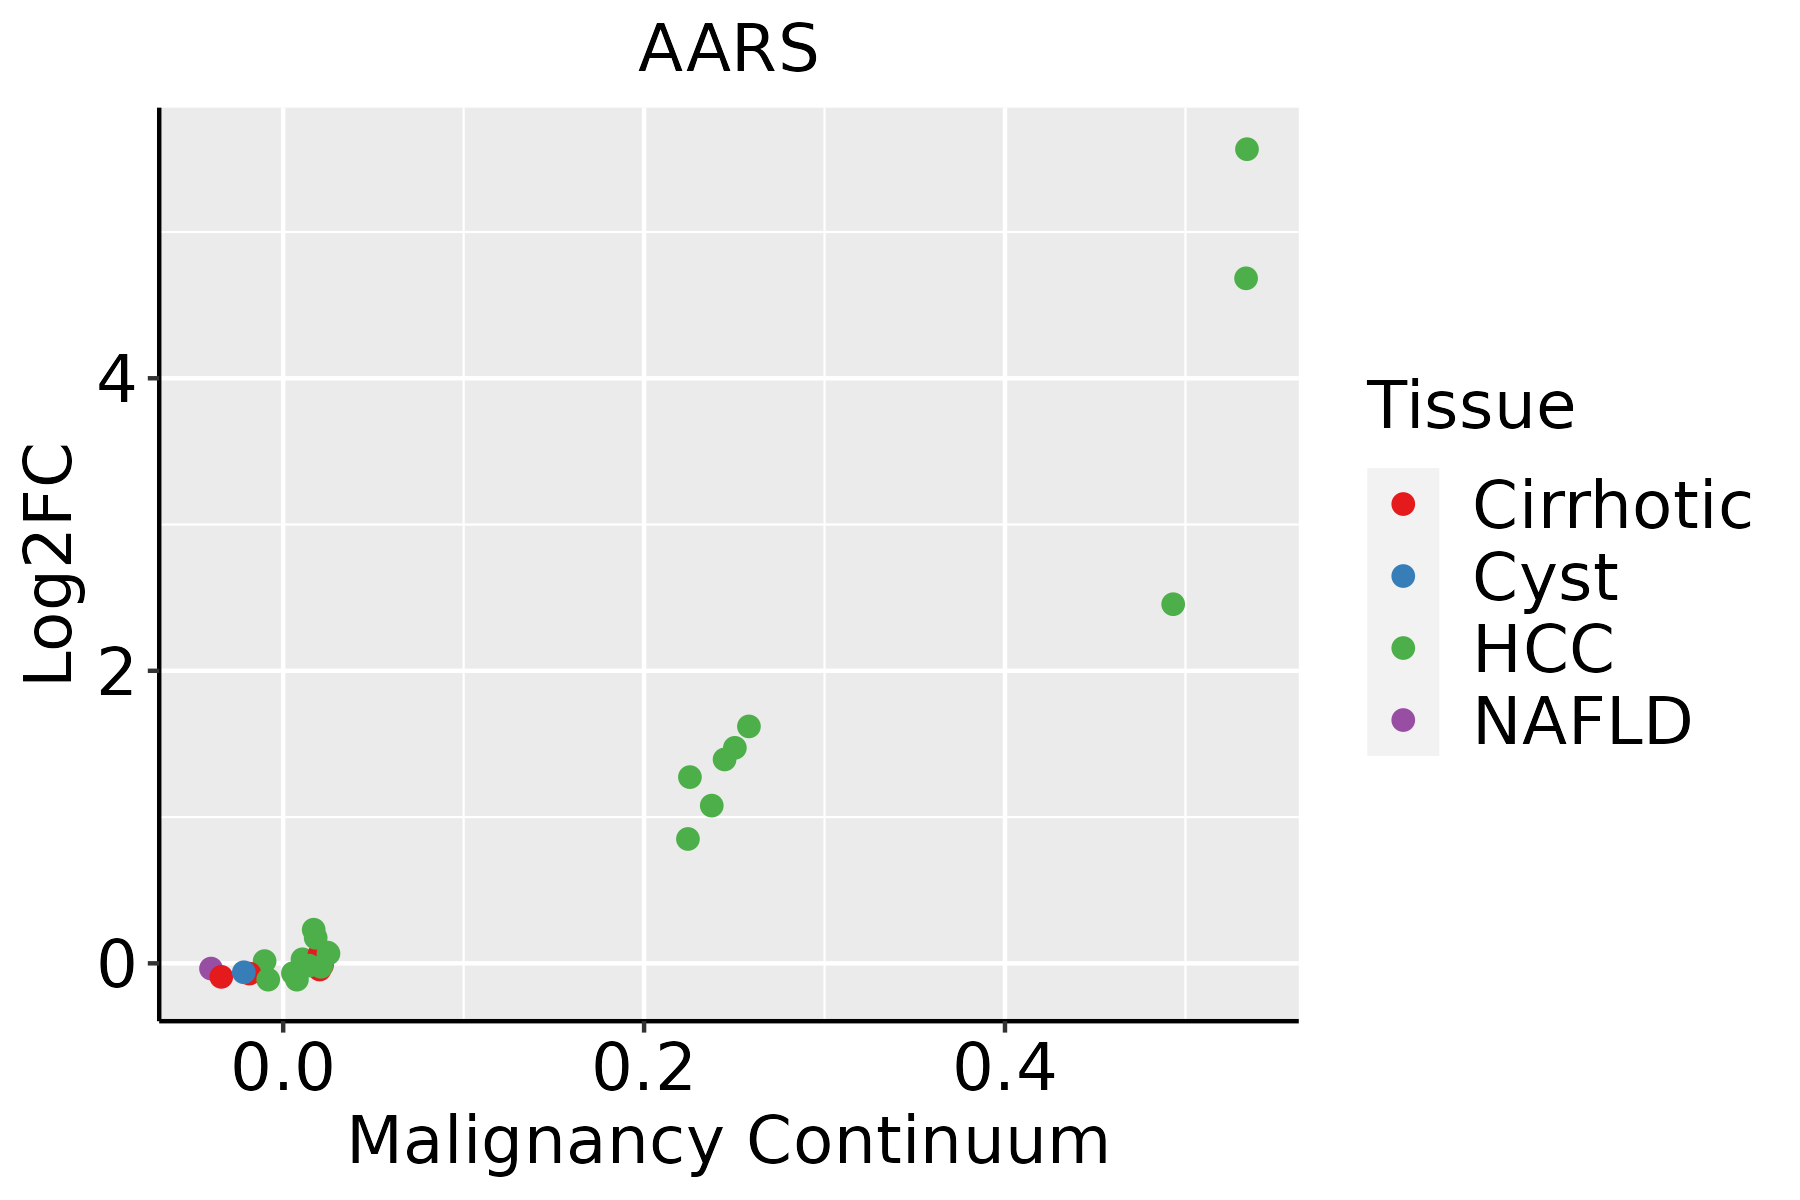
HCC: Hepatocellular carcinoma
NAFLD: Non-alcoholic fatty liver disease
Oral CavityThe image shows the transcriptomic changes along malignancy continuum.log2FC in expression of this searched gene in stem-like cells from each diseased tissue sample relative to stem-like cells in normal samples in each tissue plotted against the malignancy continuum. Samples are colored based on if they are from different disease stage.
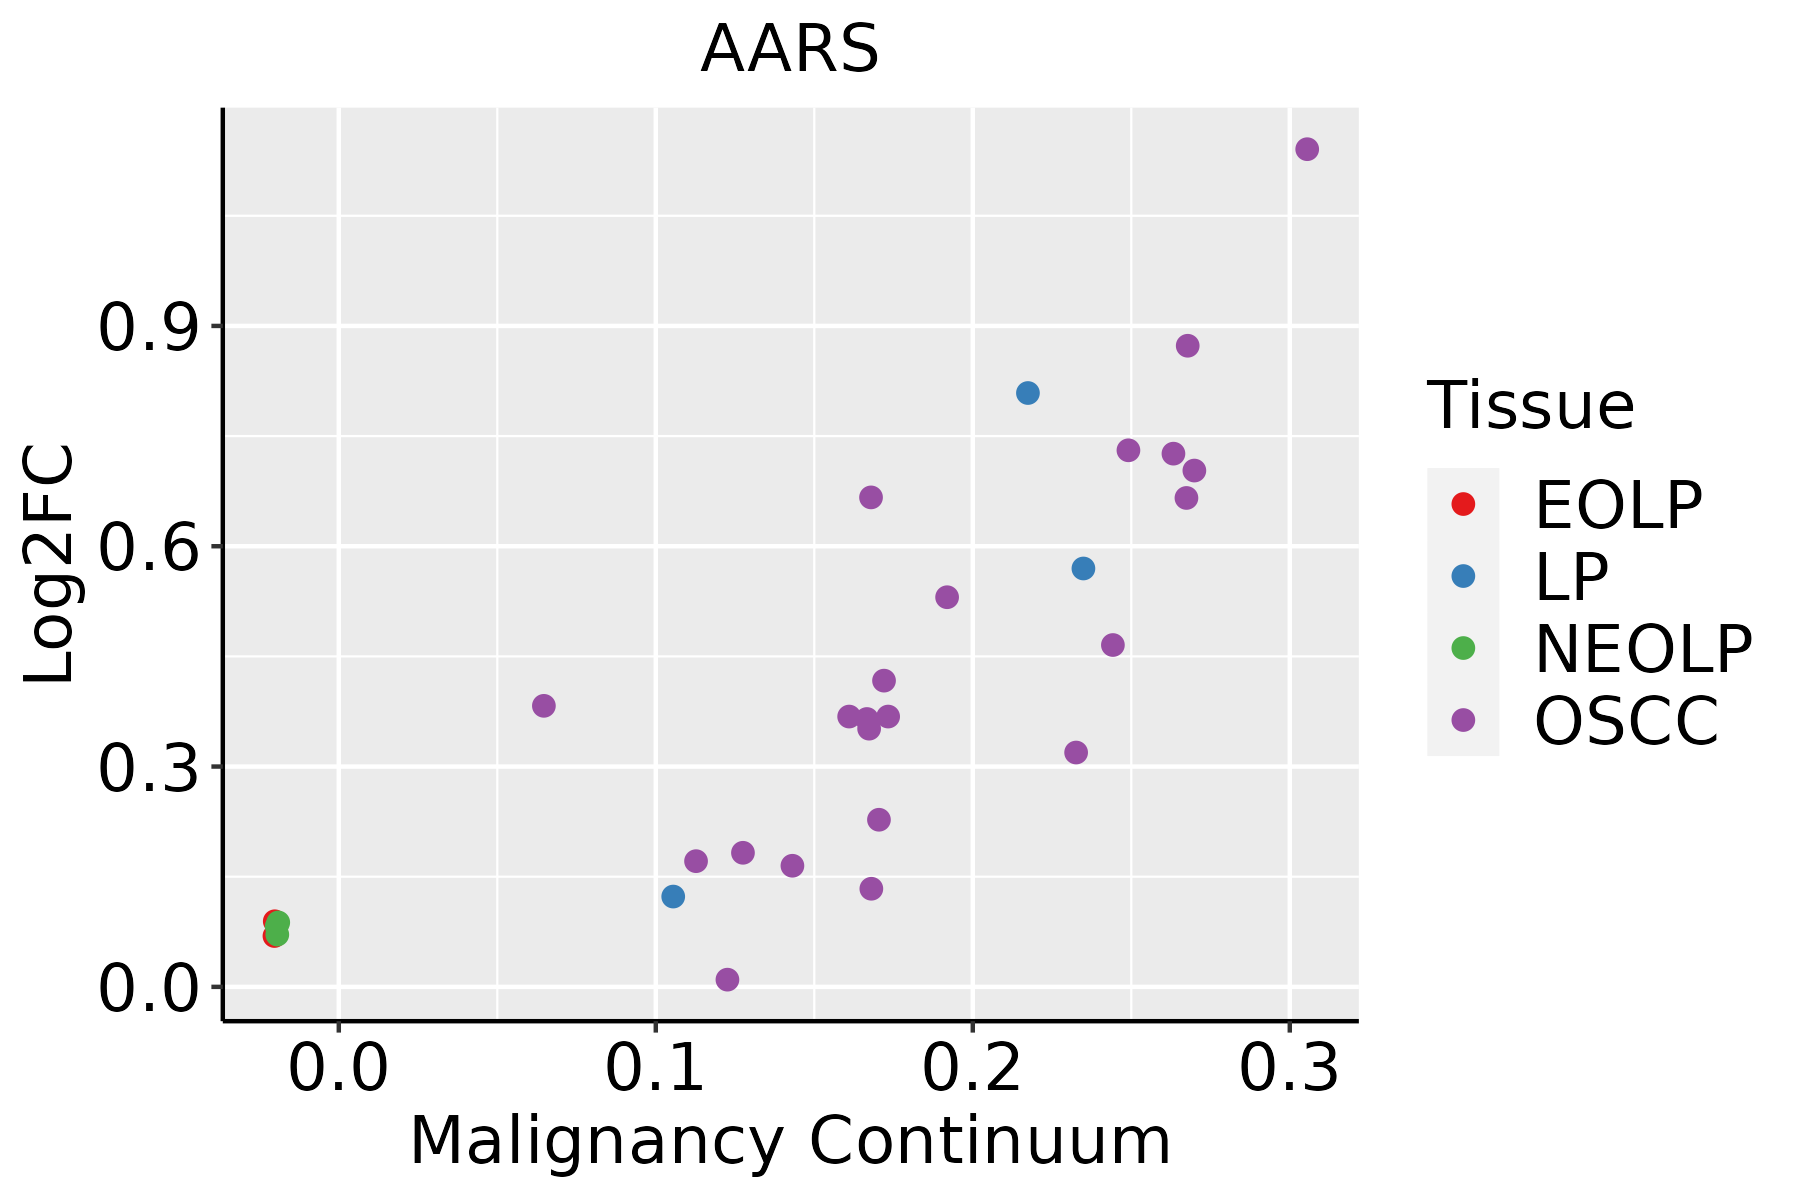
EOLP: Erosive Oral lichen planus
LP: leukoplakia
NEOLP: Non-erosive oral lichen planus
OSCC: Oral squamous cell carcinoma
SkinThe image shows the transcriptomic changes along malignancy continuum.log2FC in expression of this searched gene in stem-like cells from each diseased tissue sample relative to stem-like cells in normal samples in each tissue plotted against the malignancy continuum. Samples are colored based on if they are from different disease stage.AK: Actinic keratosis
cSCC: Cutaneous squamous cell carcinoma
SCCIS:squamous cell carcinoma in situ
ThyroidThe image shows the transcriptomic changes along malignancy continuum.log2FC in expression of this searched gene in stem-like cells from each diseased tissue sample relative to stem-like cells in normal samples in each tissue plotted against the malignancy continuum. Samples are colored based on if they are from different disease stage.
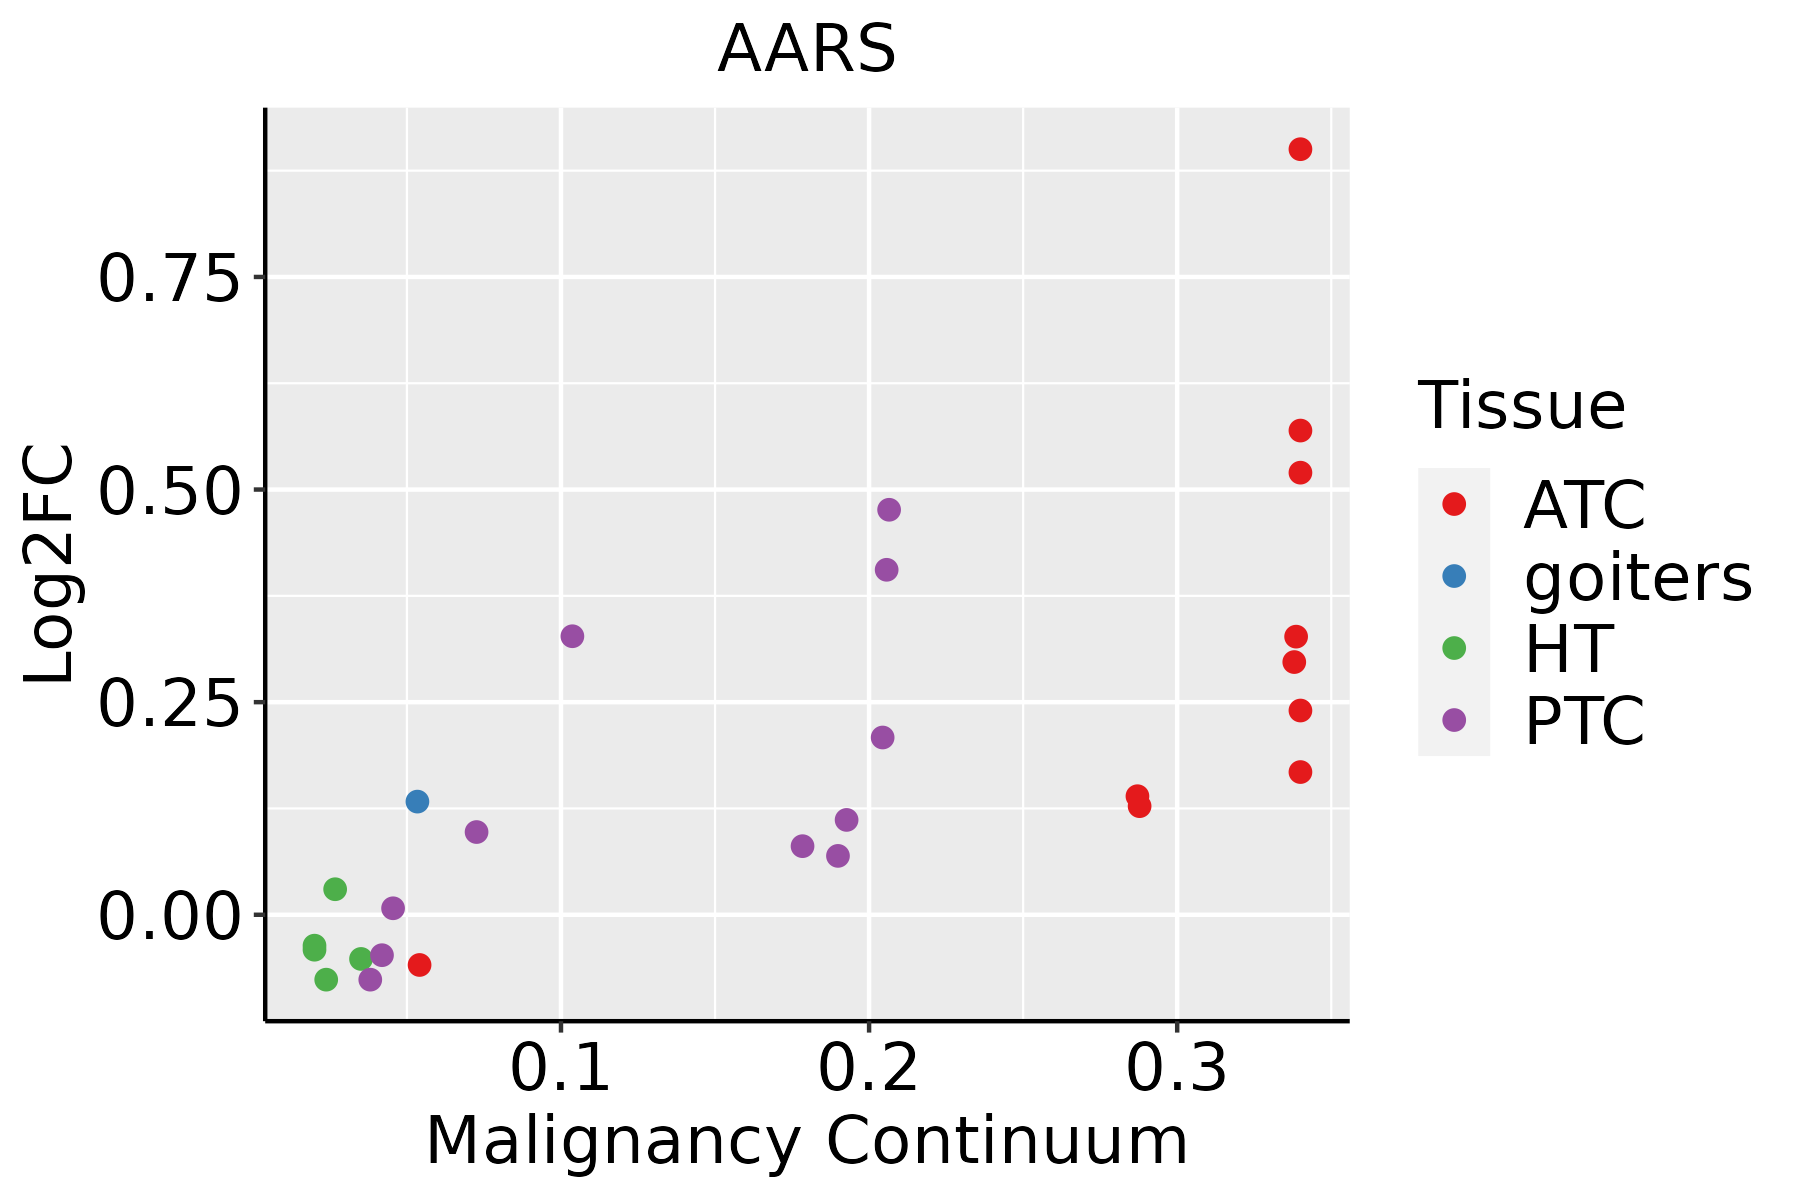
ATC: Anaplastic thyroid cancer
HT: Hashimoto's thyroiditis
PTC: Papillary thyroid cancer
∗log2FC in expression of this searched gene in stem-like cells from each diseased tissue sample relative to stem-like cells in normal samples in each tissue plotted against the malignancy continuum. Samples are colored based on if they are from different disease stage.

Top

Malignant transformation related pathway analysis

check buttonFind out the enriched GO biological processes and KEGG pathways involved in transition from healthy to precancer to cancer
check button Figure of enriched GO biological processes.
TissueDisease StageEnriched GO biological Processes
ColorectumADGO analysis - Figure of enriched GO biological processes: Top 15 enriched GO BP terms are showed in the bar plot of each disease state in each tissue. Each row represents a significant GO biological process which is colored according to the -log10(p.adjust).
ColorectumSERGO analysis - Figure of enriched GO biological processes: Top 15 enriched GO BP terms are showed in the bar plot of each disease state in each tissue. Each row represents a significant GO biological process which is colored according to the -log10(p.adjust).
ColorectumMSSGO analysis - Figure of enriched GO biological processes: Top 15 enriched GO BP terms are showed in the bar plot of each disease state in each tissue. Each row represents a significant GO biological process which is colored according to the -log10(p.adjust).
ColorectumMSI-HGO analysis - Figure of enriched GO biological processes: Top 15 enriched GO BP terms are showed in the bar plot of each disease state in each tissue. Each row represents a significant GO biological process which is colored according to the -log10(p.adjust).
ColorectumFAPGO analysis - Figure of enriched GO biological processes: Top 15 enriched GO BP terms are showed in the bar plot of each disease state in each tissue. Each row represents a significant GO biological process which is colored according to the -log10(p.adjust).
∗Top 15 enriched GO BP terms are showed in the bar plot of each disease state in each tissue. Each row represents a significant GO biological process which is colored according to the -log10(p.adjust).
Page: 1 2 3 4 5 6 7 8 9 

check button Enriched GO biological processes.
GO IDTissueDisease StageDescriptionGene RatioBg Ratiopvaluep.adjustCount
GO:0002181ColorectumADcytoplasmic translation109/3918148/187233.40e-432.13e-39109
GO:0070997ColorectumADneuron death114/3918361/187231.13e-063.72e-05114
GO:0006417ColorectumADregulation of translation141/3918468/187231.32e-064.22e-05141
GO:1901214ColorectumADregulation of neuron death99/3918319/187231.26e-052.76e-0499
GO:0051402ColorectumADneuron apoptotic process77/3918246/187238.07e-051.28e-0377
GO:1901215ColorectumADnegative regulation of neuron death67/3918208/187238.81e-051.35e-0367
GO:0006418ColorectumADtRNA aminoacylation for protein translation19/391841/187232.37e-043.03e-0319
GO:0043039ColorectumADtRNA aminoacylation19/391844/187237.13e-047.21e-0319
GO:0043523ColorectumADregulation of neuron apoptotic process64/3918212/187238.95e-048.63e-0364
GO:0043038ColorectumADamino acid activation19/391845/187239.94e-049.28e-0319
GO:0006520ColorectumADcellular amino acid metabolic process81/3918284/187231.37e-031.19e-0281
GO:0006414ColorectumADtranslational elongation21/391855/187232.53e-031.93e-0221
GO:0043524ColorectumADnegative regulation of neuron apoptotic process43/3918145/187238.04e-034.73e-0243
GO:00021811ColorectumSERcytoplasmic translation102/2897148/187231.38e-488.49e-45102
GO:00064181ColorectumSERtRNA aminoacylation for protein translation17/289741/187235.75e-051.35e-0317
GO:00709971ColorectumSERneuron death84/2897361/187235.76e-051.35e-0384
GO:00430391ColorectumSERtRNA aminoacylation17/289744/187231.64e-043.12e-0317
GO:00514021ColorectumSERneuron apoptotic process60/2897246/187231.65e-043.13e-0360
GO:00430381ColorectumSERamino acid activation17/289745/187232.25e-043.91e-0317
GO:00064171ColorectumSERregulation of translation100/2897468/187233.76e-045.74e-03100
Page: 1 2 

check button Enriched KEGG pathways.
Pathway IDTissueDisease StageDescriptionGene RatioBg Ratiopvaluep.adjustqvalueCount
Page: 1 

Top

Cell-cell communication analysis

check buttonIdentification of potential cell-cell interactions between two cell types and their ligand-receptor pairs for different disease states
LigandReceptorLRpairPathwayTissueDisease Stage
Page: 1 

Top

Single-cell gene regulatory network inference analysis

check buttonFind out the significant the regulons (TFs) and the target genes of each regulon across cell types for different disease states
TFCell TypeTissueDisease StageTarget GeneRSSRegulon Activity
∗The dot plots of a searched regulon are shown for all cell subpopulations in each disease state of each tissue based on the regulon specific score inferred using pySCENIC and by calculating the average expression.
Page: 1 

Top

Somatic mutation of malignant transformation related genes

check buttonAnnotation of somatic variants for genes involved in malignant transformation
Hugo SymbolVariant ClassVariant ClassificationdbSNP RSHGVScHGVSpHGVSp ShortSWISSPROTBIOTYPESIFTPolyPhenTumor Sample BarcodeTissueHistologySexAgeStageTherapy TypesDrugsOutcome
AARSSNVMissense_Mutationnovelc.2569N>Ap.Leu857Ilep.L857IP49588protein_codingtolerated(0.26)benign(0.003)TCGA-5L-AAT1-01Breastbreast invasive carcinomaFemale<65III/IVHormone TherapyletrozolSD
AARSSNVMissense_Mutationc.1823N>Tp.Thr608Metp.T608MP49588protein_codingdeleterious(0)probably_damaging(1)TCGA-AO-A03R-01Breastbreast invasive carcinomaFemale<65I/IIChemotherapydoxorubicinSD
AARSSNVMissense_Mutationc.1934N>Gp.Ser645Cysp.S645CP49588protein_codingdeleterious(0.02)possibly_damaging(0.765)TCGA-AO-A0JC-01Breastbreast invasive carcinomaFemale<65I/IIChemotherapyfluorouracilSD
AARSSNVMissense_Mutationc.1546N>Tp.Val516Leup.V516LP49588protein_codingtolerated(0.2)possibly_damaging(0.5)TCGA-AR-A0TS-01Breastbreast invasive carcinomaFemale<65I/IIChemotherapydoxorubicinSD
AARSSNVMissense_Mutationc.1327N>Ap.Glu443Lysp.E443KP49588protein_codingtolerated(0.62)benign(0.013)TCGA-BH-A0DK-01Breastbreast invasive carcinomaFemale<65I/IIHormone TherapytamoxiphenSD
AARSSNVMissense_Mutationc.1367N>Cp.Gly456Alap.G456AP49588protein_codingtolerated(0.39)benign(0.007)TCGA-C8-A26Y-01Breastbreast invasive carcinomaFemale>=65I/IIUnknownUnknownSD
AARSSNVMissense_Mutationc.445N>Cp.Asp149Hisp.D149HP49588protein_codingdeleterious(0)probably_damaging(1)TCGA-D8-A147-01Breastbreast invasive carcinomaFemale<65I/IIChemotherapydoxorubicineSD
AARSSNVMissense_Mutationnovelc.1678G>Cp.Glu560Glnp.E560QP49588protein_codingdeleterious(0.01)probably_damaging(0.997)TCGA-D8-A4Z1-01Breastbreast invasive carcinomaFemale>=65I/IIHormone TherapytamoxiphenSD
AARSSNVMissense_Mutationnovelc.634N>Gp.Leu212Valp.L212VP49588protein_codingtolerated(0.16)possibly_damaging(0.85)TCGA-E2-A14N-01Breastbreast invasive carcinomaFemale<65I/IIChemotherapycyclophosphamideSD
AARSSNVMissense_Mutationnovelc.1459N>Cp.Tyr487Hisp.Y487HP49588protein_codingdeleterious(0.02)probably_damaging(0.997)TCGA-LL-A5YN-01Breastbreast invasive carcinomaFemale<65I/IIChemotherapycarboplatinSD
Page: 1 2 3 4 5 6 7 8 

Top

Related drugs of malignant transformation related genes

check buttonIdentification of chemicals and drugs interact with genes involved in malignant transfromation
(DGIdb 4.0)
Entrez IDSymbolCategoryInteraction TypesDrug Claim NameDrug NamePMIDs
Page: 1