
|
|||||
|
 | |
| |
| |
| |
| |
| |
|
Gene: AARD |
Gene summary for AARD |
| Gene information | Species | Human | Gene symbol | AARD | Gene ID | 441376 |
| Gene name | alanine and arginine rich domain containing protein | |
| Gene Alias | C8orf85 | |
| Cytomap | 8q24.11 | |
| Gene Type | protein-coding | GO ID | GO:0007275 | UniProtAcc | B2RU19 |
Top |
Malignant transformation analysis |
| Identification of the aberrant gene expression in precancerous and cancerous lesions by comparing the gene expression of stem-like cells in diseased tissues with normal stem cells |
| Entrez ID | Symbol | Replicates | Species | Organ | Tissue | Adj P-value | Log2FC | Malignancy |
| 441376 | AARD | GSM4909281 | Human | Breast | IDC | 7.74e-63 | 1.18e+00 | 0.21 |
| 441376 | AARD | GSM4909282 | Human | Breast | IDC | 5.72e-16 | 4.63e-01 | -0.0288 |
| 441376 | AARD | GSM4909295 | Human | Breast | IDC | 1.38e-14 | 7.56e-01 | 0.0898 |
| 441376 | AARD | GSM4909297 | Human | Breast | IDC | 1.81e-02 | -1.59e-01 | 0.1517 |
| 441376 | AARD | GSM4909301 | Human | Breast | IDC | 5.00e-46 | 1.03e+00 | 0.1577 |
| 441376 | AARD | GSM4909305 | Human | Breast | IDC | 4.51e-04 | 3.68e-01 | 0.0436 |
| 441376 | AARD | GSM4909307 | Human | Breast | IDC | 9.59e-08 | 3.89e-01 | 0.1569 |
| 441376 | AARD | GSM4909309 | Human | Breast | IDC | 2.84e-08 | 4.56e-01 | 0.0483 |
| 441376 | AARD | GSM4909311 | Human | Breast | IDC | 1.87e-09 | 2.28e-01 | 0.1534 |
| 441376 | AARD | GSM4909313 | Human | Breast | IDC | 2.53e-02 | 2.34e-01 | 0.0391 |
| 441376 | AARD | GSM4909315 | Human | Breast | IDC | 3.34e-23 | 8.01e-01 | 0.21 |
| 441376 | AARD | GSM4909316 | Human | Breast | IDC | 5.27e-20 | 9.29e-01 | 0.21 |
| 441376 | AARD | GSM4909319 | Human | Breast | IDC | 1.87e-03 | -1.84e-01 | 0.1563 |
| 441376 | AARD | GSM4909320 | Human | Breast | IDC | 1.35e-09 | 3.11e-01 | 0.1575 |
| 441376 | AARD | GSM4909321 | Human | Breast | IDC | 1.44e-76 | 1.62e+00 | 0.1559 |
| 441376 | AARD | ctrl6 | Human | Breast | Precancer | 1.43e-02 | -2.02e-01 | -0.0061 |
| 441376 | AARD | brca10 | Human | Breast | Precancer | 2.14e-07 | -2.02e-01 | -0.0029 |
| 441376 | AARD | NCCBC14 | Human | Breast | DCIS | 9.77e-03 | -1.08e-01 | 0.2021 |
| 441376 | AARD | NCCBC5 | Human | Breast | DCIS | 2.96e-04 | 1.07e-01 | 0.2046 |
| 441376 | AARD | P1 | Human | Breast | IDC | 6.16e-05 | -1.09e-01 | 0.1527 |
| Page: 1 2 |
| Tissue | Expression Dynamics | Abbreviation |
| Breast | 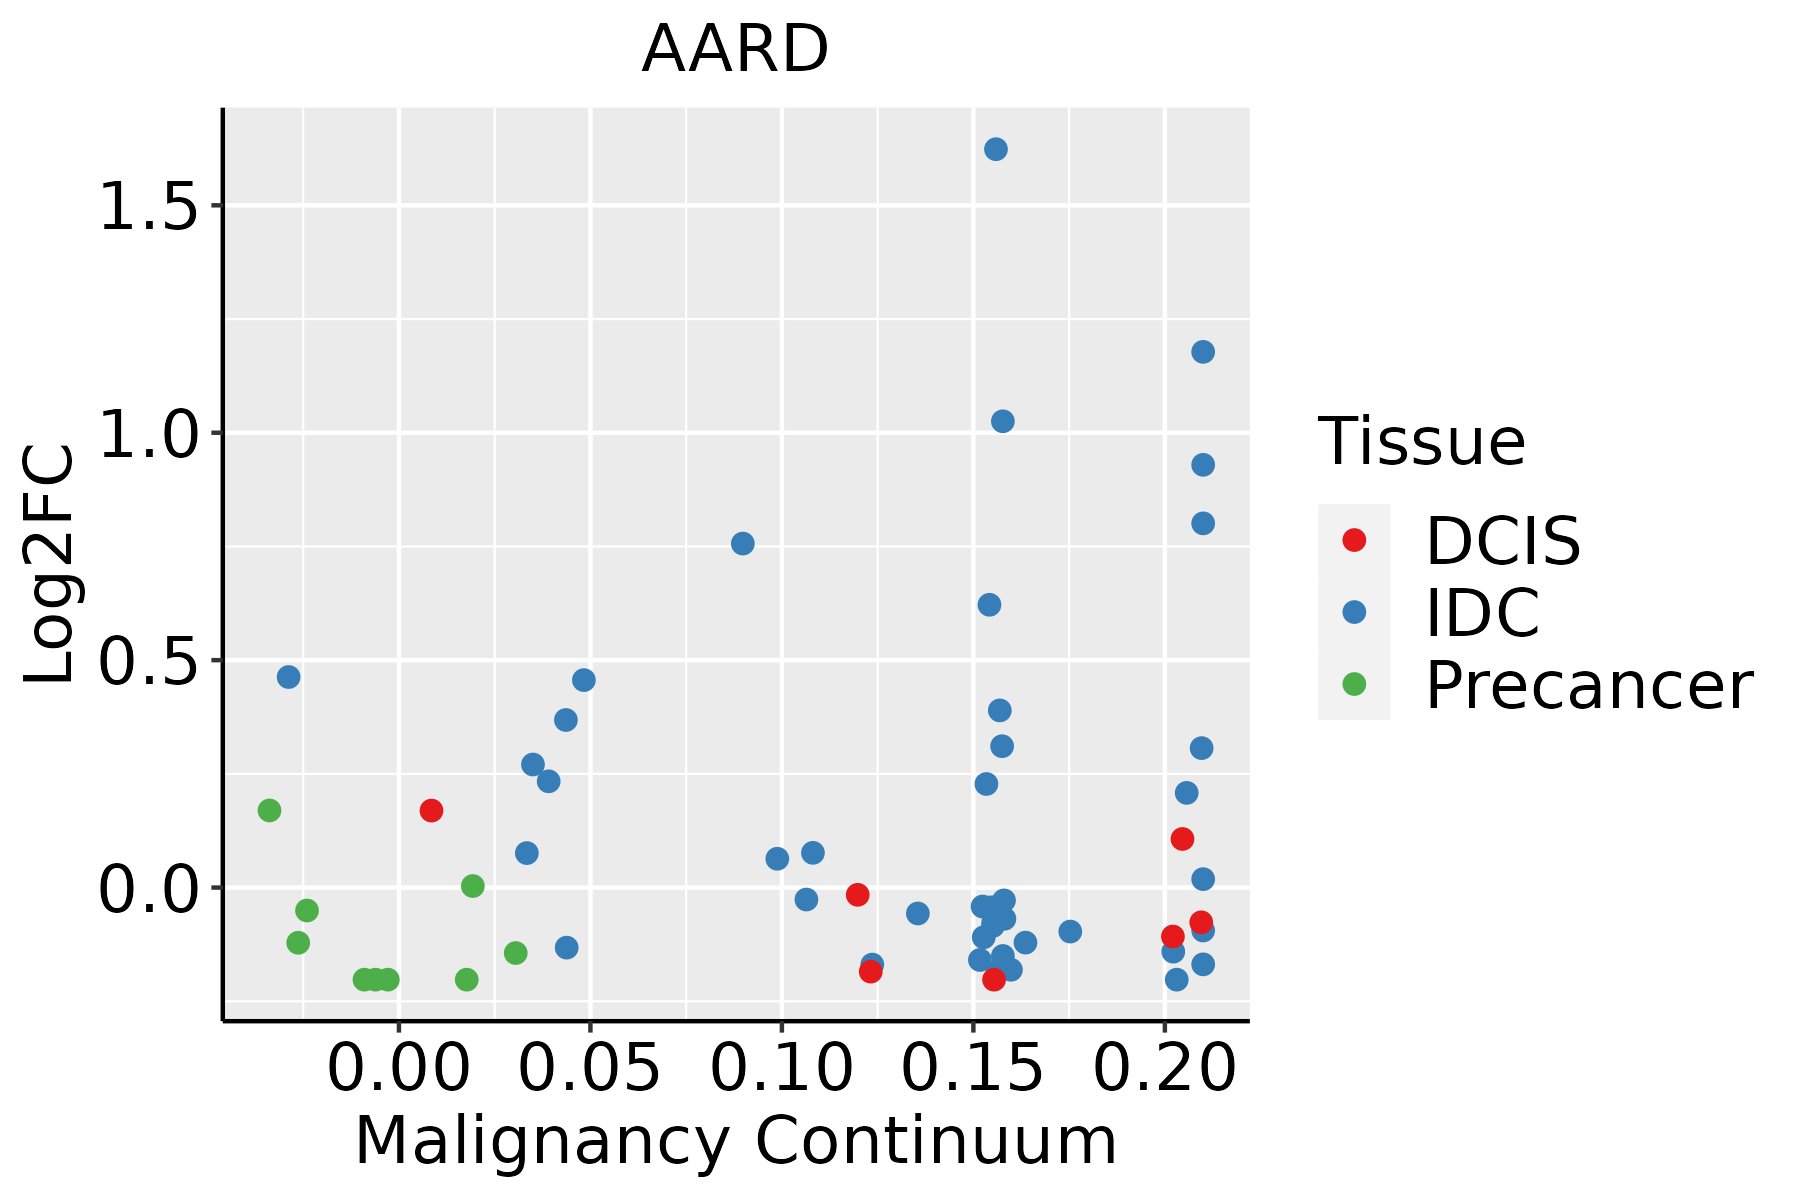 | IDC: Invasive ductal carcinoma |
| DCIS: Ductal carcinoma in situ | ||
| Precancer(BRCA1-mut): Precancerous lesion from BRCA1 mutation carriers | ||
| Esophagus | 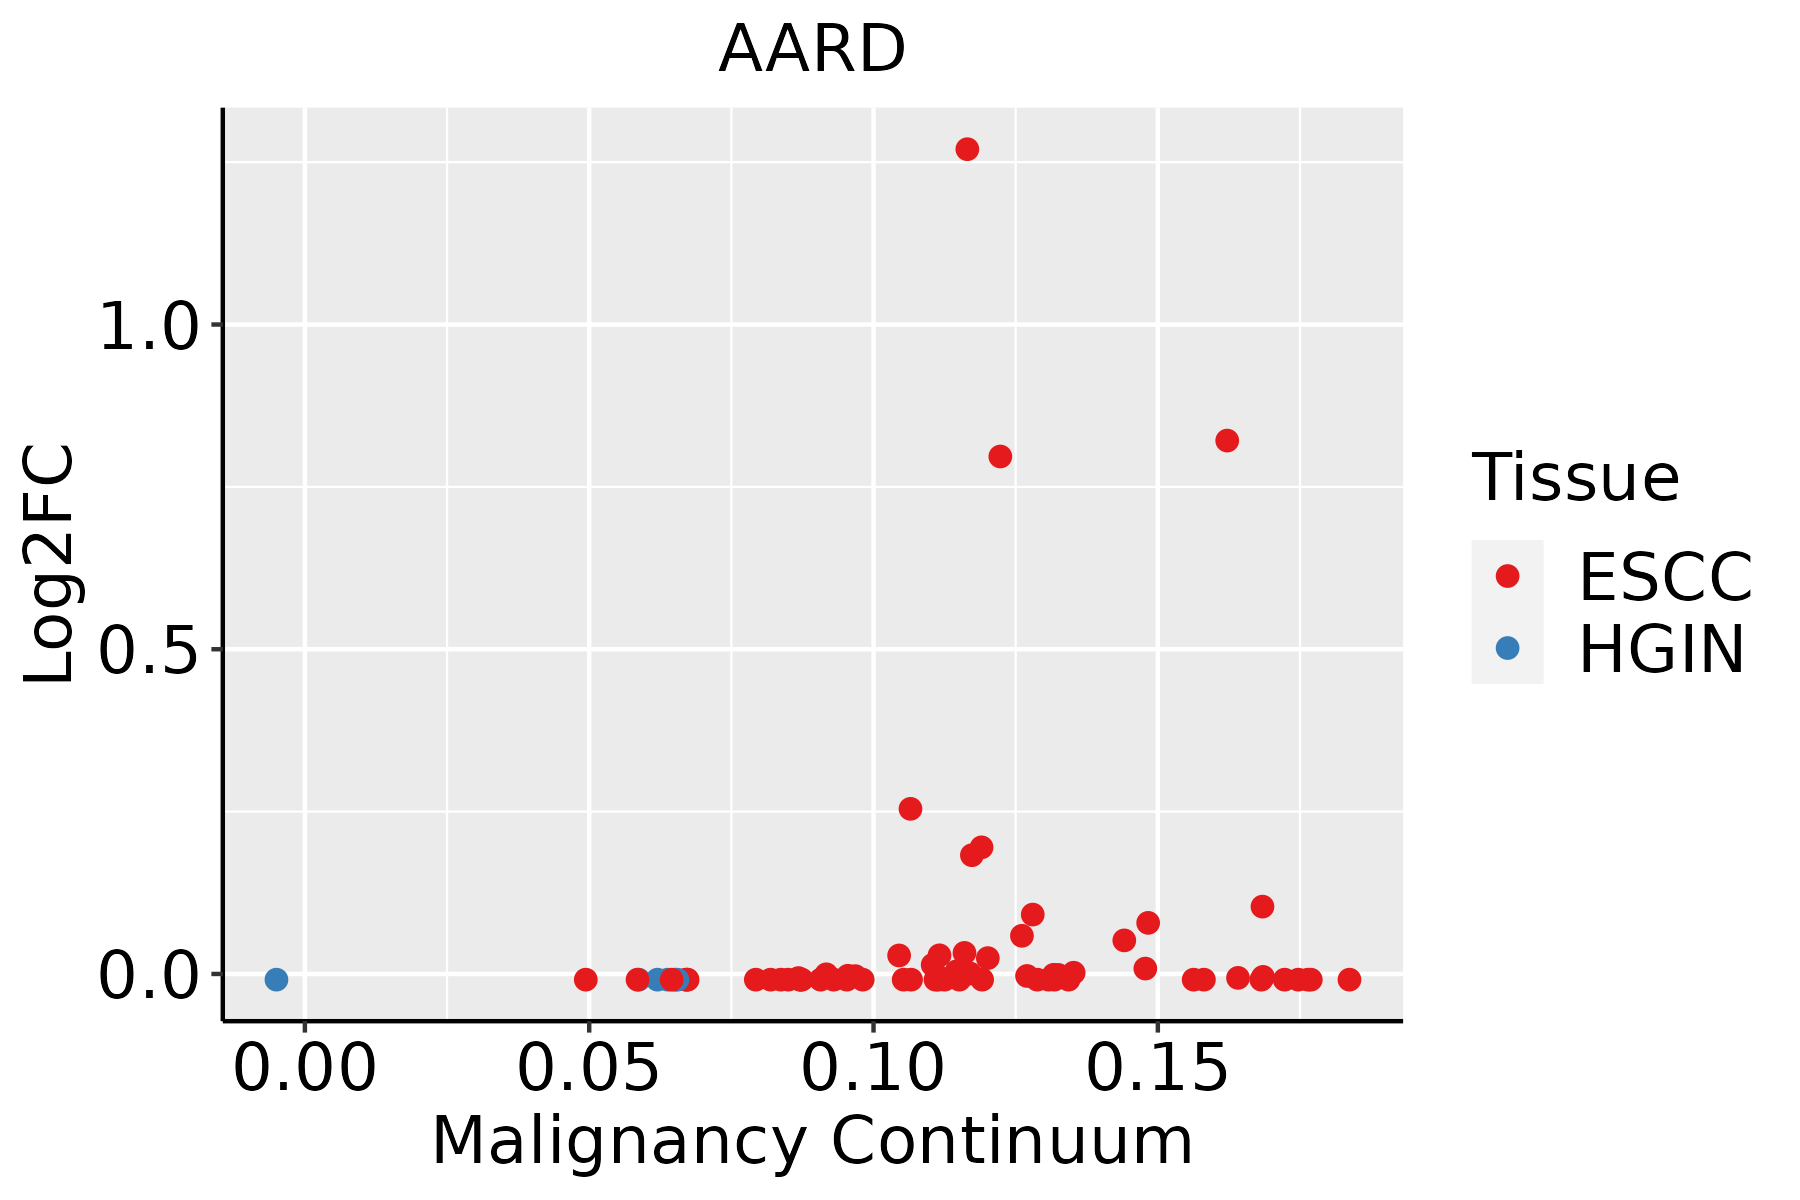 | ESCC: Esophageal squamous cell carcinoma |
| HGIN: High-grade intraepithelial neoplasias | ||
| LGIN: Low-grade intraepithelial neoplasias | ||
| Liver | 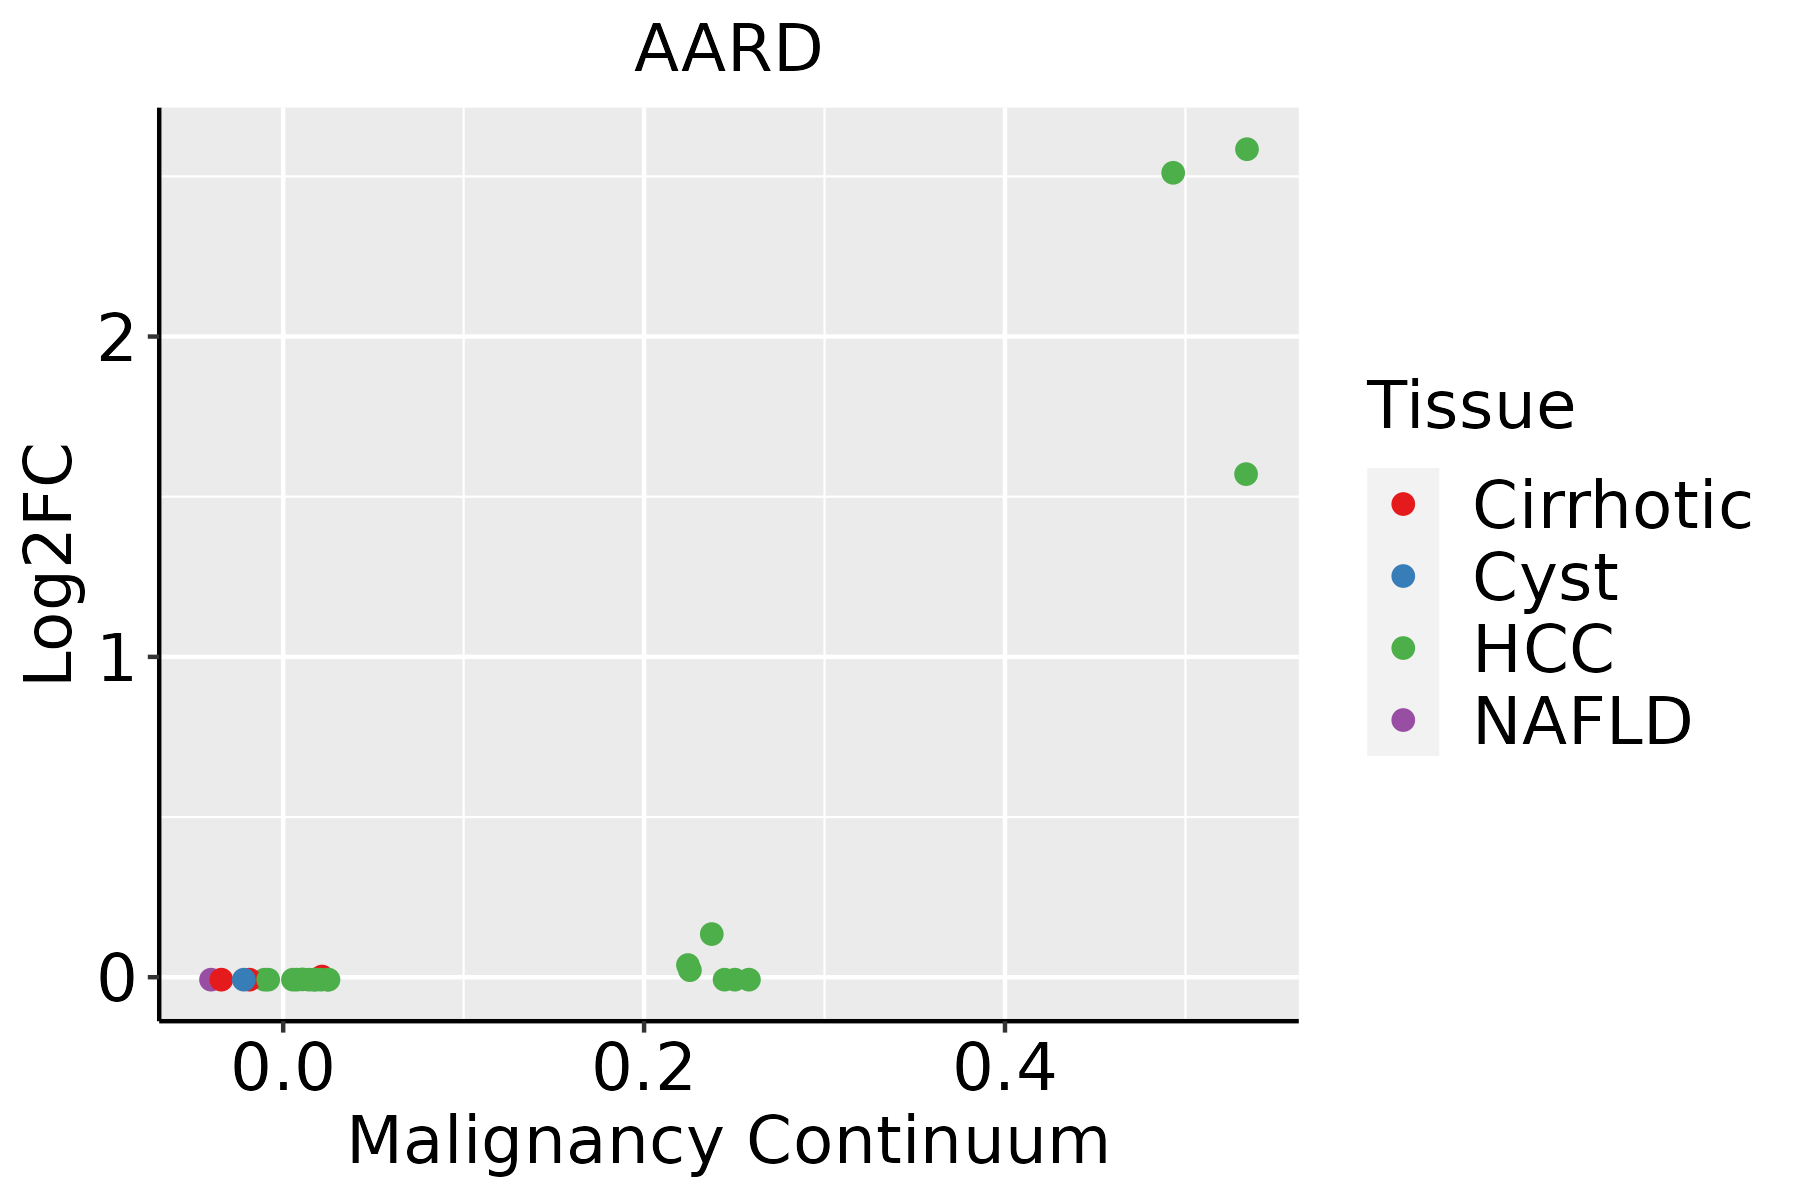 | HCC: Hepatocellular carcinoma |
| NAFLD: Non-alcoholic fatty liver disease | ||
| Thyroid | 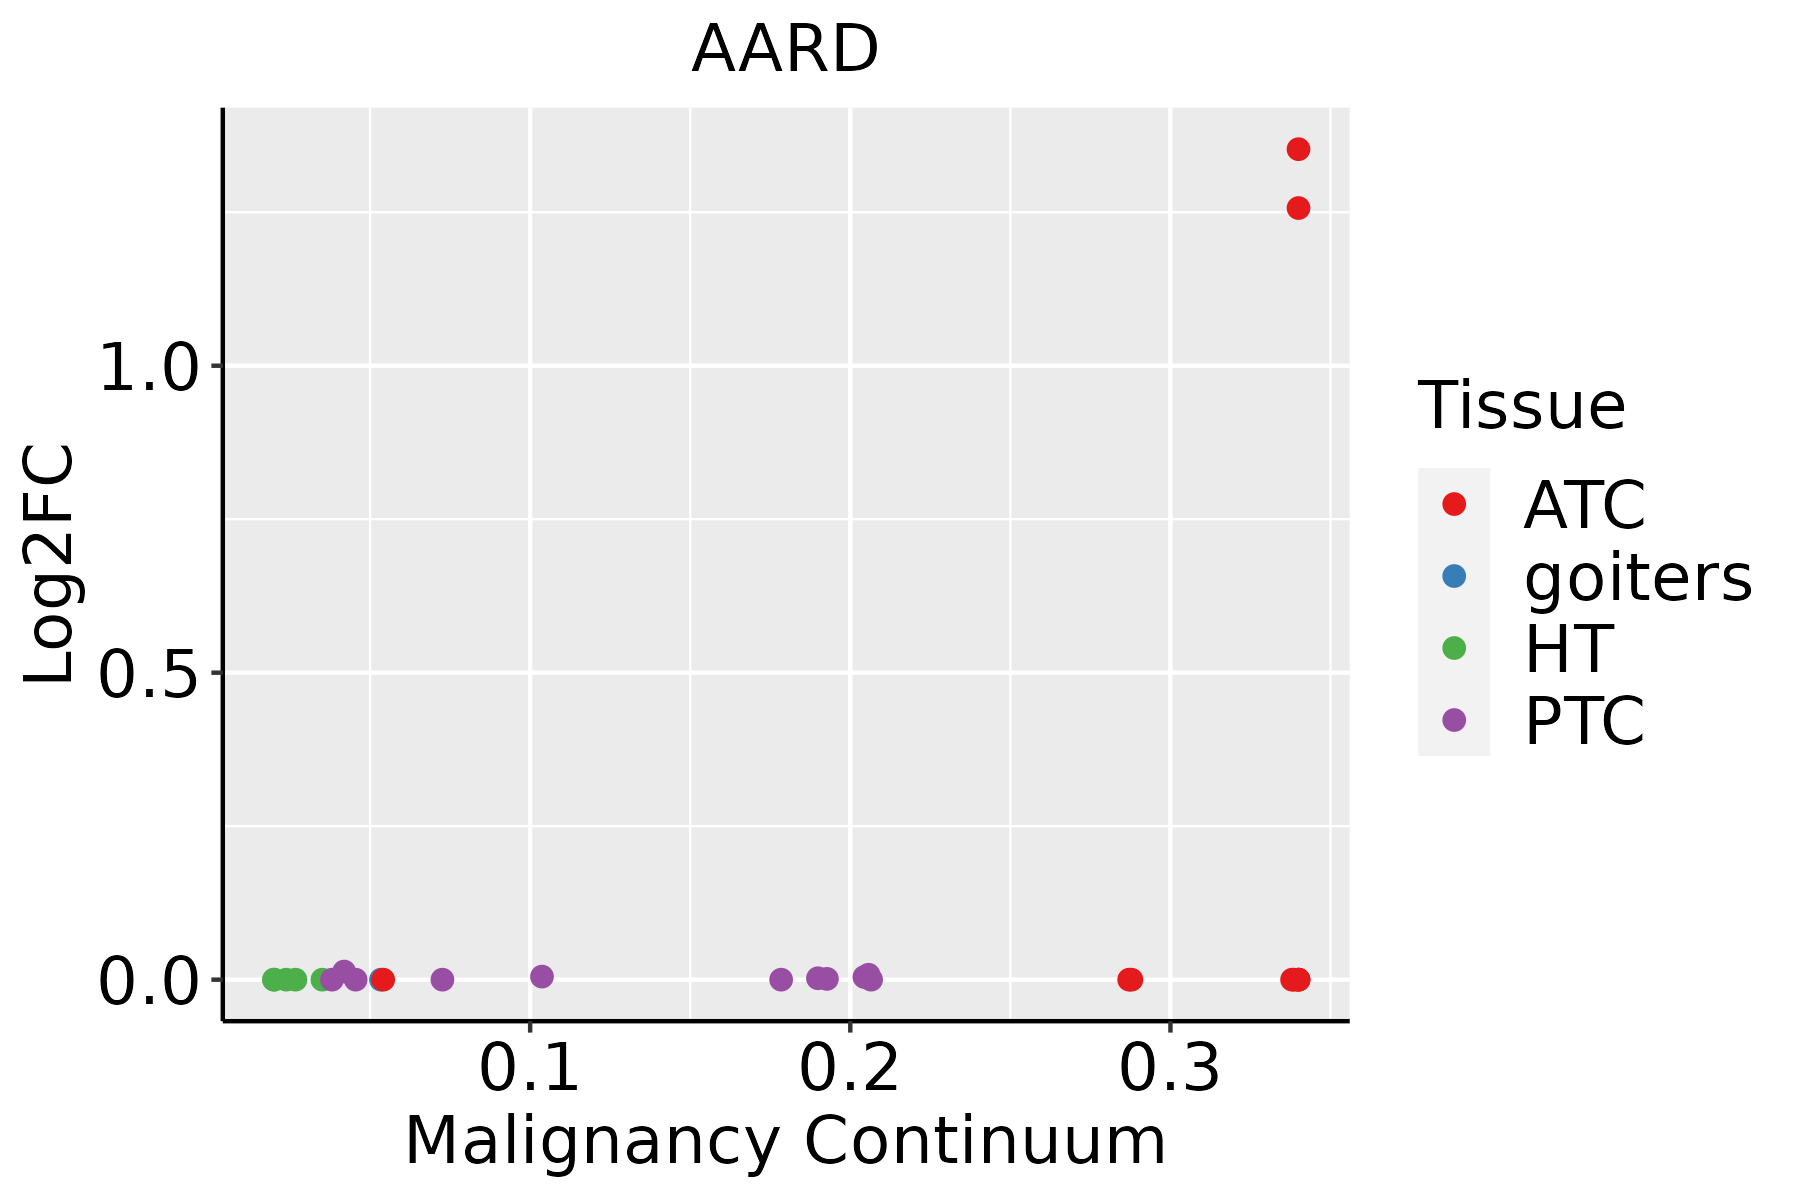 | ATC: Anaplastic thyroid cancer |
| HT: Hashimoto's thyroiditis | ||
| PTC: Papillary thyroid cancer |
| ∗log2FC in expression of this searched gene in stem-like cells from each diseased tissue sample relative to stem-like cells in normal samples in each tissue plotted against the malignancy continuum. Samples are colored based on if they are from different disease stage. |
Top |
Malignant transformation related pathway analysis |
| Find out the enriched GO biological processes and KEGG pathways involved in transition from healthy to precancer to cancer |
| Tissue | Disease Stage | Enriched GO biological Processes |
| Colorectum | AD |  |
| Colorectum | SER |  |
| Colorectum | MSS |  |
| Colorectum | MSI-H |  |
| Colorectum | FAP |  |
| ∗Top 15 enriched GO BP terms are showed in the bar plot of each disease state in each tissue. Each row represents a significant GO biological process which is colored according to the -log10(p.adjust). |
| Page: 1 2 3 4 5 6 7 8 9 |
| GO ID | Tissue | Disease Stage | Description | Gene Ratio | Bg Ratio | pvalue | p.adjust | Count |
| GO:00303244 | Breast | IDC | lung development | 28/1434 | 177/18723 | 1.90e-04 | 3.15e-03 | 28 |
| GO:00303234 | Breast | IDC | respiratory tube development | 28/1434 | 181/18723 | 2.78e-04 | 4.26e-03 | 28 |
| GO:00605412 | Breast | IDC | respiratory system development | 30/1434 | 203/18723 | 3.85e-04 | 5.40e-03 | 30 |
| GO:003032413 | Breast | DCIS | lung development | 27/1390 | 177/18723 | 2.73e-04 | 4.09e-03 | 27 |
| GO:003032313 | Breast | DCIS | respiratory tube development | 27/1390 | 181/18723 | 3.93e-04 | 5.41e-03 | 27 |
| GO:006054111 | Breast | DCIS | respiratory system development | 28/1390 | 203/18723 | 1.10e-03 | 1.19e-02 | 28 |
| GO:00303239 | Esophagus | ESCC | respiratory tube development | 112/8552 | 181/18723 | 7.82e-06 | 7.69e-05 | 112 |
| GO:00605417 | Esophagus | ESCC | respiratory system development | 123/8552 | 203/18723 | 1.26e-05 | 1.15e-04 | 123 |
| GO:00303249 | Esophagus | ESCC | lung development | 109/8552 | 177/18723 | 1.40e-05 | 1.27e-04 | 109 |
| GO:003032311 | Liver | HCC | respiratory tube development | 95/7958 | 181/18723 | 4.15e-03 | 1.81e-02 | 95 |
| GO:003032411 | Liver | HCC | lung development | 91/7958 | 177/18723 | 1.01e-02 | 3.80e-02 | 91 |
| GO:003032321 | Thyroid | ATC | respiratory tube development | 93/6293 | 181/18723 | 5.67e-07 | 8.02e-06 | 93 |
| GO:003032421 | Thyroid | ATC | lung development | 90/6293 | 177/18723 | 1.53e-06 | 1.88e-05 | 90 |
| GO:006054121 | Thyroid | ATC | respiratory system development | 100/6293 | 203/18723 | 2.66e-06 | 3.08e-05 | 100 |
| Page: 1 |
| Pathway ID | Tissue | Disease Stage | Description | Gene Ratio | Bg Ratio | pvalue | p.adjust | qvalue | Count |
| Page: 1 |
Top |
Cell-cell communication analysis |
| Identification of potential cell-cell interactions between two cell types and their ligand-receptor pairs for different disease states |
| Ligand | Receptor | LRpair | Pathway | Tissue | Disease Stage |
| Page: 1 |
Top |
Single-cell gene regulatory network inference analysis |
| Find out the significant the regulons (TFs) and the target genes of each regulon across cell types for different disease states |
| TF | Cell Type | Tissue | Disease Stage | Target Gene | RSS | Regulon Activity |
| ∗The dot plots of a searched regulon are shown for all cell subpopulations in each disease state of each tissue based on the regulon specific score inferred using pySCENIC and by calculating the average expression. |
| Page: 1 |
Top |
Somatic mutation of malignant transformation related genes |
| Annotation of somatic variants for genes involved in malignant transformation |
| Hugo Symbol | Variant Class | Variant Classification | dbSNP RS | HGVSc | HGVSp | HGVSp Short | SWISSPROT | BIOTYPE | SIFT | PolyPhen | Tumor Sample Barcode | Tissue | Histology | Sex | Age | Stage | Therapy Types | Drugs | Outcome |
| AARD | SNV | Missense_Mutation | novel | c.329N>T | p.Glu110Val | p.E110V | Q4LEZ3 | protein_coding | deleterious(0) | probably_damaging(0.992) | TCGA-2W-A8YY-01 | Cervix | cervical & endocervical cancer | Female | <65 | I/II | Chemotherapy | cisplatin | CR |
| AARD | SNV | Missense_Mutation | c.348C>G | p.His116Gln | p.H116Q | Q4LEZ3 | protein_coding | tolerated(0.19) | benign(0.127) | TCGA-DS-A1OC-01 | Cervix | cervical & endocervical cancer | Female | <65 | I/II | Chemotherapy | gemcitabine | SD | |
| AARD | SNV | Missense_Mutation | c.151N>A | p.Ala51Thr | p.A51T | Q4LEZ3 | protein_coding | tolerated(0.24) | benign(0.081) | TCGA-AA-3492-01 | Colorectum | colon adenocarcinoma | Female | >=65 | I/II | Unknown | Unknown | SD | |
| AARD | SNV | Missense_Mutation | novel | c.35N>T | p.Arg12Ile | p.R12I | Q4LEZ3 | protein_coding | deleterious(0.04) | possibly_damaging(0.693) | TCGA-AA-3984-01 | Colorectum | colon adenocarcinoma | Female | <65 | I/II | Unknown | Unknown | SD |
| AARD | SNV | Missense_Mutation | rs778592400 | c.328N>A | p.Glu110Lys | p.E110K | Q4LEZ3 | protein_coding | deleterious(0.01) | possibly_damaging(0.853) | TCGA-AZ-4315-01 | Colorectum | colon adenocarcinoma | Male | <65 | I/II | Unknown | Unknown | SD |
| AARD | SNV | Missense_Mutation | rs375266231 | c.455N>T | p.Ala152Val | p.A152V | Q4LEZ3 | protein_coding | tolerated(1) | benign(0) | TCGA-CM-6171-01 | Colorectum | colon adenocarcinoma | Female | >=65 | I/II | Unknown | Unknown | SD |
| AARD | SNV | Missense_Mutation | novel | c.33N>C | p.Glu11Asp | p.E11D | Q4LEZ3 | protein_coding | deleterious(0.05) | benign(0.001) | TCGA-AJ-A3QS-01 | Endometrium | uterine corpus endometrioid carcinoma | Female | <65 | III/IV | Chemotherapy | cisplatin | CR |
| AARD | SNV | Missense_Mutation | novel | c.445N>T | p.Asp149Tyr | p.D149Y | Q4LEZ3 | protein_coding | deleterious(0) | benign(0.415) | TCGA-AX-A1CE-01 | Endometrium | uterine corpus endometrioid carcinoma | Female | <65 | I/II | Unspecific | Paclitaxel | SD |
| AARD | SNV | Missense_Mutation | rs375266231 | c.455C>T | p.Ala152Val | p.A152V | Q4LEZ3 | protein_coding | tolerated(1) | benign(0) | TCGA-AX-A3FT-01 | Endometrium | uterine corpus endometrioid carcinoma | Female | <65 | I/II | Unknown | Unknown | SD |
| AARD | SNV | Missense_Mutation | novel | c.104N>G | p.Asp35Gly | p.D35G | Q4LEZ3 | protein_coding | tolerated(1) | benign(0) | TCGA-2Y-A9H1-01 | Liver | liver hepatocellular carcinoma | Male | <65 | I/II | Unknown | Unknown | PD |
| Page: 1 2 3 |
Top |
Related drugs of malignant transformation related genes |
| Identification of chemicals and drugs interact with genes involved in malignant transfromation |
| (DGIdb 4.0) |
| Entrez ID | Symbol | Category | Interaction Types | Drug Claim Name | Drug Name | PMIDs |
| Page: 1 |

Copyright 2023-Present -The University of Texas Health Science Center at Houston |