
|
|||||
|
 | |
| |
| |
| |
| |
| |
|
Gene: AAMP |
Gene summary for AAMP |
| Gene information | Species | Human | Gene symbol | AAMP | Gene ID | 14 |
| Gene name | angio associated migratory cell protein | |
| Gene Alias | AAMP | |
| Cytomap | 2q35 | |
| Gene Type | protein-coding | GO ID | GO:0001525 | UniProtAcc | A0A024R410 |
Top |
Malignant transformation analysis |
| Identification of the aberrant gene expression in precancerous and cancerous lesions by comparing the gene expression of stem-like cells in diseased tissues with normal stem cells |
| Entrez ID | Symbol | Replicates | Species | Organ | Tissue | Adj P-value | Log2FC | Malignancy |
| 14 | AAMP | HTA11_2487_2000001011 | Human | Colorectum | SER | 1.54e-06 | 3.93e-01 | -0.1808 |
| 14 | AAMP | HTA11_1938_2000001011 | Human | Colorectum | AD | 1.41e-11 | 4.84e-01 | -0.0811 |
| 14 | AAMP | HTA11_78_2000001011 | Human | Colorectum | AD | 1.72e-11 | 5.73e-01 | -0.1088 |
| 14 | AAMP | HTA11_347_2000001011 | Human | Colorectum | AD | 7.82e-30 | 7.38e-01 | -0.1954 |
| 14 | AAMP | HTA11_411_2000001011 | Human | Colorectum | SER | 1.00e-02 | 4.95e-01 | -0.2602 |
| 14 | AAMP | HTA11_3361_2000001011 | Human | Colorectum | AD | 3.67e-08 | 4.41e-01 | -0.1207 |
| 14 | AAMP | HTA11_83_2000001011 | Human | Colorectum | SER | 7.82e-07 | 4.37e-01 | -0.1526 |
| 14 | AAMP | HTA11_696_2000001011 | Human | Colorectum | AD | 3.27e-10 | 4.33e-01 | -0.1464 |
| 14 | AAMP | HTA11_866_2000001011 | Human | Colorectum | AD | 1.06e-07 | 2.96e-01 | -0.1001 |
| 14 | AAMP | HTA11_1391_2000001011 | Human | Colorectum | AD | 6.29e-18 | 6.01e-01 | -0.059 |
| 14 | AAMP | HTA11_2992_2000001011 | Human | Colorectum | SER | 2.44e-03 | 5.55e-01 | -0.1706 |
| 14 | AAMP | HTA11_546_2000001011 | Human | Colorectum | AD | 5.01e-06 | 4.97e-01 | -0.0842 |
| 14 | AAMP | HTA11_7862_2000001011 | Human | Colorectum | AD | 1.83e-06 | 4.36e-01 | -0.0179 |
| 14 | AAMP | HTA11_866_3004761011 | Human | Colorectum | AD | 7.75e-20 | 5.47e-01 | 0.096 |
| 14 | AAMP | HTA11_4255_2000001011 | Human | Colorectum | SER | 4.44e-05 | 4.56e-01 | 0.0446 |
| 14 | AAMP | HTA11_8622_2000001021 | Human | Colorectum | SER | 7.43e-07 | 6.27e-01 | 0.0528 |
| 14 | AAMP | HTA11_7663_2000001011 | Human | Colorectum | SER | 8.27e-05 | 7.63e-01 | 0.0131 |
| 14 | AAMP | HTA11_6801_2000001011 | Human | Colorectum | SER | 1.20e-06 | 6.97e-01 | 0.0171 |
| 14 | AAMP | HTA11_10711_2000001011 | Human | Colorectum | AD | 2.45e-05 | 4.02e-01 | 0.0338 |
| 14 | AAMP | HTA11_7696_3000711011 | Human | Colorectum | AD | 1.35e-16 | 5.20e-01 | 0.0674 |
| Page: 1 2 3 4 5 6 7 8 |
| Tissue | Expression Dynamics | Abbreviation |
| Colorectum (GSE201348) |  | FAP: Familial adenomatous polyposis |
| CRC: Colorectal cancer | ||
| Colorectum (HTA11) |  | AD: Adenomas |
| SER: Sessile serrated lesions | ||
| MSI-H: Microsatellite-high colorectal cancer | ||
| MSS: Microsatellite stable colorectal cancer | ||
| Esophagus | 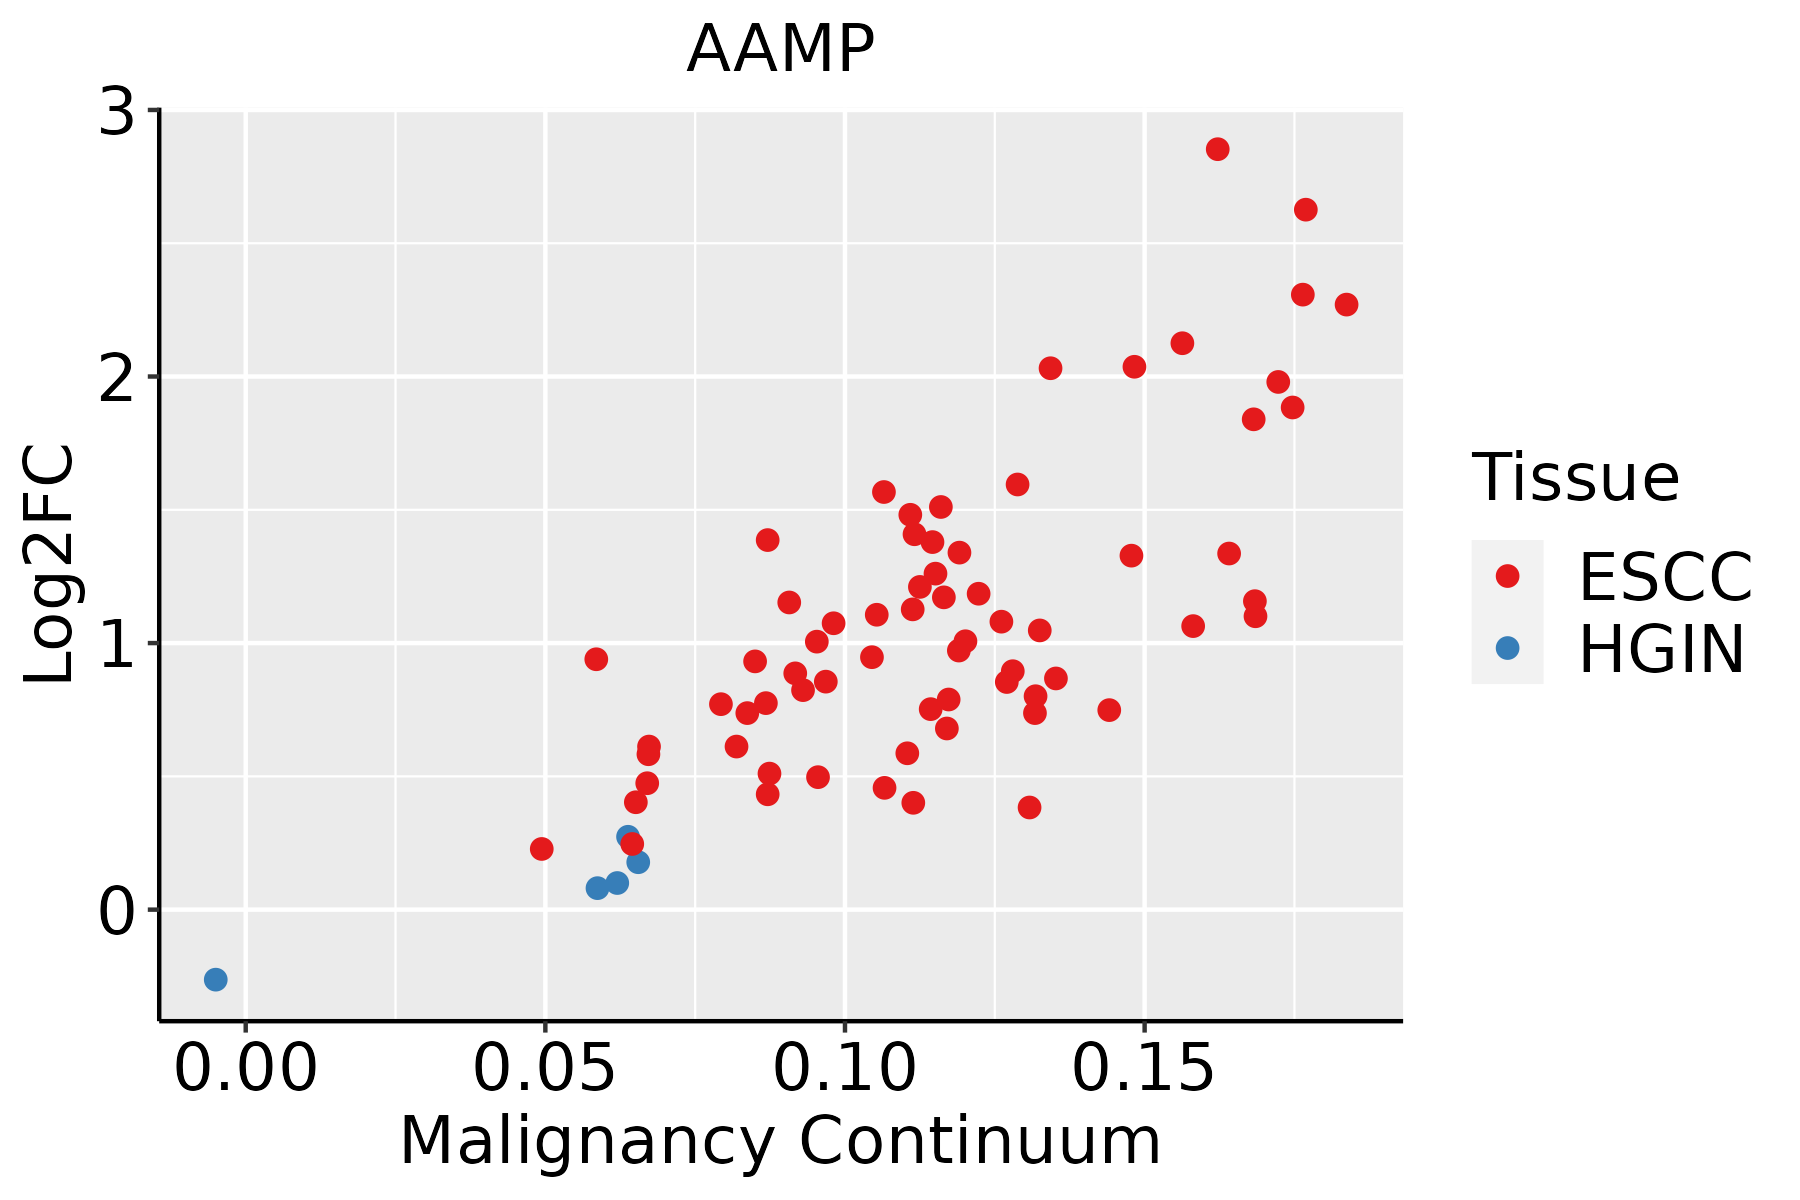 | ESCC: Esophageal squamous cell carcinoma |
| HGIN: High-grade intraepithelial neoplasias | ||
| LGIN: Low-grade intraepithelial neoplasias | ||
| Liver | 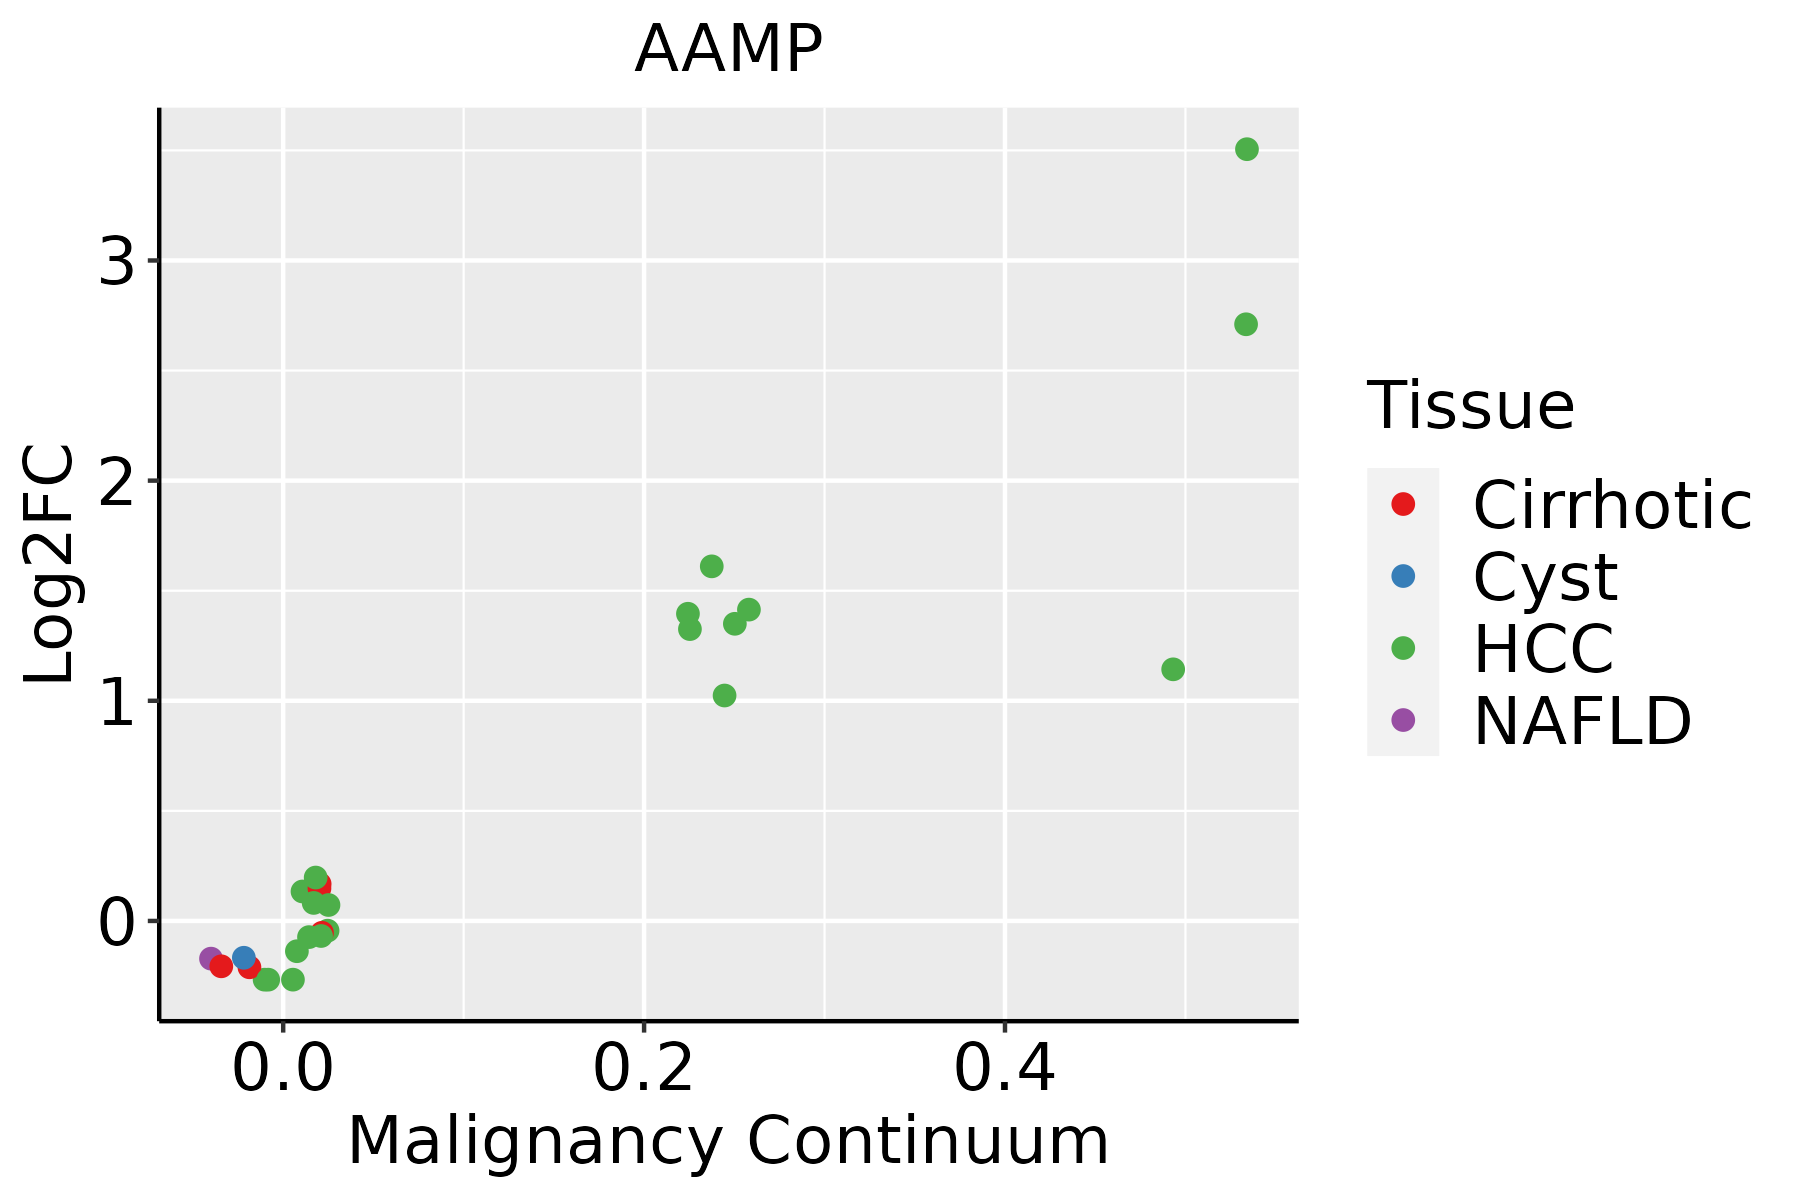 | HCC: Hepatocellular carcinoma |
| NAFLD: Non-alcoholic fatty liver disease | ||
| Oral Cavity | 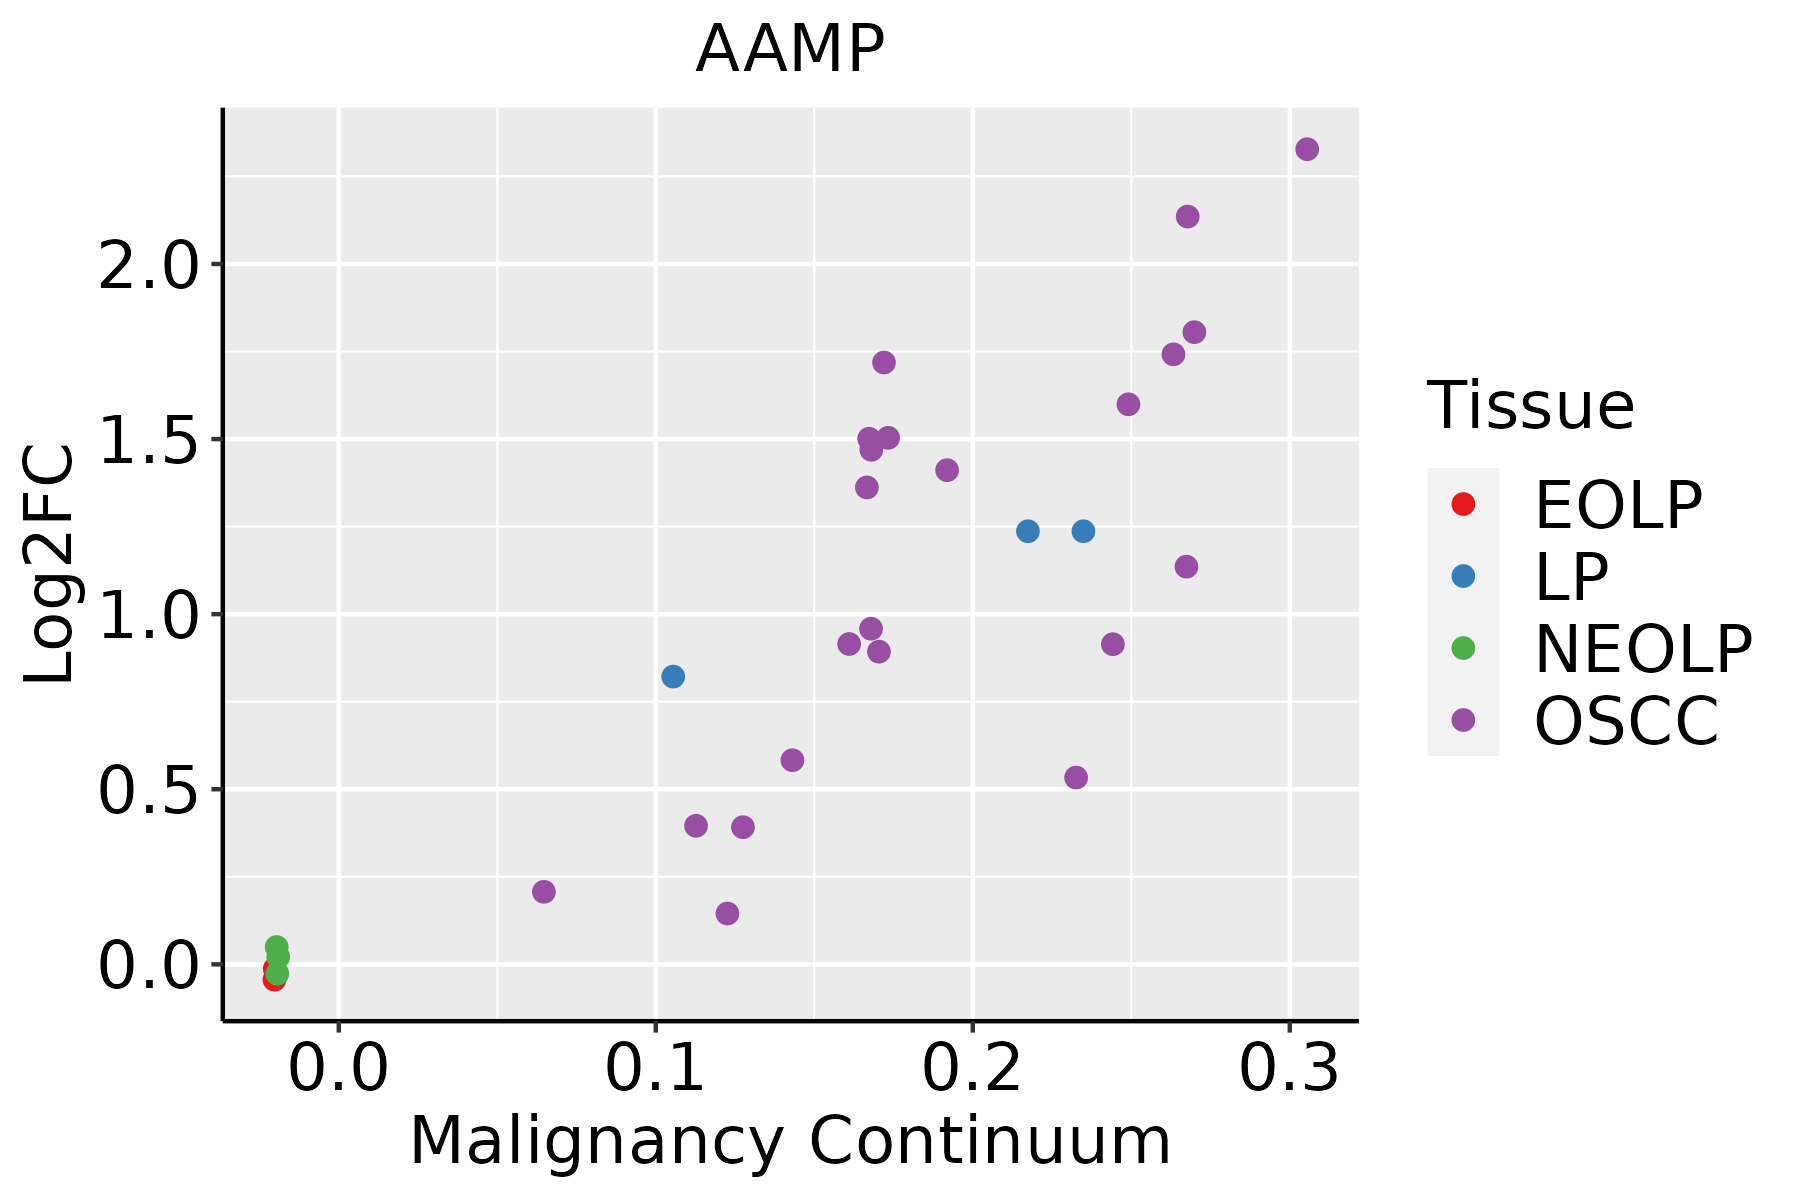 | EOLP: Erosive Oral lichen planus |
| LP: leukoplakia | ||
| NEOLP: Non-erosive oral lichen planus | ||
| OSCC: Oral squamous cell carcinoma | ||
| Skin |  | AK: Actinic keratosis |
| cSCC: Cutaneous squamous cell carcinoma | ||
| SCCIS:squamous cell carcinoma in situ | ||
| Thyroid |  | ATC: Anaplastic thyroid cancer |
| HT: Hashimoto's thyroiditis | ||
| PTC: Papillary thyroid cancer |
| ∗log2FC in expression of this searched gene in stem-like cells from each diseased tissue sample relative to stem-like cells in normal samples in each tissue plotted against the malignancy continuum. Samples are colored based on if they are from different disease stage. |
Top |
Malignant transformation related pathway analysis |
| Find out the enriched GO biological processes and KEGG pathways involved in transition from healthy to precancer to cancer |
| Tissue | Disease Stage | Enriched GO biological Processes |
| Colorectum | AD |  |
| Colorectum | SER |  |
| Colorectum | MSS |  |
| Colorectum | MSI-H |  |
| Colorectum | FAP |  |
| ∗Top 15 enriched GO BP terms are showed in the bar plot of each disease state in each tissue. Each row represents a significant GO biological process which is colored according to the -log10(p.adjust). |
| Page: 1 2 3 4 5 6 7 8 9 |
| GO ID | Tissue | Disease Stage | Description | Gene Ratio | Bg Ratio | pvalue | p.adjust | Count |
| GO:0001667 | Colorectum | AD | ameboidal-type cell migration | 137/3918 | 475/18723 | 2.17e-05 | 4.33e-04 | 137 |
| GO:0090132 | Colorectum | AD | epithelium migration | 105/3918 | 360/18723 | 1.18e-04 | 1.73e-03 | 105 |
| GO:0010632 | Colorectum | AD | regulation of epithelial cell migration | 88/3918 | 292/18723 | 1.19e-04 | 1.75e-03 | 88 |
| GO:0010631 | Colorectum | AD | epithelial cell migration | 104/3918 | 357/18723 | 1.33e-04 | 1.90e-03 | 104 |
| GO:0090130 | Colorectum | AD | tissue migration | 105/3918 | 365/18723 | 2.10e-04 | 2.77e-03 | 105 |
| GO:0010634 | Colorectum | AD | positive regulation of epithelial cell migration | 56/3918 | 176/18723 | 4.51e-04 | 5.03e-03 | 56 |
| GO:0043542 | Colorectum | AD | endothelial cell migration | 78/3918 | 279/18723 | 2.97e-03 | 2.22e-02 | 78 |
| GO:0010595 | Colorectum | AD | positive regulation of endothelial cell migration | 40/3918 | 133/18723 | 8.01e-03 | 4.73e-02 | 40 |
| GO:00016671 | Colorectum | SER | ameboidal-type cell migration | 105/2897 | 475/18723 | 6.97e-05 | 1.59e-03 | 105 |
| GO:00901321 | Colorectum | SER | epithelium migration | 82/2897 | 360/18723 | 1.50e-04 | 2.93e-03 | 82 |
| GO:00106311 | Colorectum | SER | epithelial cell migration | 81/2897 | 357/18723 | 1.87e-04 | 3.44e-03 | 81 |
| GO:00901301 | Colorectum | SER | tissue migration | 82/2897 | 365/18723 | 2.40e-04 | 4.12e-03 | 82 |
| GO:00106321 | Colorectum | SER | regulation of epithelial cell migration | 68/2897 | 292/18723 | 2.72e-04 | 4.53e-03 | 68 |
| GO:00435421 | Colorectum | SER | endothelial cell migration | 61/2897 | 279/18723 | 2.76e-03 | 2.47e-02 | 61 |
| GO:00106341 | Colorectum | SER | positive regulation of epithelial cell migration | 41/2897 | 176/18723 | 4.03e-03 | 3.30e-02 | 41 |
| GO:00016672 | Colorectum | MSS | ameboidal-type cell migration | 120/3467 | 475/18723 | 1.37e-04 | 2.05e-03 | 120 |
| GO:00901322 | Colorectum | MSS | epithelium migration | 93/3467 | 360/18723 | 3.30e-04 | 4.24e-03 | 93 |
| GO:00106312 | Colorectum | MSS | epithelial cell migration | 92/3467 | 357/18723 | 3.87e-04 | 4.86e-03 | 92 |
| GO:00106322 | Colorectum | MSS | regulation of epithelial cell migration | 77/3467 | 292/18723 | 5.39e-04 | 6.04e-03 | 77 |
| GO:00901302 | Colorectum | MSS | tissue migration | 93/3467 | 365/18723 | 5.42e-04 | 6.06e-03 | 93 |
| Page: 1 2 3 4 |
| Pathway ID | Tissue | Disease Stage | Description | Gene Ratio | Bg Ratio | pvalue | p.adjust | qvalue | Count |
| Page: 1 |
Top |
Cell-cell communication analysis |
| Identification of potential cell-cell interactions between two cell types and their ligand-receptor pairs for different disease states |
| Ligand | Receptor | LRpair | Pathway | Tissue | Disease Stage |
| Page: 1 |
Top |
Single-cell gene regulatory network inference analysis |
| Find out the significant the regulons (TFs) and the target genes of each regulon across cell types for different disease states |
| TF | Cell Type | Tissue | Disease Stage | Target Gene | RSS | Regulon Activity |
| ∗The dot plots of a searched regulon are shown for all cell subpopulations in each disease state of each tissue based on the regulon specific score inferred using pySCENIC and by calculating the average expression. |
| Page: 1 |
Top |
Somatic mutation of malignant transformation related genes |
| Annotation of somatic variants for genes involved in malignant transformation |
| Hugo Symbol | Variant Class | Variant Classification | dbSNP RS | HGVSc | HGVSp | HGVSp Short | SWISSPROT | BIOTYPE | SIFT | PolyPhen | Tumor Sample Barcode | Tissue | Histology | Sex | Age | Stage | Therapy Types | Drugs | Outcome |
| AAMP | SNV | Missense_Mutation | novel | c.1117N>A | p.Val373Met | p.V373M | protein_coding | tolerated(0.11) | benign(0.12) | TCGA-AR-A5QP-01 | Breast | breast invasive carcinoma | Female | <65 | I/II | Hormone Therapy | tamoxiphen | SD | |
| AAMP | insertion | Frame_Shift_Ins | novel | c.270_271insGCCAAGGGAATCCAGGAAA | p.His91AlafsTer29 | p.H91Afs*29 | protein_coding | TCGA-AN-A041-01 | Breast | breast invasive carcinoma | Female | <65 | I/II | Unknown | Unknown | SD | |||
| AAMP | SNV | Missense_Mutation | novel | c.406G>A | p.Asp136Asn | p.D136N | protein_coding | deleterious(0.01) | probably_damaging(1) | TCGA-2W-A8YY-01 | Cervix | cervical & endocervical cancer | Female | <65 | I/II | Chemotherapy | cisplatin | CR | |
| AAMP | SNV | Missense_Mutation | c.127G>A | p.Asp43Asn | p.D43N | protein_coding | deleterious(0.02) | probably_damaging(0.977) | TCGA-IR-A3LL-01 | Cervix | cervical & endocervical cancer | Female | <65 | I/II | Chemotherapy | cisplatin | CR | ||
| AAMP | SNV | Missense_Mutation | c.94N>C | p.Glu32Gln | p.E32Q | protein_coding | deleterious(0.04) | benign(0.289) | TCGA-JW-A5VL-01 | Cervix | cervical & endocervical cancer | Female | <65 | I/II | Unknown | Unknown | SD | ||
| AAMP | SNV | Missense_Mutation | c.698N>C | p.Val233Ala | p.V233A | protein_coding | tolerated(0.13) | benign(0.191) | TCGA-G4-6302-01 | Colorectum | colon adenocarcinoma | Female | >=65 | I/II | Unknown | Unknown | SD | ||
| AAMP | SNV | Missense_Mutation | novel | c.1172G>A | p.Gly391Asp | p.G391D | protein_coding | deleterious(0) | probably_damaging(0.991) | TCGA-G4-6304-01 | Colorectum | colon adenocarcinoma | Female | >=65 | I/II | Chemotherapy | fluorouracil | PD | |
| AAMP | SNV | Missense_Mutation | novel | c.1273G>T | p.Ala425Ser | p.A425S | protein_coding | tolerated(0.14) | possibly_damaging(0.82) | TCGA-A5-A1OF-01 | Endometrium | uterine corpus endometrioid carcinoma | Female | <65 | I/II | Unknown | Unknown | SD | |
| AAMP | SNV | Missense_Mutation | novel | c.1163N>A | p.Ala388Asp | p.A388D | protein_coding | deleterious(0) | benign(0.157) | TCGA-AJ-A2QO-01 | Endometrium | uterine corpus endometrioid carcinoma | Female | >=65 | I/II | Unknown | Unknown | SD | |
| AAMP | SNV | Missense_Mutation | c.889N>T | p.Gly297Cys | p.G297C | protein_coding | tolerated(0.29) | benign(0.001) | TCGA-AP-A051-01 | Endometrium | uterine corpus endometrioid carcinoma | Female | >=65 | I/II | Unknown | Unknown | SD |
| Page: 1 2 3 |
Top |
Related drugs of malignant transformation related genes |
| Identification of chemicals and drugs interact with genes involved in malignant transfromation |
| (DGIdb 4.0) |
| Entrez ID | Symbol | Category | Interaction Types | Drug Claim Name | Drug Name | PMIDs |
| Page: 1 |

Copyright 2023-Present -The University of Texas Health Science Center at Houston |