
|
|||||
|
 | |
| |
| |
| |
| |
| |
|
Gene: AAMDC |
Gene summary for AAMDC |
| Gene information | Species | Human | Gene symbol | AAMDC | Gene ID | 28971 |
| Gene name | adipogenesis associated Mth938 domain containing | |
| Gene Alias | C11orf67 | |
| Cytomap | 11q14.1 | |
| Gene Type | protein-coding | GO ID | GO:0008150 | UniProtAcc | K4DI89 |
Top |
Malignant transformation analysis |
| Identification of the aberrant gene expression in precancerous and cancerous lesions by comparing the gene expression of stem-like cells in diseased tissues with normal stem cells |
| Entrez ID | Symbol | Replicates | Species | Organ | Tissue | Adj P-value | Log2FC | Malignancy |
| 28971 | AAMDC | GSM4909281 | Human | Breast | IDC | 1.02e-11 | 3.83e-01 | 0.21 |
| 28971 | AAMDC | GSM4909286 | Human | Breast | IDC | 1.18e-15 | 3.10e-01 | 0.1081 |
| 28971 | AAMDC | GSM4909290 | Human | Breast | IDC | 1.05e-09 | 4.12e-01 | 0.2096 |
| 28971 | AAMDC | GSM4909294 | Human | Breast | IDC | 2.26e-03 | 3.62e-01 | 0.2022 |
| 28971 | AAMDC | GSM4909297 | Human | Breast | IDC | 2.24e-09 | 3.39e-01 | 0.1517 |
| 28971 | AAMDC | GSM4909298 | Human | Breast | IDC | 3.17e-108 | 1.40e+00 | 0.1551 |
| 28971 | AAMDC | GSM4909301 | Human | Breast | IDC | 3.20e-05 | 3.52e-01 | 0.1577 |
| 28971 | AAMDC | GSM4909304 | Human | Breast | IDC | 4.15e-09 | 2.59e-01 | 0.1636 |
| 28971 | AAMDC | GSM4909307 | Human | Breast | IDC | 8.73e-06 | 3.40e-01 | 0.1569 |
| 28971 | AAMDC | GSM4909308 | Human | Breast | IDC | 2.40e-24 | 5.61e-01 | 0.158 |
| 28971 | AAMDC | GSM4909311 | Human | Breast | IDC | 5.75e-05 | -1.75e-02 | 0.1534 |
| 28971 | AAMDC | GSM4909312 | Human | Breast | IDC | 1.99e-02 | 1.55e-01 | 0.1552 |
| 28971 | AAMDC | GSM4909319 | Human | Breast | IDC | 6.93e-12 | -5.95e-02 | 0.1563 |
| 28971 | AAMDC | brca2 | Human | Breast | Precancer | 3.84e-04 | 9.54e-02 | -0.024 |
| 28971 | AAMDC | M5 | Human | Breast | IDC | 1.50e-06 | 6.90e-01 | 0.1598 |
| 28971 | AAMDC | P3 | Human | Breast | IDC | 2.94e-14 | 8.82e-01 | 0.1542 |
| 28971 | AAMDC | DCIS2 | Human | Breast | DCIS | 8.04e-53 | 1.43e-01 | 0.0085 |
| 28971 | AAMDC | LZE4T | Human | Esophagus | ESCC | 1.07e-03 | 5.36e-02 | 0.0811 |
| 28971 | AAMDC | LZE5T | Human | Esophagus | ESCC | 1.80e-03 | 1.77e-01 | 0.0514 |
| 28971 | AAMDC | LZE8T | Human | Esophagus | ESCC | 1.65e-05 | 1.27e-01 | 0.067 |
| Page: 1 2 3 4 5 6 7 |
| Tissue | Expression Dynamics | Abbreviation |
| Breast |  | IDC: Invasive ductal carcinoma |
| DCIS: Ductal carcinoma in situ | ||
| Precancer(BRCA1-mut): Precancerous lesion from BRCA1 mutation carriers | ||
| Esophagus | 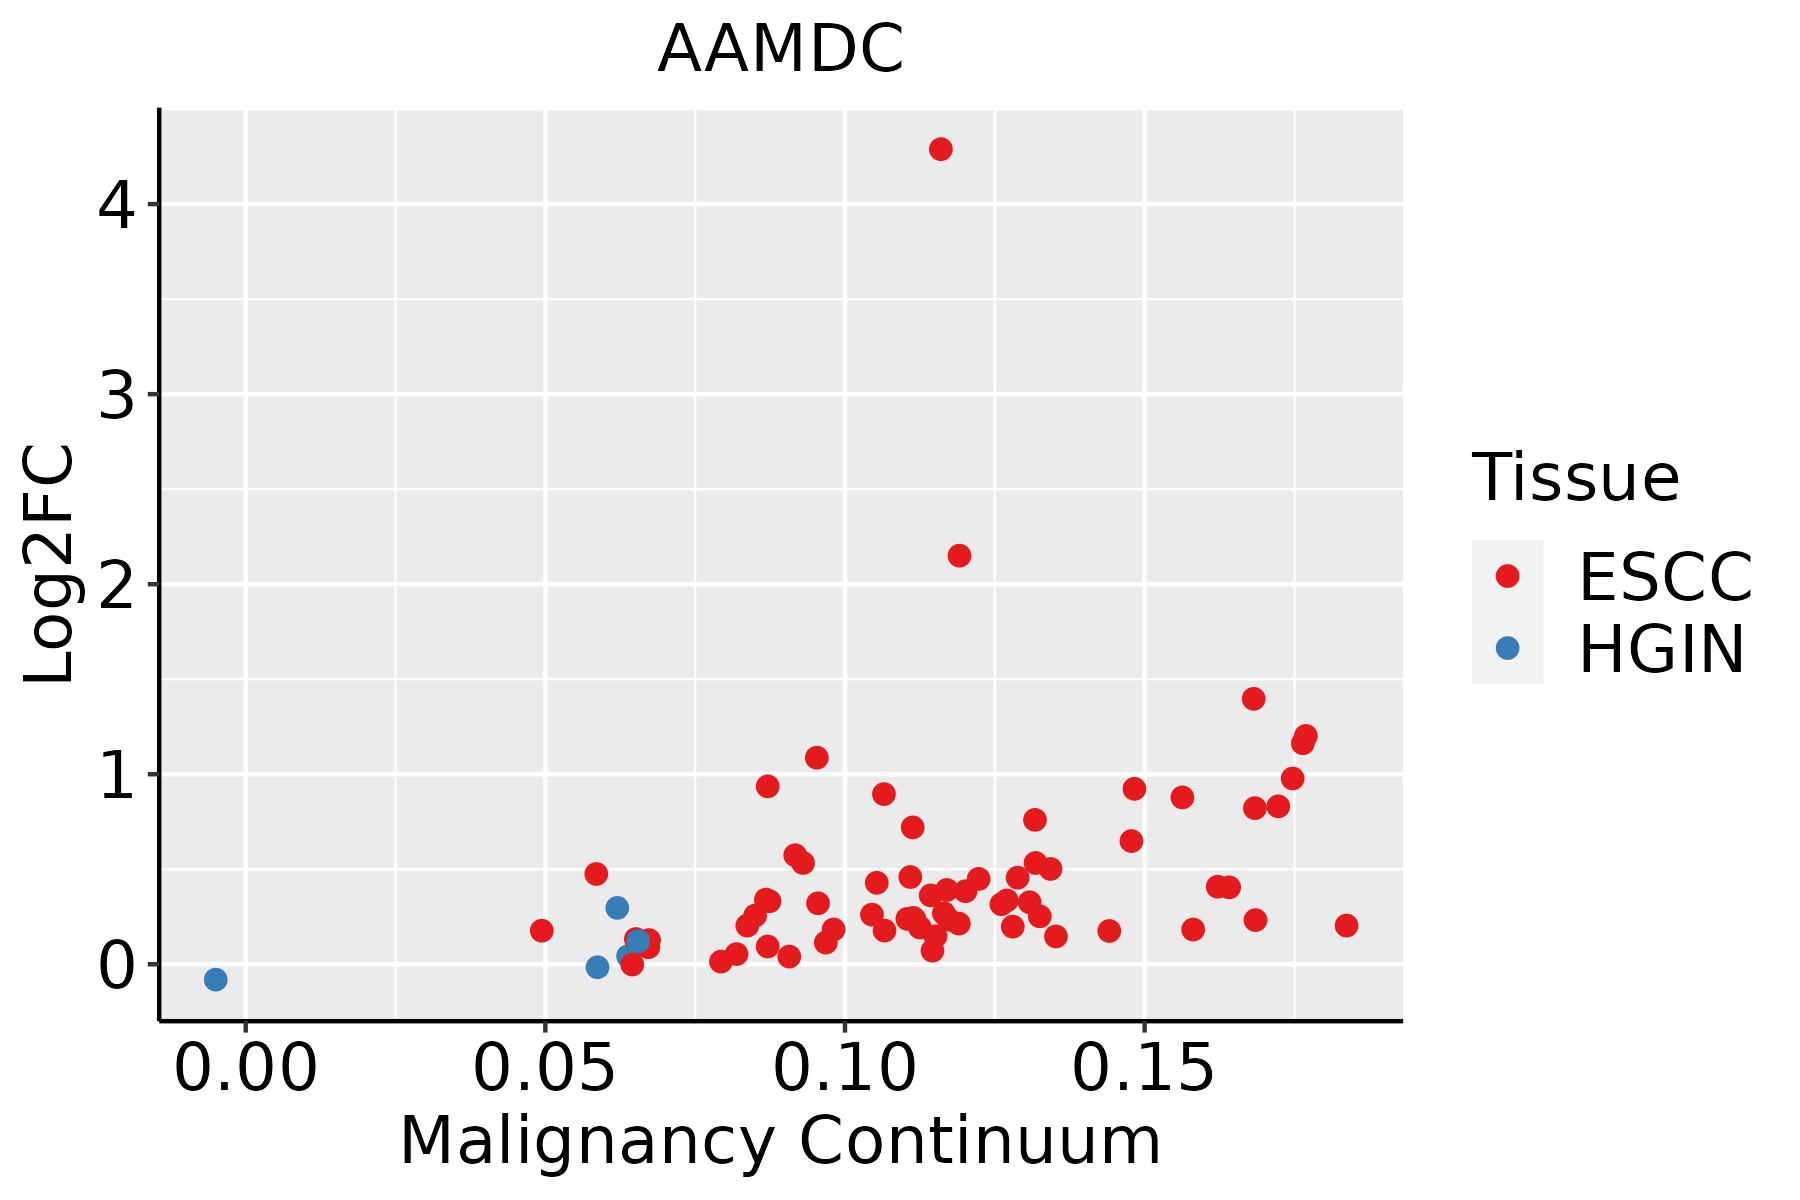 | ESCC: Esophageal squamous cell carcinoma |
| HGIN: High-grade intraepithelial neoplasias | ||
| LGIN: Low-grade intraepithelial neoplasias | ||
| Liver |  | HCC: Hepatocellular carcinoma |
| NAFLD: Non-alcoholic fatty liver disease | ||
| Oral Cavity | 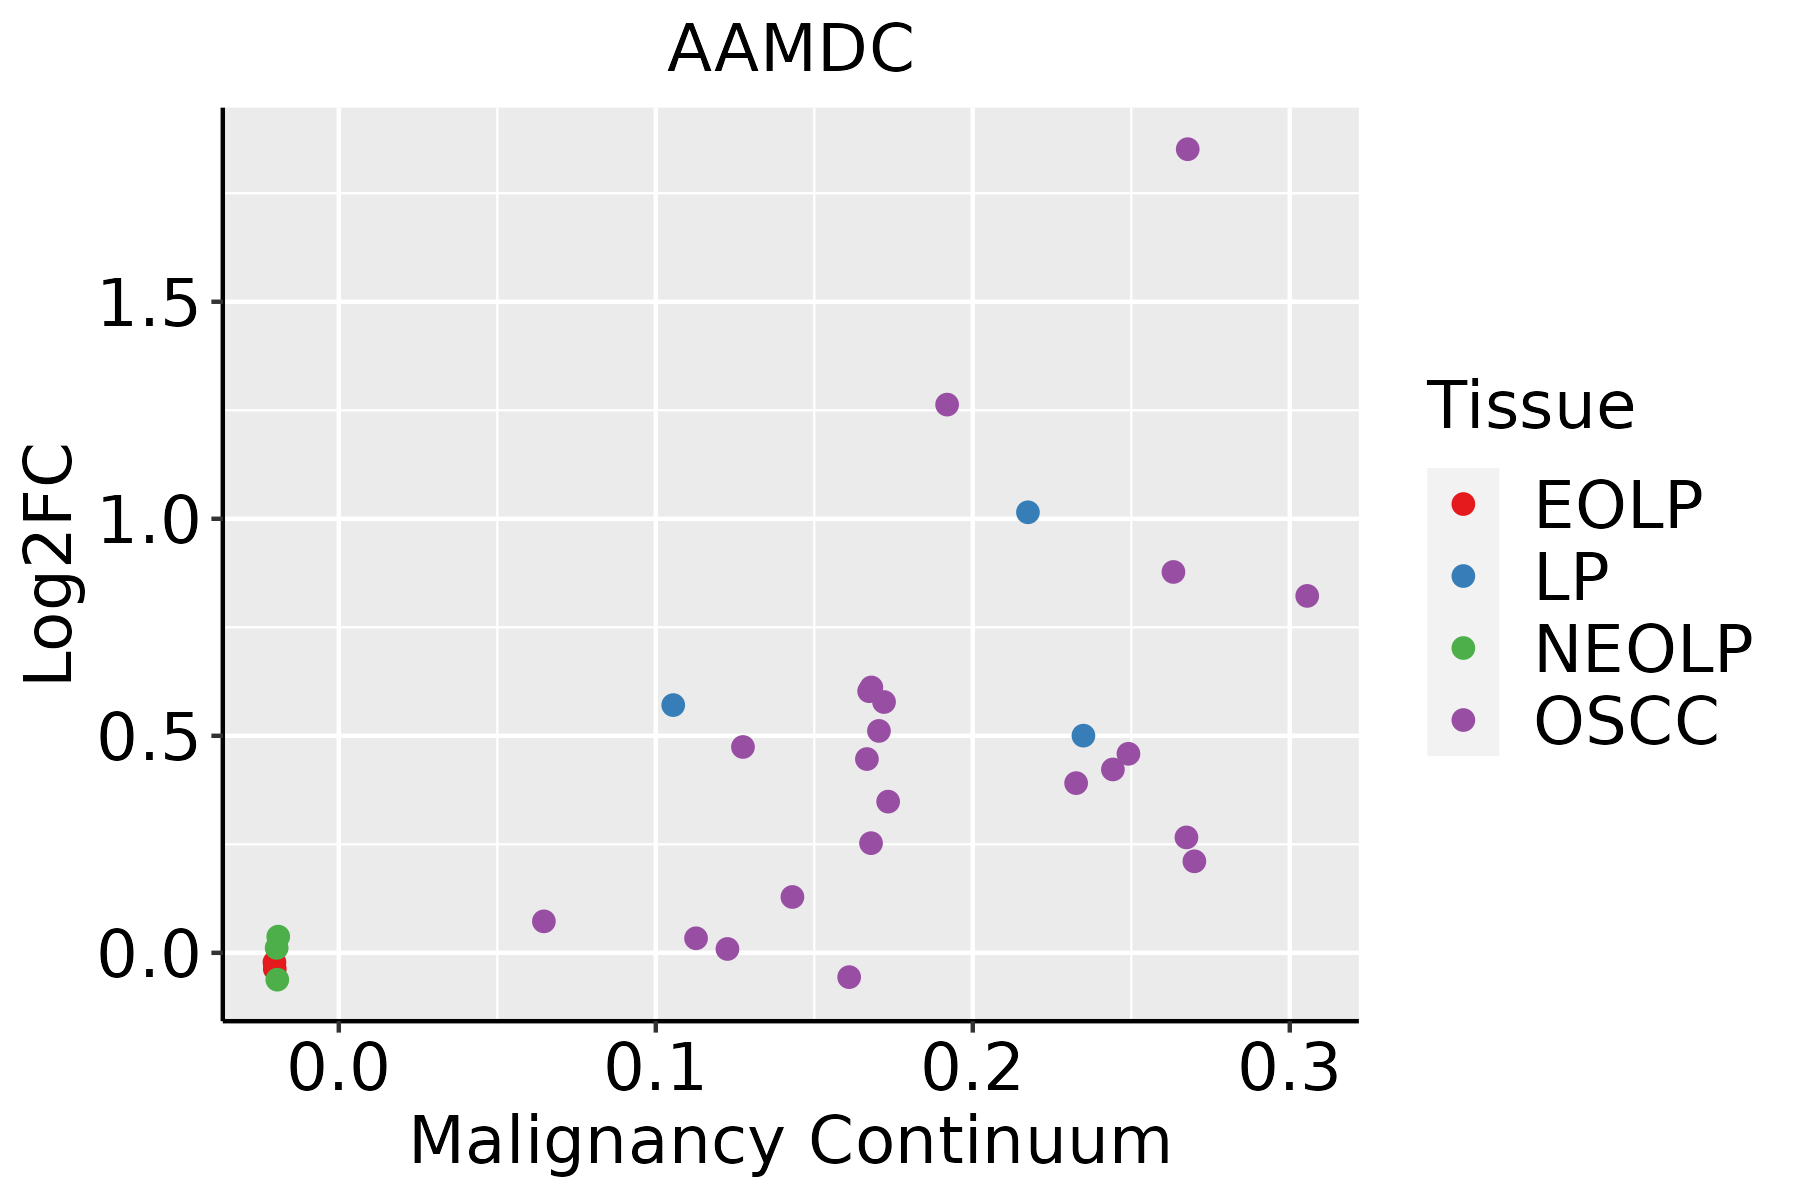 | EOLP: Erosive Oral lichen planus |
| LP: leukoplakia | ||
| NEOLP: Non-erosive oral lichen planus | ||
| OSCC: Oral squamous cell carcinoma | ||
| Skin |  | AK: Actinic keratosis |
| cSCC: Cutaneous squamous cell carcinoma | ||
| SCCIS:squamous cell carcinoma in situ | ||
| Thyroid |  | ATC: Anaplastic thyroid cancer |
| HT: Hashimoto's thyroiditis | ||
| PTC: Papillary thyroid cancer |
| ∗log2FC in expression of this searched gene in stem-like cells from each diseased tissue sample relative to stem-like cells in normal samples in each tissue plotted against the malignancy continuum. Samples are colored based on if they are from different disease stage. |
Top |
Malignant transformation related pathway analysis |
| Find out the enriched GO biological processes and KEGG pathways involved in transition from healthy to precancer to cancer |
| Tissue | Disease Stage | Enriched GO biological Processes |
| Colorectum | AD |  |
| Colorectum | SER |  |
| Colorectum | MSS |  |
| Colorectum | MSI-H |  |
| Colorectum | FAP |  |
| ∗Top 15 enriched GO BP terms are showed in the bar plot of each disease state in each tissue. Each row represents a significant GO biological process which is colored according to the -log10(p.adjust). |
| Page: 1 2 3 4 5 6 7 8 9 |
| GO ID | Tissue | Disease Stage | Description | Gene Ratio | Bg Ratio | pvalue | p.adjust | Count |
| GO:00454444 | Breast | Precancer | fat cell differentiation | 26/1080 | 229/18723 | 7.60e-04 | 9.04e-03 | 26 |
| GO:00456003 | Breast | Precancer | positive regulation of fat cell differentiation | 10/1080 | 66/18723 | 4.34e-03 | 3.39e-02 | 10 |
| GO:004544412 | Breast | IDC | fat cell differentiation | 30/1434 | 229/18723 | 2.72e-03 | 2.41e-02 | 30 |
| GO:004560011 | Breast | IDC | positive regulation of fat cell differentiation | 12/1434 | 66/18723 | 3.99e-03 | 3.23e-02 | 12 |
| GO:004544421 | Breast | DCIS | fat cell differentiation | 30/1390 | 229/18723 | 1.70e-03 | 1.68e-02 | 30 |
| GO:004560021 | Breast | DCIS | positive regulation of fat cell differentiation | 12/1390 | 66/18723 | 3.10e-03 | 2.63e-02 | 12 |
| GO:00454449 | Esophagus | ESCC | fat cell differentiation | 135/8552 | 229/18723 | 3.38e-05 | 2.78e-04 | 135 |
| GO:00456007 | Esophagus | ESCC | positive regulation of fat cell differentiation | 46/8552 | 66/18723 | 6.72e-05 | 5.11e-04 | 46 |
| GO:00455984 | Esophagus | ESCC | regulation of fat cell differentiation | 79/8552 | 139/18723 | 5.23e-03 | 1.97e-02 | 79 |
| GO:00454442 | Liver | Cirrhotic | fat cell differentiation | 73/4634 | 229/18723 | 8.57e-03 | 3.97e-02 | 73 |
| GO:00454441 | Liver | HCC | fat cell differentiation | 120/7958 | 229/18723 | 1.52e-03 | 8.05e-03 | 120 |
| GO:00454448 | Oral cavity | OSCC | fat cell differentiation | 120/7305 | 229/18723 | 2.48e-05 | 2.32e-04 | 120 |
| GO:00455983 | Oral cavity | OSCC | regulation of fat cell differentiation | 77/7305 | 139/18723 | 6.36e-05 | 5.18e-04 | 77 |
| GO:00456006 | Oral cavity | OSCC | positive regulation of fat cell differentiation | 41/7305 | 66/18723 | 1.20e-04 | 8.60e-04 | 41 |
| GO:004544417 | Thyroid | HT | fat cell differentiation | 29/1272 | 229/18723 | 8.88e-04 | 9.30e-03 | 29 |
| GO:00455986 | Thyroid | HT | regulation of fat cell differentiation | 20/1272 | 139/18723 | 1.14e-03 | 1.14e-02 | 20 |
| GO:00456009 | Thyroid | HT | positive regulation of fat cell differentiation | 12/1272 | 66/18723 | 1.47e-03 | 1.37e-02 | 12 |
| GO:004544418 | Thyroid | PTC | fat cell differentiation | 102/5968 | 229/18723 | 3.66e-05 | 3.40e-04 | 102 |
| GO:004560015 | Thyroid | PTC | positive regulation of fat cell differentiation | 33/5968 | 66/18723 | 1.63e-03 | 9.01e-03 | 33 |
| GO:004559814 | Thyroid | PTC | regulation of fat cell differentiation | 59/5968 | 139/18723 | 5.50e-03 | 2.50e-02 | 59 |
| Page: 1 2 |
| Pathway ID | Tissue | Disease Stage | Description | Gene Ratio | Bg Ratio | pvalue | p.adjust | qvalue | Count |
| Page: 1 |
Top |
Cell-cell communication analysis |
| Identification of potential cell-cell interactions between two cell types and their ligand-receptor pairs for different disease states |
| Ligand | Receptor | LRpair | Pathway | Tissue | Disease Stage |
| Page: 1 |
Top |
Single-cell gene regulatory network inference analysis |
| Find out the significant the regulons (TFs) and the target genes of each regulon across cell types for different disease states |
| TF | Cell Type | Tissue | Disease Stage | Target Gene | RSS | Regulon Activity |
| ∗The dot plots of a searched regulon are shown for all cell subpopulations in each disease state of each tissue based on the regulon specific score inferred using pySCENIC and by calculating the average expression. |
| Page: 1 |
Top |
Somatic mutation of malignant transformation related genes |
| Annotation of somatic variants for genes involved in malignant transformation |
| Hugo Symbol | Variant Class | Variant Classification | dbSNP RS | HGVSc | HGVSp | HGVSp Short | SWISSPROT | BIOTYPE | SIFT | PolyPhen | Tumor Sample Barcode | Tissue | Histology | Sex | Age | Stage | Therapy Types | Drugs | Outcome |
| AAMDC | insertion | Frame_Shift_Ins | novel | c.217_218insCAGCATTAACTCAAAAGTCCACAGTTCAAAGTCCTATCTG | p.Glu73AlafsTer14 | p.E73Afs*14 | protein_coding | TCGA-A8-A09C-01 | Breast | breast invasive carcinoma | Female | >=65 | I/II | Unknown | Unknown | SD | |||
| AAMDC | SNV | Missense_Mutation | novel | c.101G>A | p.Arg34Gln | p.R34Q | protein_coding | tolerated_low_confidence(0.07) | benign(0.23) | TCGA-EA-A410-01 | Cervix | cervical & endocervical cancer | Female | <65 | I/II | Unknown | Unknown | SD | |
| AAMDC | SNV | Missense_Mutation | novel | c.371N>A | p.Ser124Asn | p.S124N | protein_coding | benign(0.003) | TCGA-AX-A1CE-01 | Endometrium | uterine corpus endometrioid carcinoma | Female | <65 | I/II | Unspecific | Paclitaxel | SD | ||
| AAMDC | SNV | Missense_Mutation | novel | c.415N>A | p.Leu139Ile | p.L139I | protein_coding | benign(0.094) | TCGA-AX-A2HC-01 | Endometrium | uterine corpus endometrioid carcinoma | Female | <65 | III/IV | Chemotherapy | paclitaxel | PD | ||
| AAMDC | SNV | Missense_Mutation | c.189N>T | p.Gln63His | p.Q63H | protein_coding | deleterious_low_confidence(0.01) | benign(0.04) | TCGA-B5-A11E-01 | Endometrium | uterine corpus endometrioid carcinoma | Female | <65 | I/II | Unknown | Unknown | SD | ||
| AAMDC | SNV | Missense_Mutation | c.58A>G | p.Asn20Asp | p.N20D | protein_coding | tolerated_low_confidence(0.24) | benign(0.029) | TCGA-D1-A103-01 | Endometrium | uterine corpus endometrioid carcinoma | Female | >=65 | I/II | Unknown | Unknown | SD | ||
| AAMDC | SNV | Missense_Mutation | rs546888173 | c.88N>T | p.Pro30Ser | p.P30S | protein_coding | deleterious_low_confidence(0) | probably_damaging(1) | TCGA-DI-A1BU-01 | Endometrium | uterine corpus endometrioid carcinoma | Female | <65 | I/II | Chemotherapy | paclitaxel | SD |
| Page: 1 |
Top |
Related drugs of malignant transformation related genes |
| Identification of chemicals and drugs interact with genes involved in malignant transfromation |
| (DGIdb 4.0) |
| Entrez ID | Symbol | Category | Interaction Types | Drug Claim Name | Drug Name | PMIDs |
| Page: 1 |

Copyright 2023-Present -The University of Texas Health Science Center at Houston |