| Tissue | Expression Dynamics | Abbreviation |
| Breast | 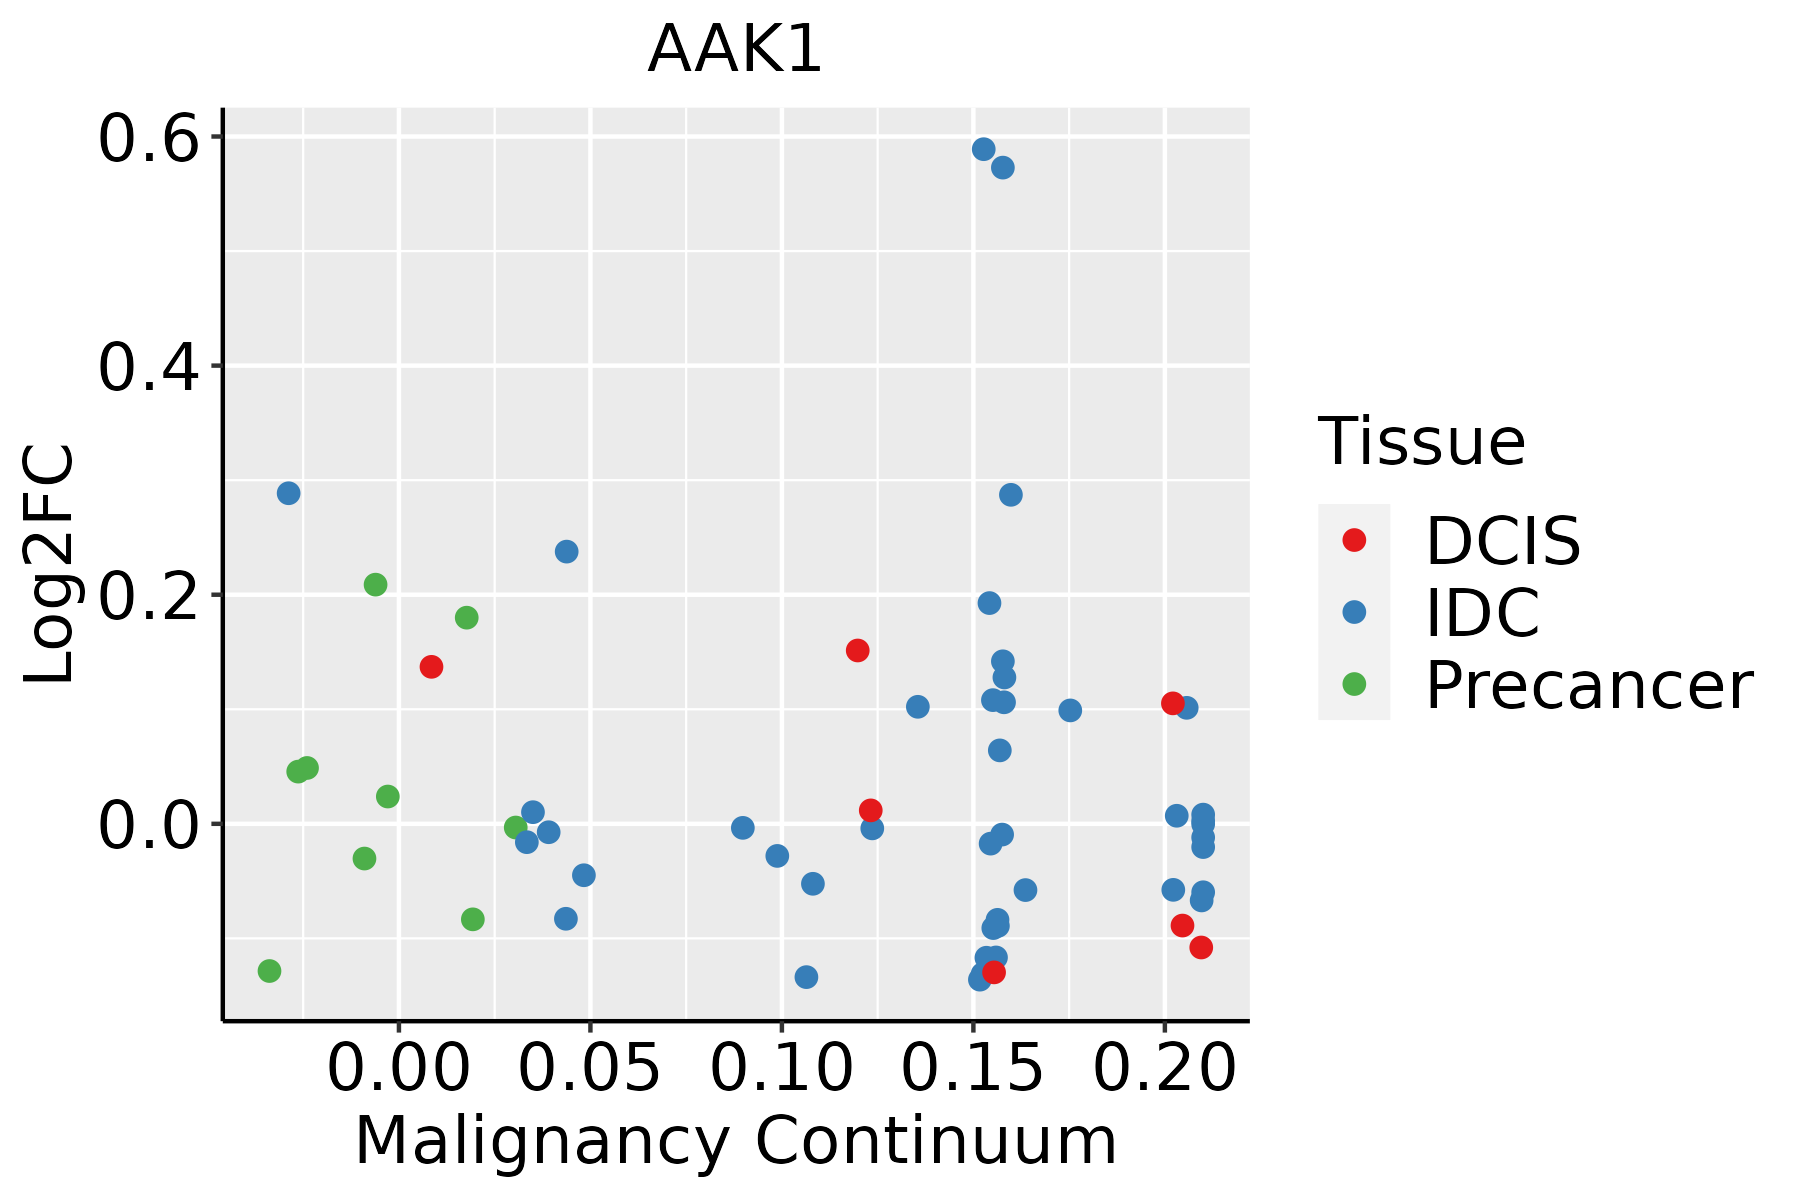 | IDC: Invasive ductal carcinoma |
| DCIS: Ductal carcinoma in situ |
| Precancer(BRCA1-mut): Precancerous lesion from BRCA1 mutation carriers |
| Colorectum (GSE201348) |  | FAP: Familial adenomatous polyposis |
| CRC: Colorectal cancer |
| Colorectum (HTA11) | 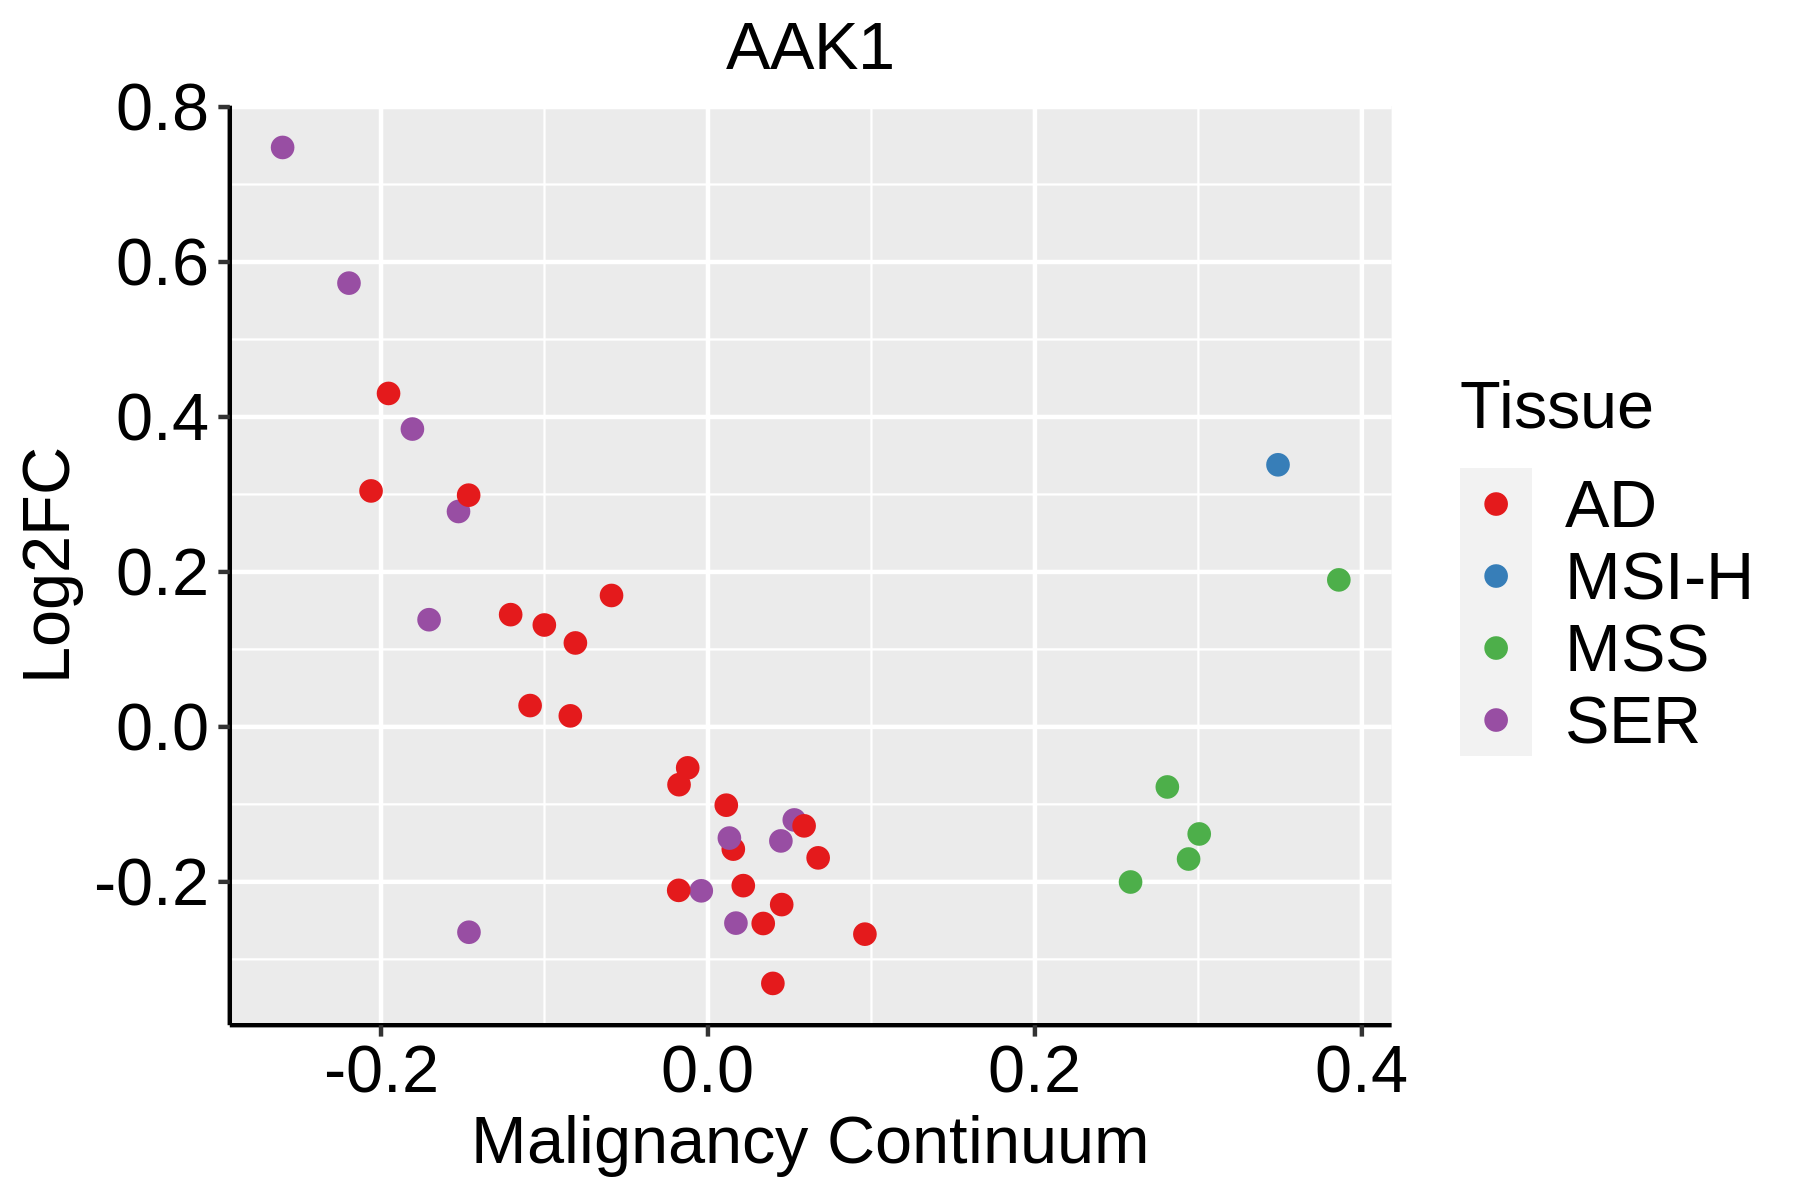 | AD: Adenomas |
| SER: Sessile serrated lesions |
| MSI-H: Microsatellite-high colorectal cancer |
| MSS: Microsatellite stable colorectal cancer |
| Esophagus | 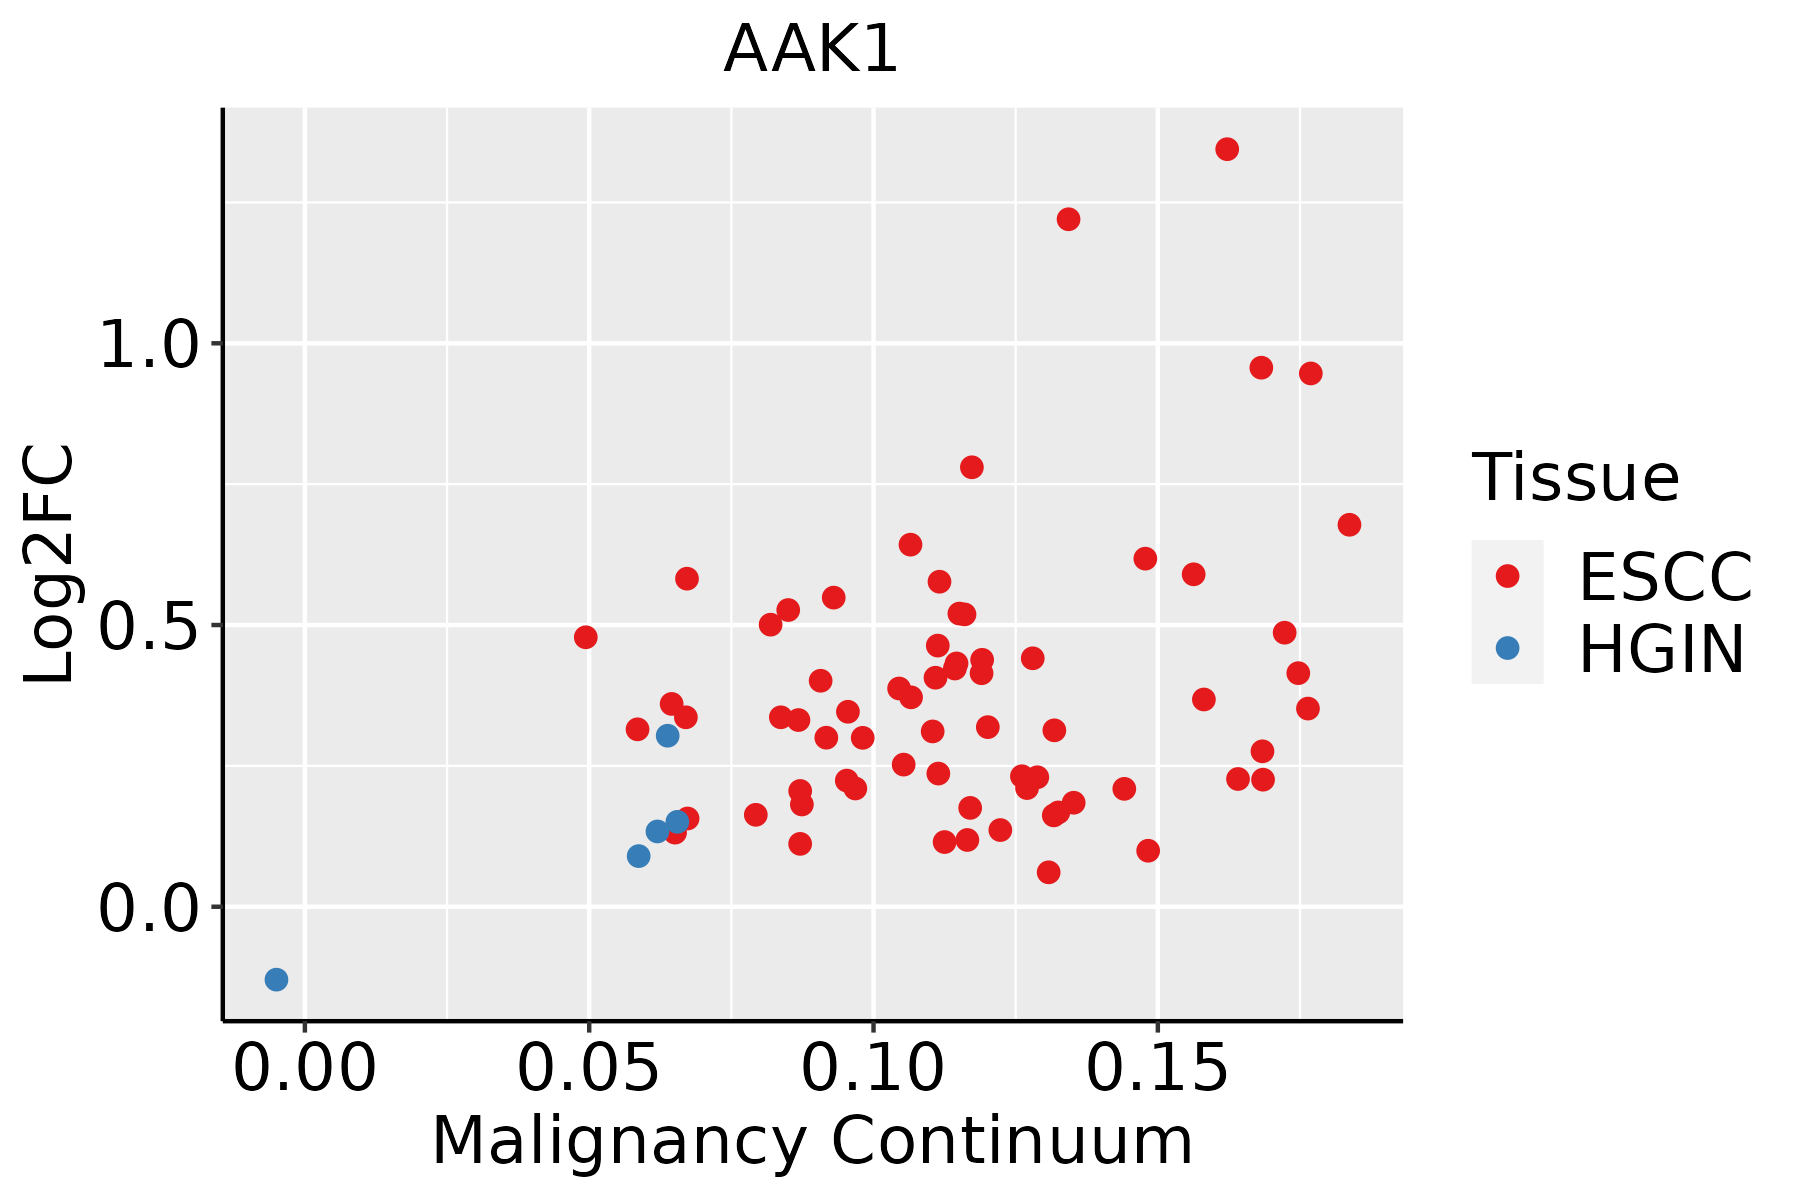 | ESCC: Esophageal squamous cell carcinoma |
| HGIN: High-grade intraepithelial neoplasias |
| LGIN: Low-grade intraepithelial neoplasias |
| Liver | 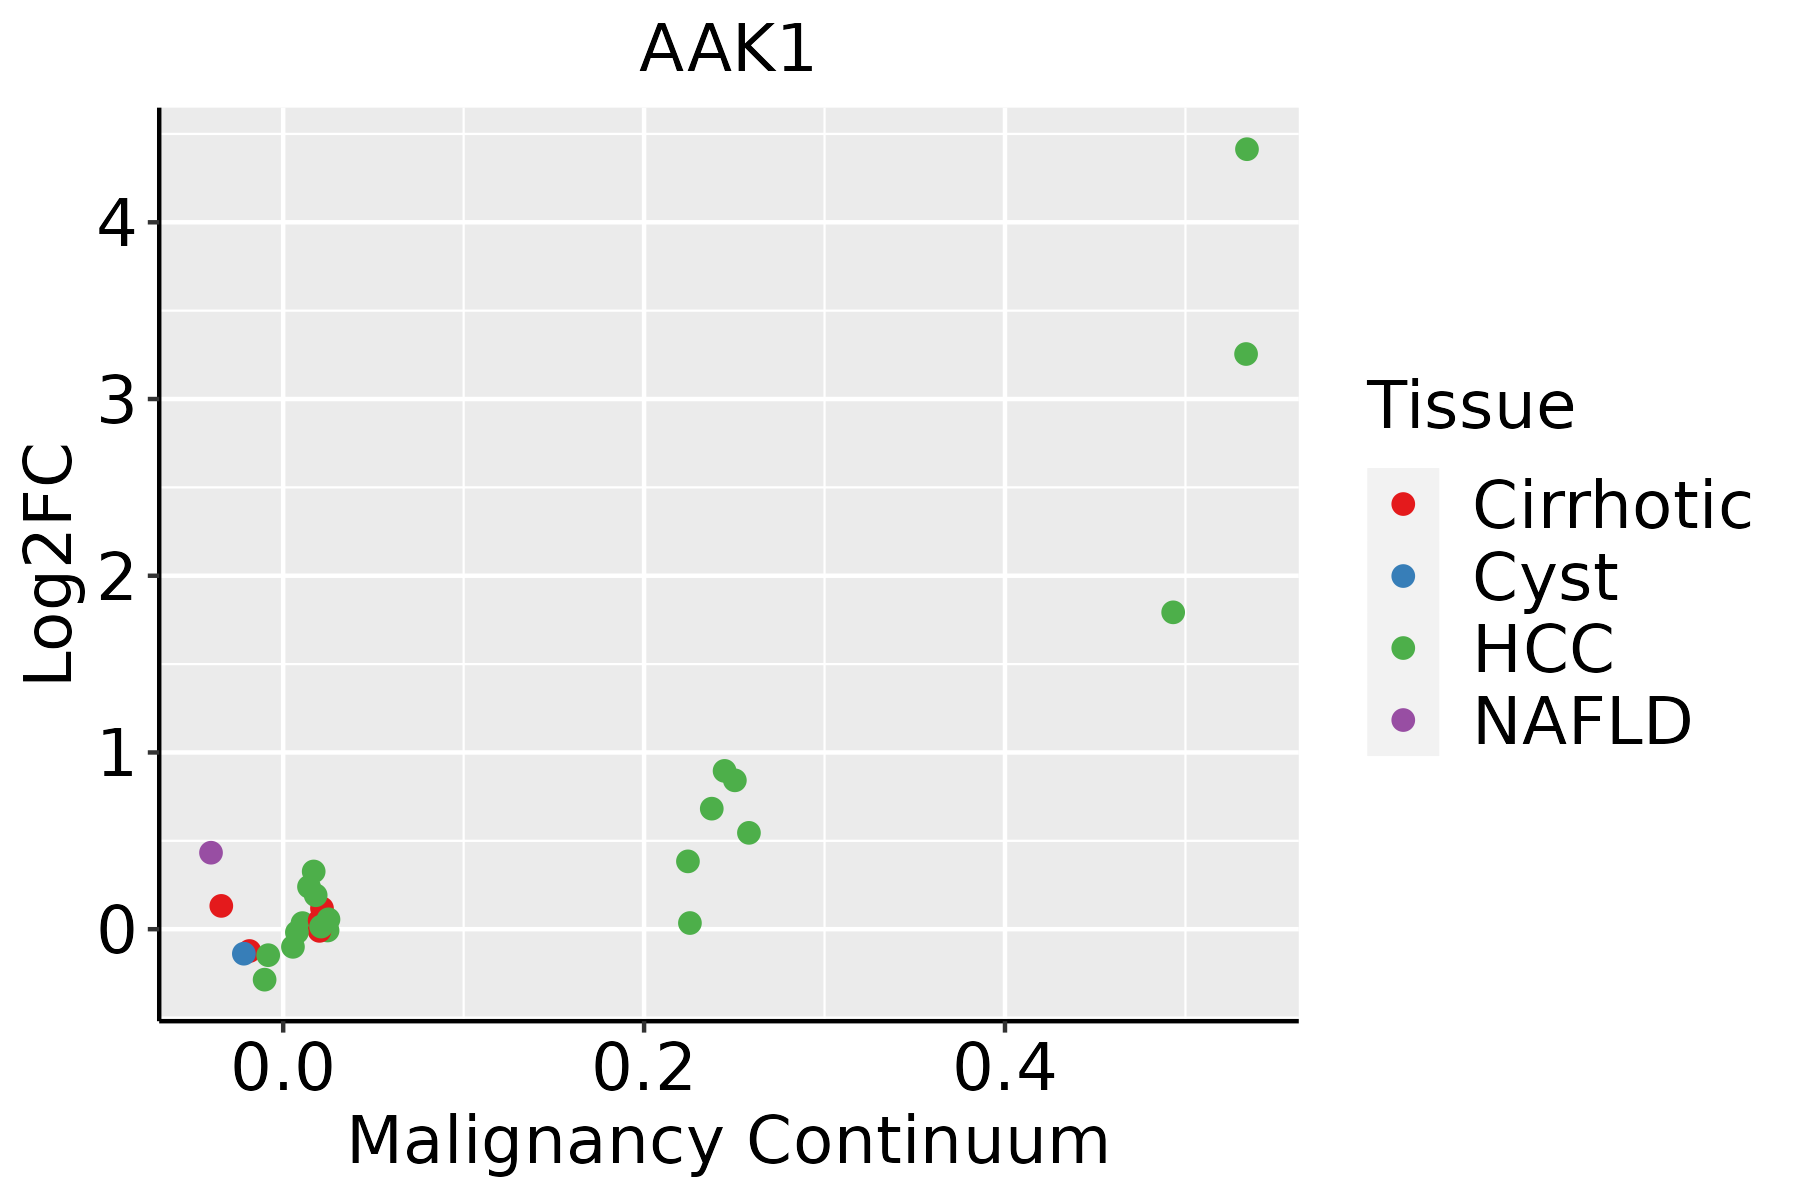 | HCC: Hepatocellular carcinoma |
| NAFLD: Non-alcoholic fatty liver disease |
| Lung |  | AAH: Atypical adenomatous hyperplasia |
| AIS: Adenocarcinoma in situ |
| IAC: Invasive lung adenocarcinoma |
| MIA: Minimally invasive adenocarcinoma |
| Oral Cavity |  | EOLP: Erosive Oral lichen planus |
| LP: leukoplakia |
| NEOLP: Non-erosive oral lichen planus |
| OSCC: Oral squamous cell carcinoma |
| Prostate | 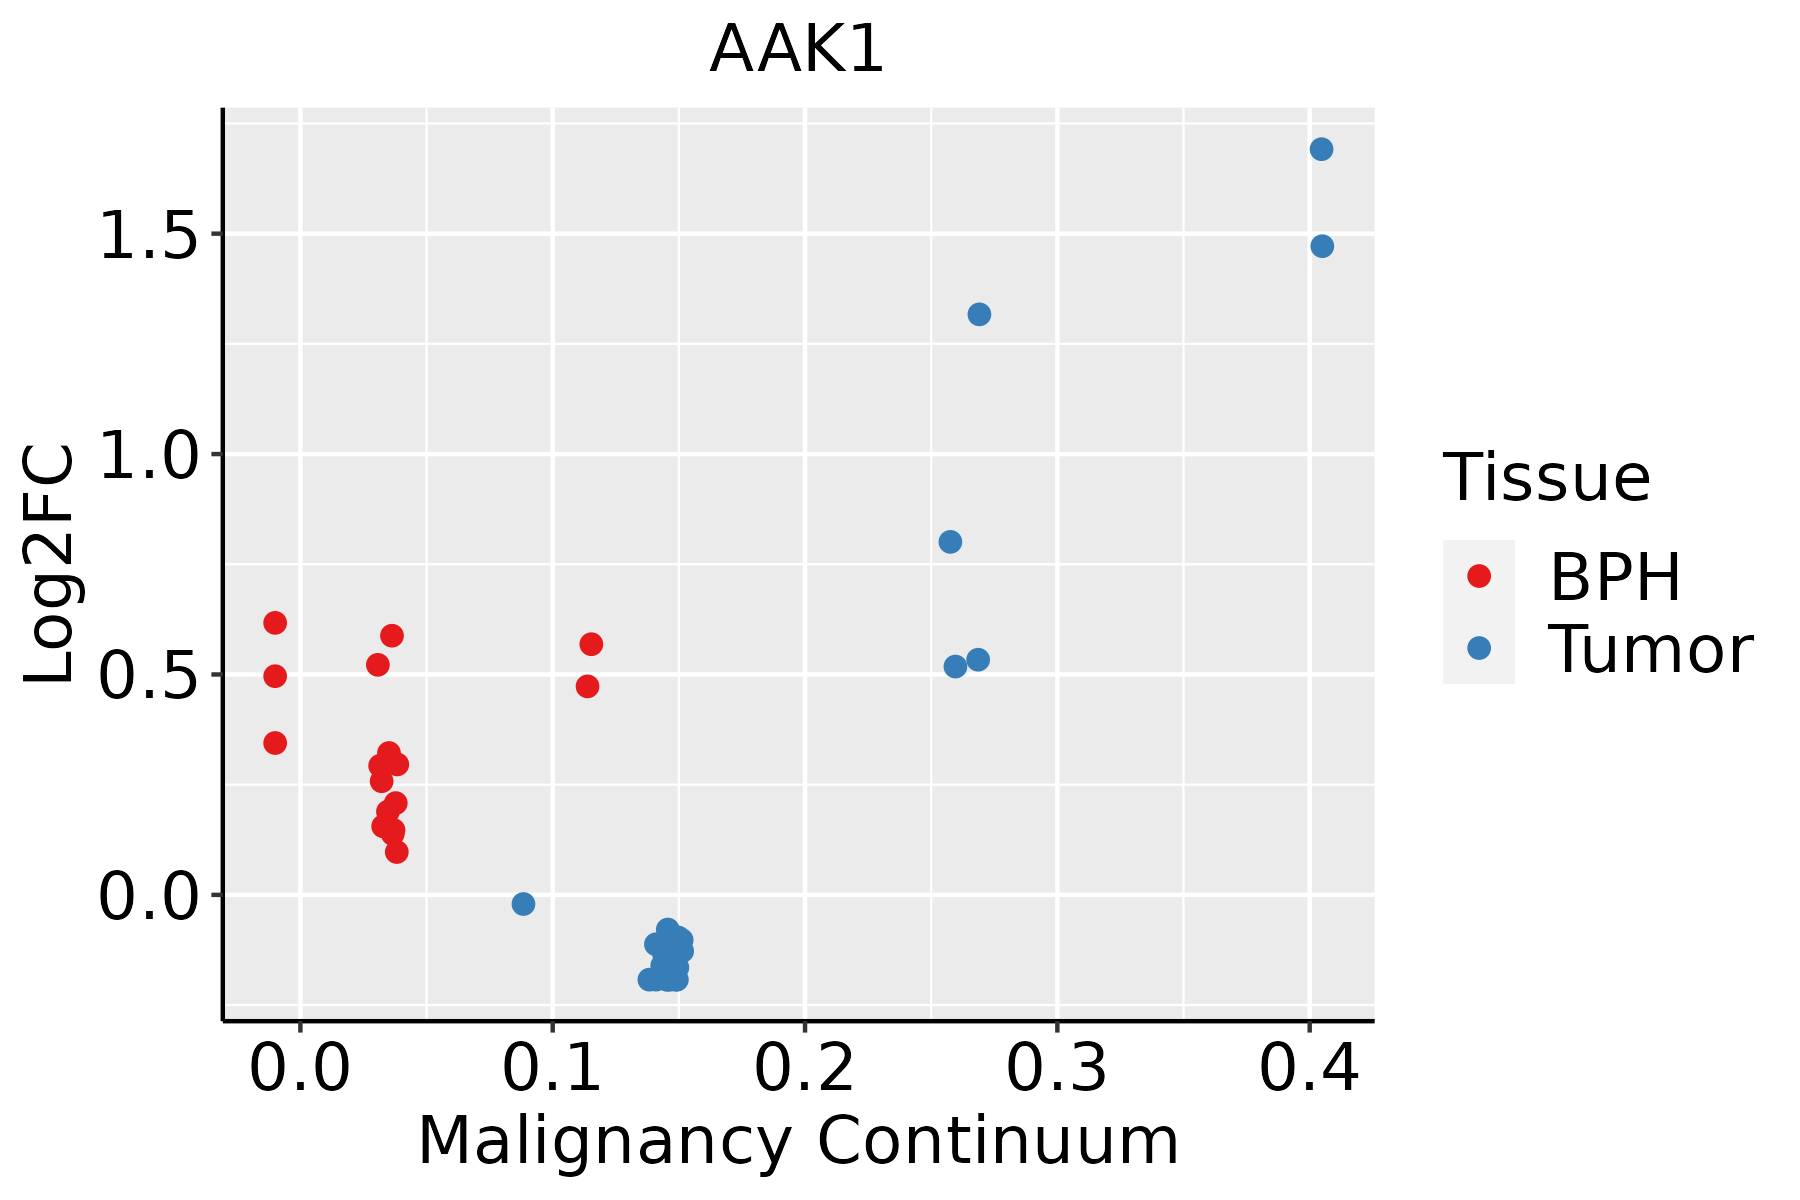 | BPH: Benign Prostatic Hyperplasia |
| Skin | 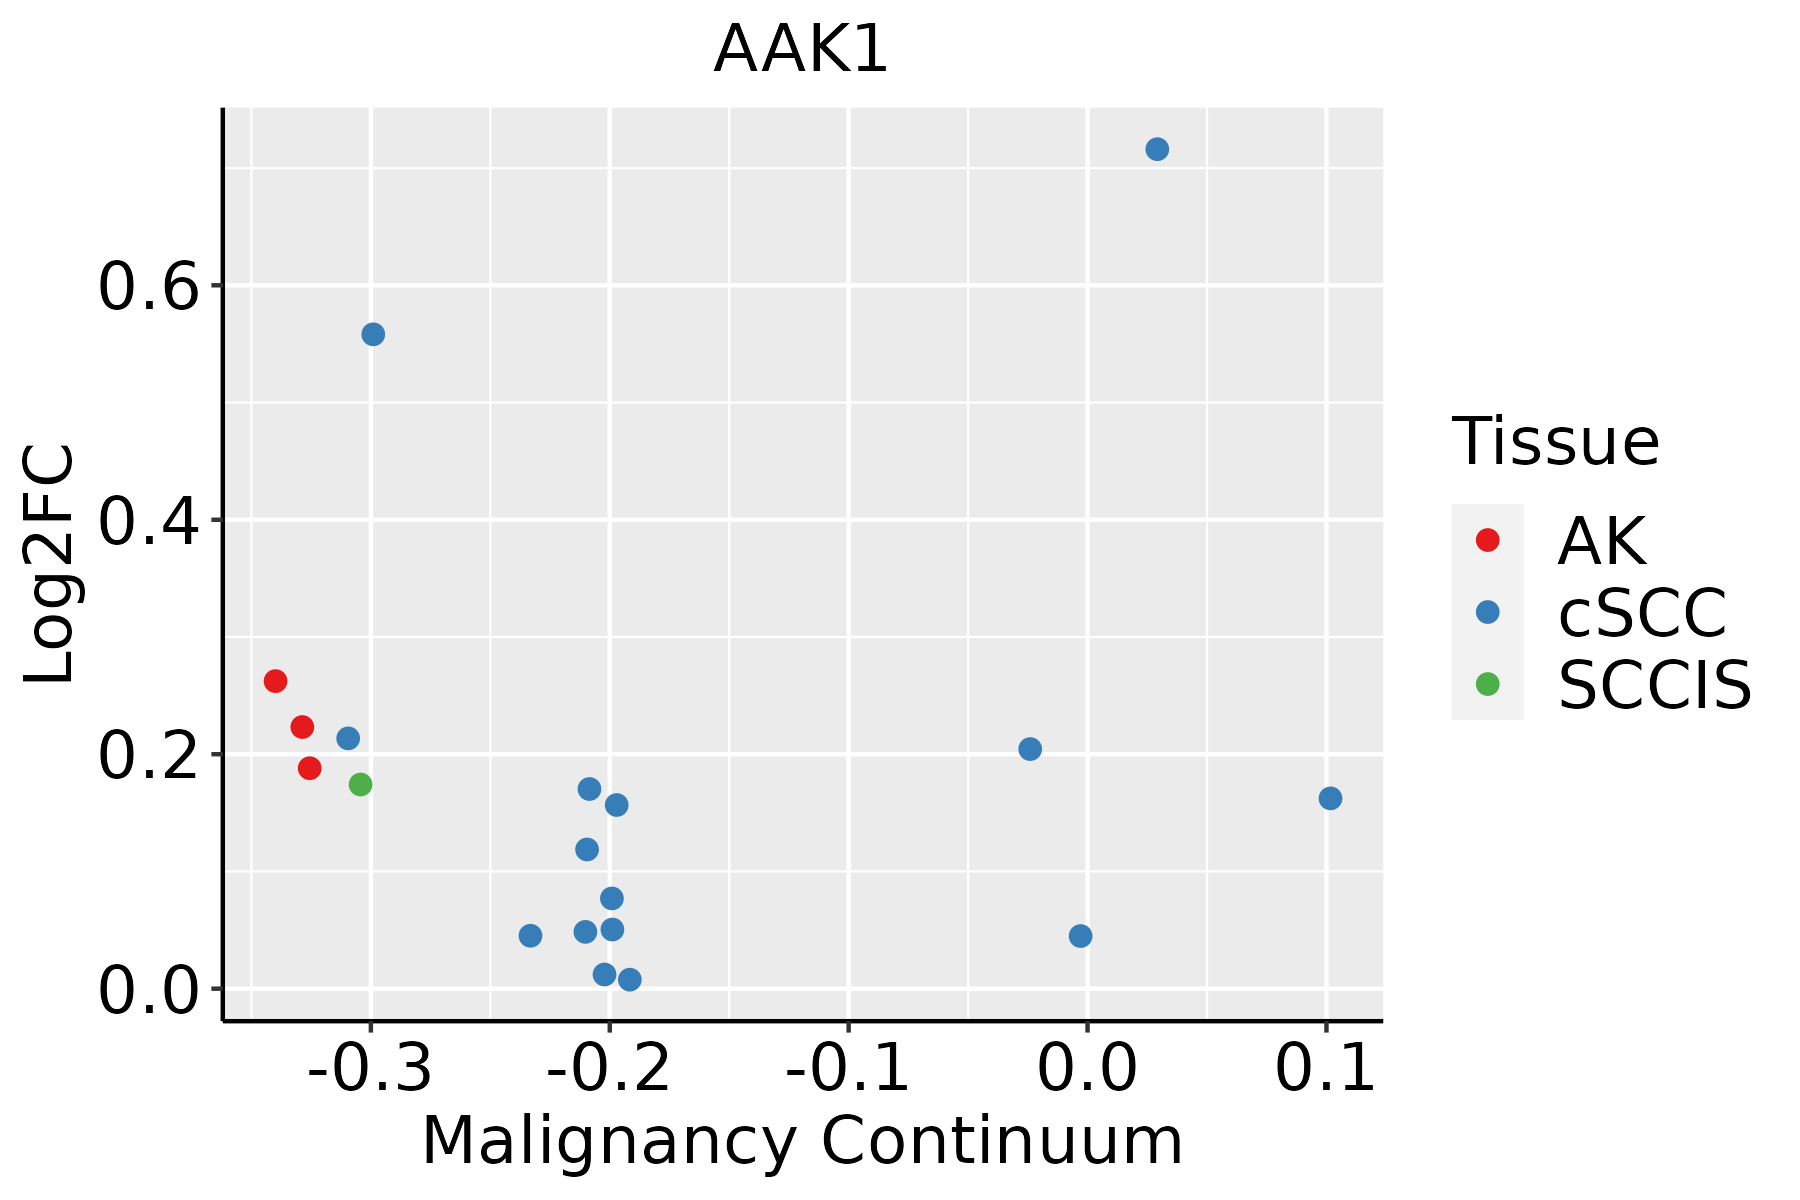 | AK: Actinic keratosis |
| cSCC: Cutaneous squamous cell carcinoma |
| SCCIS:squamous cell carcinoma in situ |
| Thyroid | 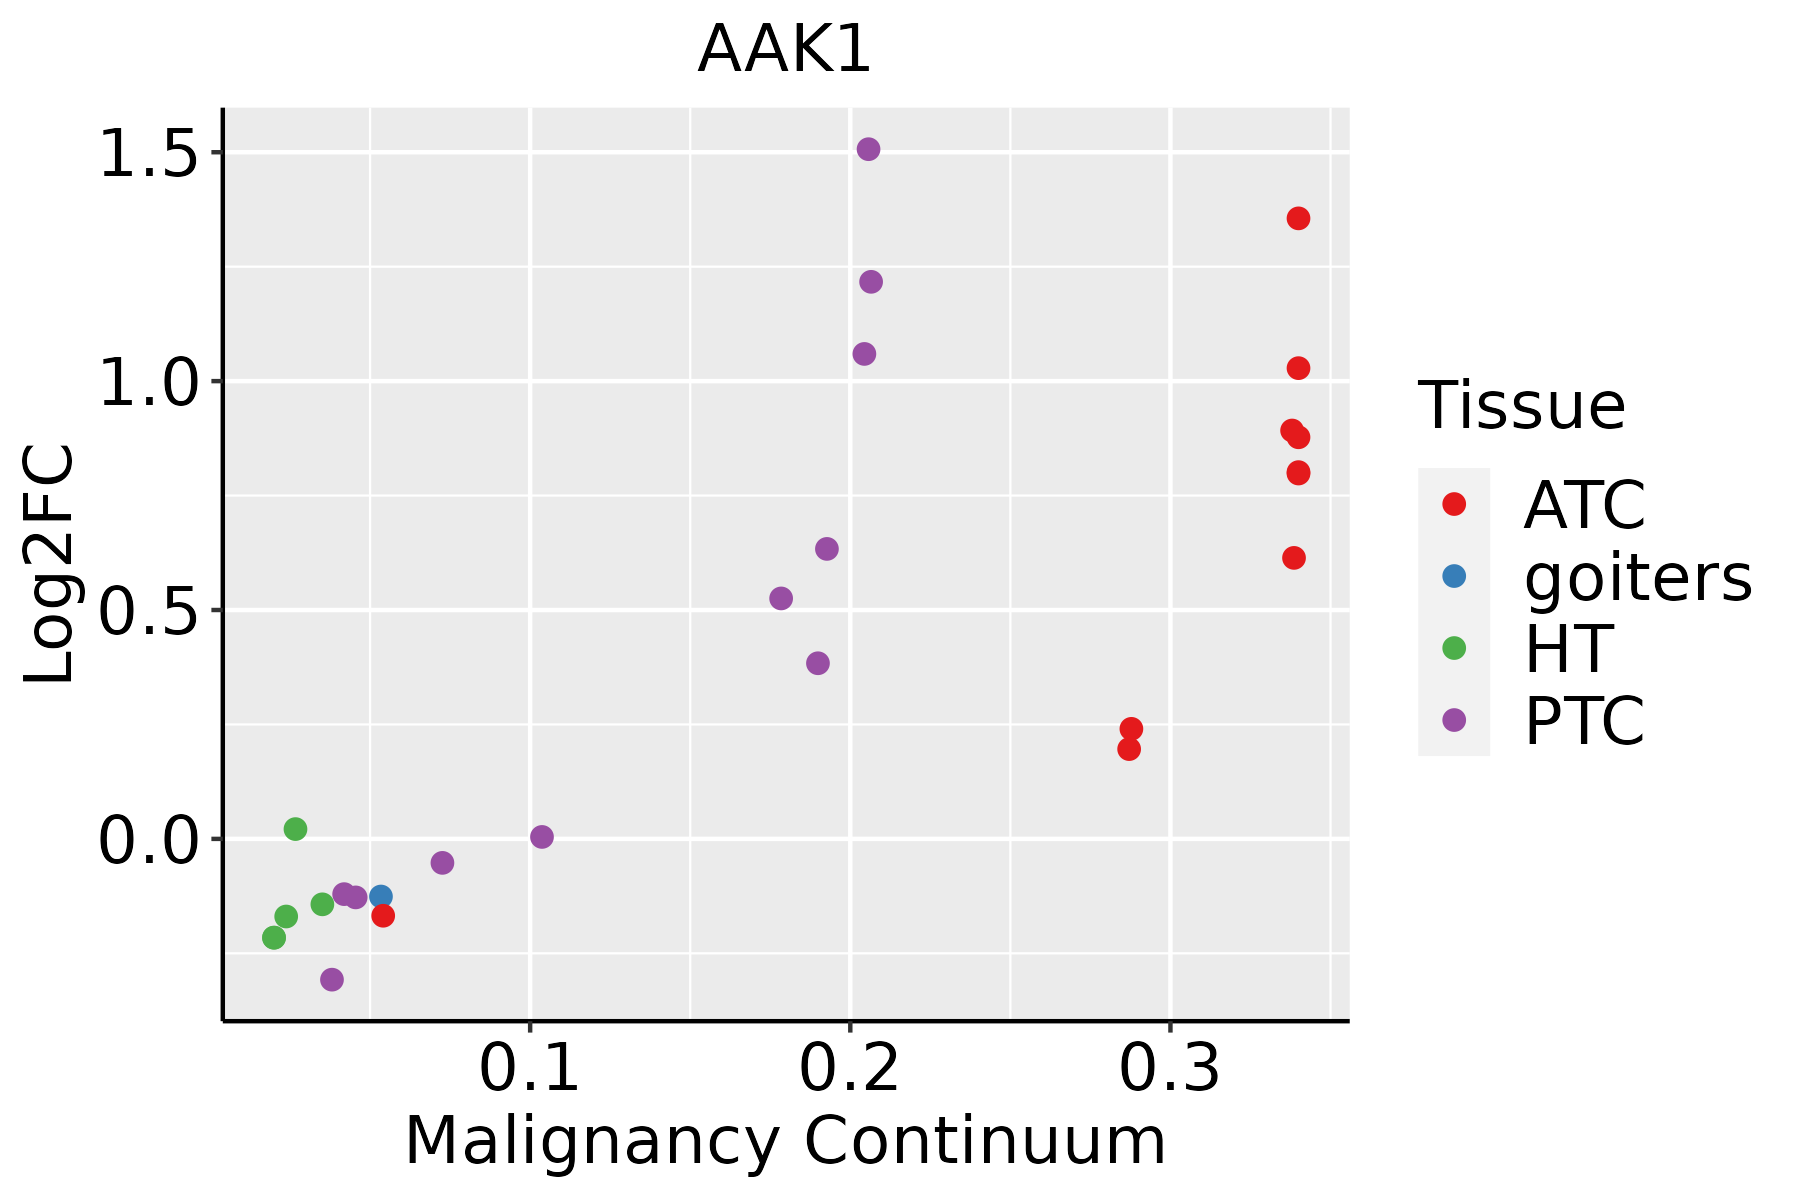 | ATC: Anaplastic thyroid cancer |
| HT: Hashimoto's thyroiditis |
| PTC: Papillary thyroid cancer |
| GO ID | Tissue | Disease Stage | Description | Gene Ratio | Bg Ratio | pvalue | p.adjust | Count |
| GO:003164714 | Breast | IDC | regulation of protein stability | 50/1434 | 298/18723 | 1.14e-07 | 6.57e-06 | 50 |
| GO:005082114 | Breast | IDC | protein stabilization | 35/1434 | 191/18723 | 1.12e-06 | 5.04e-05 | 35 |
| GO:000689813 | Breast | IDC | receptor-mediated endocytosis | 35/1434 | 244/18723 | 2.38e-04 | 3.75e-03 | 35 |
| GO:00301007 | Breast | IDC | regulation of endocytosis | 27/1434 | 211/18723 | 5.92e-03 | 4.26e-02 | 27 |
| GO:003164724 | Breast | DCIS | regulation of protein stability | 51/1390 | 298/18723 | 1.63e-08 | 1.15e-06 | 51 |
| GO:005082124 | Breast | DCIS | protein stabilization | 36/1390 | 191/18723 | 1.82e-07 | 9.14e-06 | 36 |
| GO:000689823 | Breast | DCIS | receptor-mediated endocytosis | 35/1390 | 244/18723 | 1.31e-04 | 2.25e-03 | 35 |
| GO:00482596 | Breast | DCIS | regulation of receptor-mediated endocytosis | 16/1390 | 110/18723 | 7.16e-03 | 4.85e-02 | 16 |
| GO:0031647 | Colorectum | AD | regulation of protein stability | 108/3918 | 298/18723 | 6.33e-10 | 5.08e-08 | 108 |
| GO:0050821 | Colorectum | AD | protein stabilization | 73/3918 | 191/18723 | 3.02e-08 | 1.64e-06 | 73 |
| GO:0072583 | Colorectum | AD | clathrin-dependent endocytosis | 24/3918 | 47/18723 | 4.60e-06 | 1.22e-04 | 24 |
| GO:0046777 | Colorectum | AD | protein autophosphorylation | 74/3918 | 227/18723 | 2.48e-05 | 4.76e-04 | 74 |
| GO:0006898 | Colorectum | AD | receptor-mediated endocytosis | 76/3918 | 244/18723 | 1.07e-04 | 1.59e-03 | 76 |
| GO:0030100 | Colorectum | AD | regulation of endocytosis | 67/3918 | 211/18723 | 1.42e-04 | 2.01e-03 | 67 |
| GO:0048259 | Colorectum | AD | regulation of receptor-mediated endocytosis | 35/3918 | 110/18723 | 4.85e-03 | 3.27e-02 | 35 |
| GO:0007219 | Colorectum | AD | Notch signaling pathway | 50/3918 | 172/18723 | 6.92e-03 | 4.26e-02 | 50 |
| GO:00316471 | Colorectum | SER | regulation of protein stability | 86/2897 | 298/18723 | 2.56e-09 | 2.42e-07 | 86 |
| GO:00508211 | Colorectum | SER | protein stabilization | 58/2897 | 191/18723 | 1.46e-07 | 8.59e-06 | 58 |
| GO:00467771 | Colorectum | SER | protein autophosphorylation | 60/2897 | 227/18723 | 1.36e-05 | 4.25e-04 | 60 |
| GO:00301001 | Colorectum | SER | regulation of endocytosis | 48/2897 | 211/18723 | 3.29e-03 | 2.82e-02 | 48 |
| Hugo Symbol | Variant Class | Variant Classification | dbSNP RS | HGVSc | HGVSp | HGVSp Short | SWISSPROT | BIOTYPE | SIFT | PolyPhen | Tumor Sample Barcode | Tissue | Histology | Sex | Age | Stage | Therapy Types | Drugs | Outcome |
| AAK1 | SNV | Missense_Mutation | novel | c.2879N>C | p.Asp960Ala | p.D960A | Q2M2I8 | protein_coding | deleterious(0) | probably_damaging(0.994) | TCGA-A8-A096-01 | Breast | breast invasive carcinoma | Female | >=65 | I/II | Unknown | Unknown | SD |
| AAK1 | SNV | Missense_Mutation | | c.2608N>G | p.Leu870Val | p.L870V | Q2M2I8 | protein_coding | deleterious(0.01) | probably_damaging(0.978) | TCGA-AC-A23H-01 | Breast | breast invasive carcinoma | Female | >=65 | I/II | Unknown | Unknown | PD |
| AAK1 | SNV | Missense_Mutation | novel | c.842N>A | p.Arg281Gln | p.R281Q | Q2M2I8 | protein_coding | deleterious(0.01) | probably_damaging(0.994) | TCGA-AN-A046-01 | Breast | breast invasive carcinoma | Female | >=65 | I/II | Unknown | Unknown | SD |
| AAK1 | SNV | Missense_Mutation | novel | c.2488G>C | p.Glu830Gln | p.E830Q | Q2M2I8 | protein_coding | tolerated(0.07) | probably_damaging(0.932) | TCGA-AR-A2LE-01 | Breast | breast invasive carcinoma | Female | >=65 | I/II | Hormone Therapy | tamoxiphen | PD |
| AAK1 | SNV | Missense_Mutation | rs367891079 | c.2729C>T | p.Ser910Leu | p.S910L | Q2M2I8 | protein_coding | tolerated(0.09) | benign(0) | TCGA-BH-A18G-01 | Breast | breast invasive carcinoma | Female | >=65 | I/II | Unknown | Unknown | SD |
| AAK1 | SNV | Missense_Mutation | | c.92G>A | p.Gly31Asp | p.G31D | Q2M2I8 | protein_coding | deleterious(0) | probably_damaging(0.998) | TCGA-D8-A140-01 | Breast | breast invasive carcinoma | Female | <65 | I/II | Chemotherapy | doxorubicin+cyclophosphamid | SD |
| AAK1 | SNV | Missense_Mutation | | c.674N>G | p.Tyr225Cys | p.Y225C | Q2M2I8 | protein_coding | deleterious(0) | probably_damaging(0.999) | TCGA-D8-A1XK-01 | Breast | breast invasive carcinoma | Female | <65 | I/II | Chemotherapy | doxorubicine+cyclophosphamide | SD |
| AAK1 | insertion | Nonsense_Mutation | novel | c.2468_2469insTCTCCCACCCCTTATTAAATTAAGCATTCTGGCCAGTTAGTG | p.Glu823delinsAspLeuProProLeuIleLysLeuSerIleLeuAlaSerTerTer | p.E823delinsDLPPLIKLSILAS** | Q2M2I8 | protein_coding | | | TCGA-A2-A0EX-01 | Breast | breast invasive carcinoma | Female | <65 | I/II | Hormone Therapy | tamoxiphen | SD |
| AAK1 | deletion | Frame_Shift_Del | novel | c.1239delC | p.Ser414ValfsTer114 | p.S414Vfs*114 | Q2M2I8 | protein_coding | | | TCGA-D8-A27V-01 | Breast | breast invasive carcinoma | Female | <65 | I/II | Hormone Therapy | tamoxiphen | SD |
| AAK1 | insertion | Nonsense_Mutation | novel | c.64_65insCTTAAGTTGAGTTTGAATTTGTGGCTC | p.Gly22delinsAlaTerValGluPheGluPheValAlaArg | p.G22delinsA*VEFEFVAR | Q2M2I8 | protein_coding | | | TCGA-E9-A1NC-01 | Breast | breast invasive carcinoma | Female | <65 | I/II | Chemotherapy | doxorubicin | CR |


