
|
|||||
|
 | |
| |
| |
| |
| |
| |
|
Gene: AAGAB |
Gene summary for AAGAB |
| Gene information | Species | Human | Gene symbol | AAGAB | Gene ID | 79719 |
| Gene name | alpha and gamma adaptin binding protein | |
| Gene Alias | KPPP1 | |
| Cytomap | 15q23 | |
| Gene Type | protein-coding | GO ID | GO:0006810 | UniProtAcc | Q6PD74 |
Top |
Malignant transformation analysis |
| Identification of the aberrant gene expression in precancerous and cancerous lesions by comparing the gene expression of stem-like cells in diseased tissues with normal stem cells |
| Entrez ID | Symbol | Replicates | Species | Organ | Tissue | Adj P-value | Log2FC | Malignancy |
| 79719 | AAGAB | CCI_2 | Human | Cervix | CC | 4.13e-13 | 1.06e+00 | 0.5249 |
| 79719 | AAGAB | CCI_3 | Human | Cervix | CC | 6.73e-03 | 6.20e-01 | 0.516 |
| 79719 | AAGAB | T3 | Human | Cervix | CC | 6.56e-04 | 2.32e-01 | 0.1389 |
| 79719 | AAGAB | LZE2T | Human | Esophagus | ESCC | 8.12e-03 | 2.88e-01 | 0.082 |
| 79719 | AAGAB | LZE4T | Human | Esophagus | ESCC | 8.87e-11 | 2.88e-01 | 0.0811 |
| 79719 | AAGAB | LZE5T | Human | Esophagus | ESCC | 4.16e-02 | 1.48e-01 | 0.0514 |
| 79719 | AAGAB | LZE7T | Human | Esophagus | ESCC | 1.07e-07 | 5.72e-01 | 0.0667 |
| 79719 | AAGAB | LZE8T | Human | Esophagus | ESCC | 5.22e-08 | 2.12e-01 | 0.067 |
| 79719 | AAGAB | LZE20T | Human | Esophagus | ESCC | 1.47e-04 | 1.12e-01 | 0.0662 |
| 79719 | AAGAB | LZE22T | Human | Esophagus | ESCC | 5.03e-03 | 2.62e-01 | 0.068 |
| 79719 | AAGAB | LZE24T | Human | Esophagus | ESCC | 2.32e-11 | 3.53e-01 | 0.0596 |
| 79719 | AAGAB | LZE6T | Human | Esophagus | ESCC | 9.45e-10 | 4.80e-01 | 0.0845 |
| 79719 | AAGAB | P1T-E | Human | Esophagus | ESCC | 4.36e-09 | 4.05e-01 | 0.0875 |
| 79719 | AAGAB | P2T-E | Human | Esophagus | ESCC | 7.50e-22 | 4.76e-01 | 0.1177 |
| 79719 | AAGAB | P4T-E | Human | Esophagus | ESCC | 7.55e-36 | 7.55e-01 | 0.1323 |
| 79719 | AAGAB | P5T-E | Human | Esophagus | ESCC | 3.05e-02 | 1.17e-01 | 0.1327 |
| 79719 | AAGAB | P8T-E | Human | Esophagus | ESCC | 4.45e-19 | 3.94e-01 | 0.0889 |
| 79719 | AAGAB | P9T-E | Human | Esophagus | ESCC | 2.82e-13 | 3.22e-01 | 0.1131 |
| 79719 | AAGAB | P10T-E | Human | Esophagus | ESCC | 7.98e-20 | 3.75e-01 | 0.116 |
| 79719 | AAGAB | P11T-E | Human | Esophagus | ESCC | 6.57e-10 | 3.79e-01 | 0.1426 |
| Page: 1 2 3 4 5 |
| Tissue | Expression Dynamics | Abbreviation |
| Cervix | 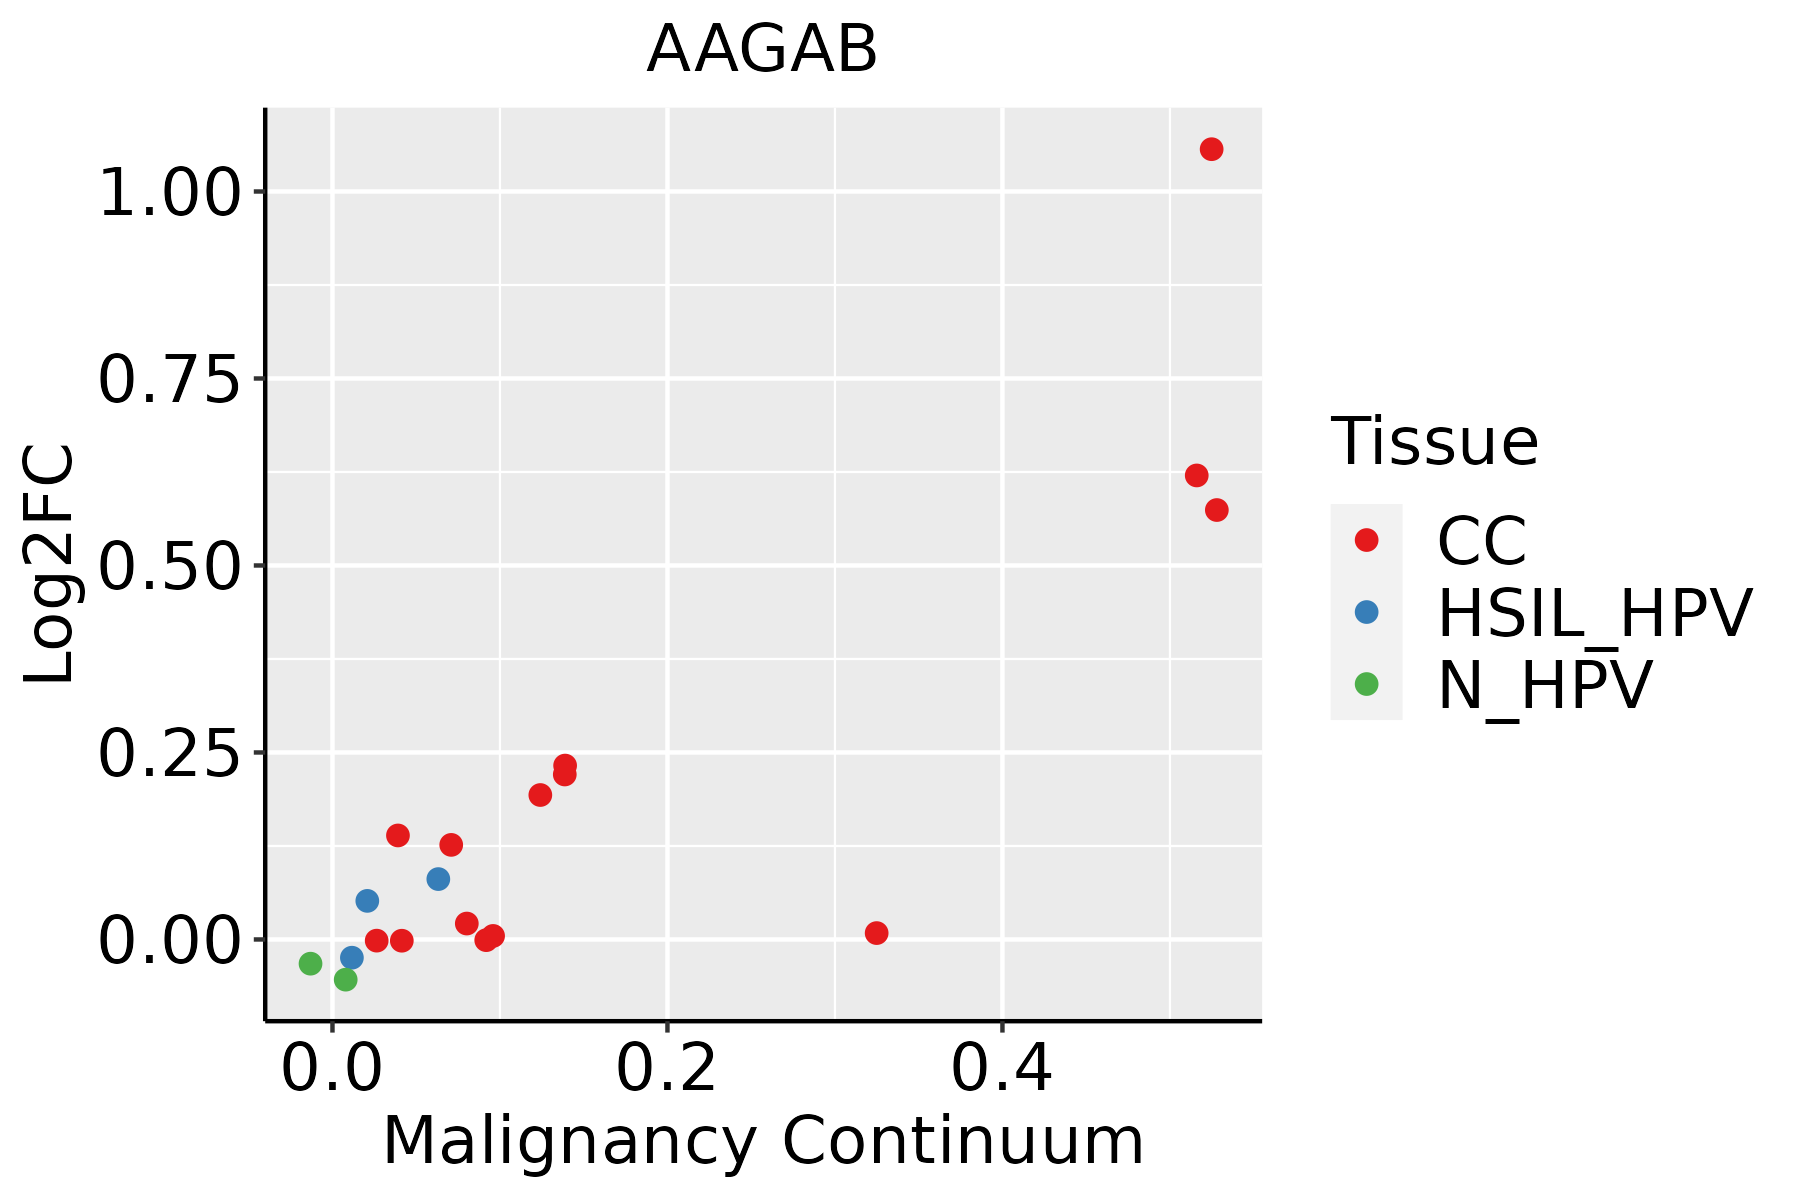 | CC: Cervix cancer |
| HSIL_HPV: HPV-infected high-grade squamous intraepithelial lesions | ||
| N_HPV: HPV-infected normal cervix | ||
| Esophagus | 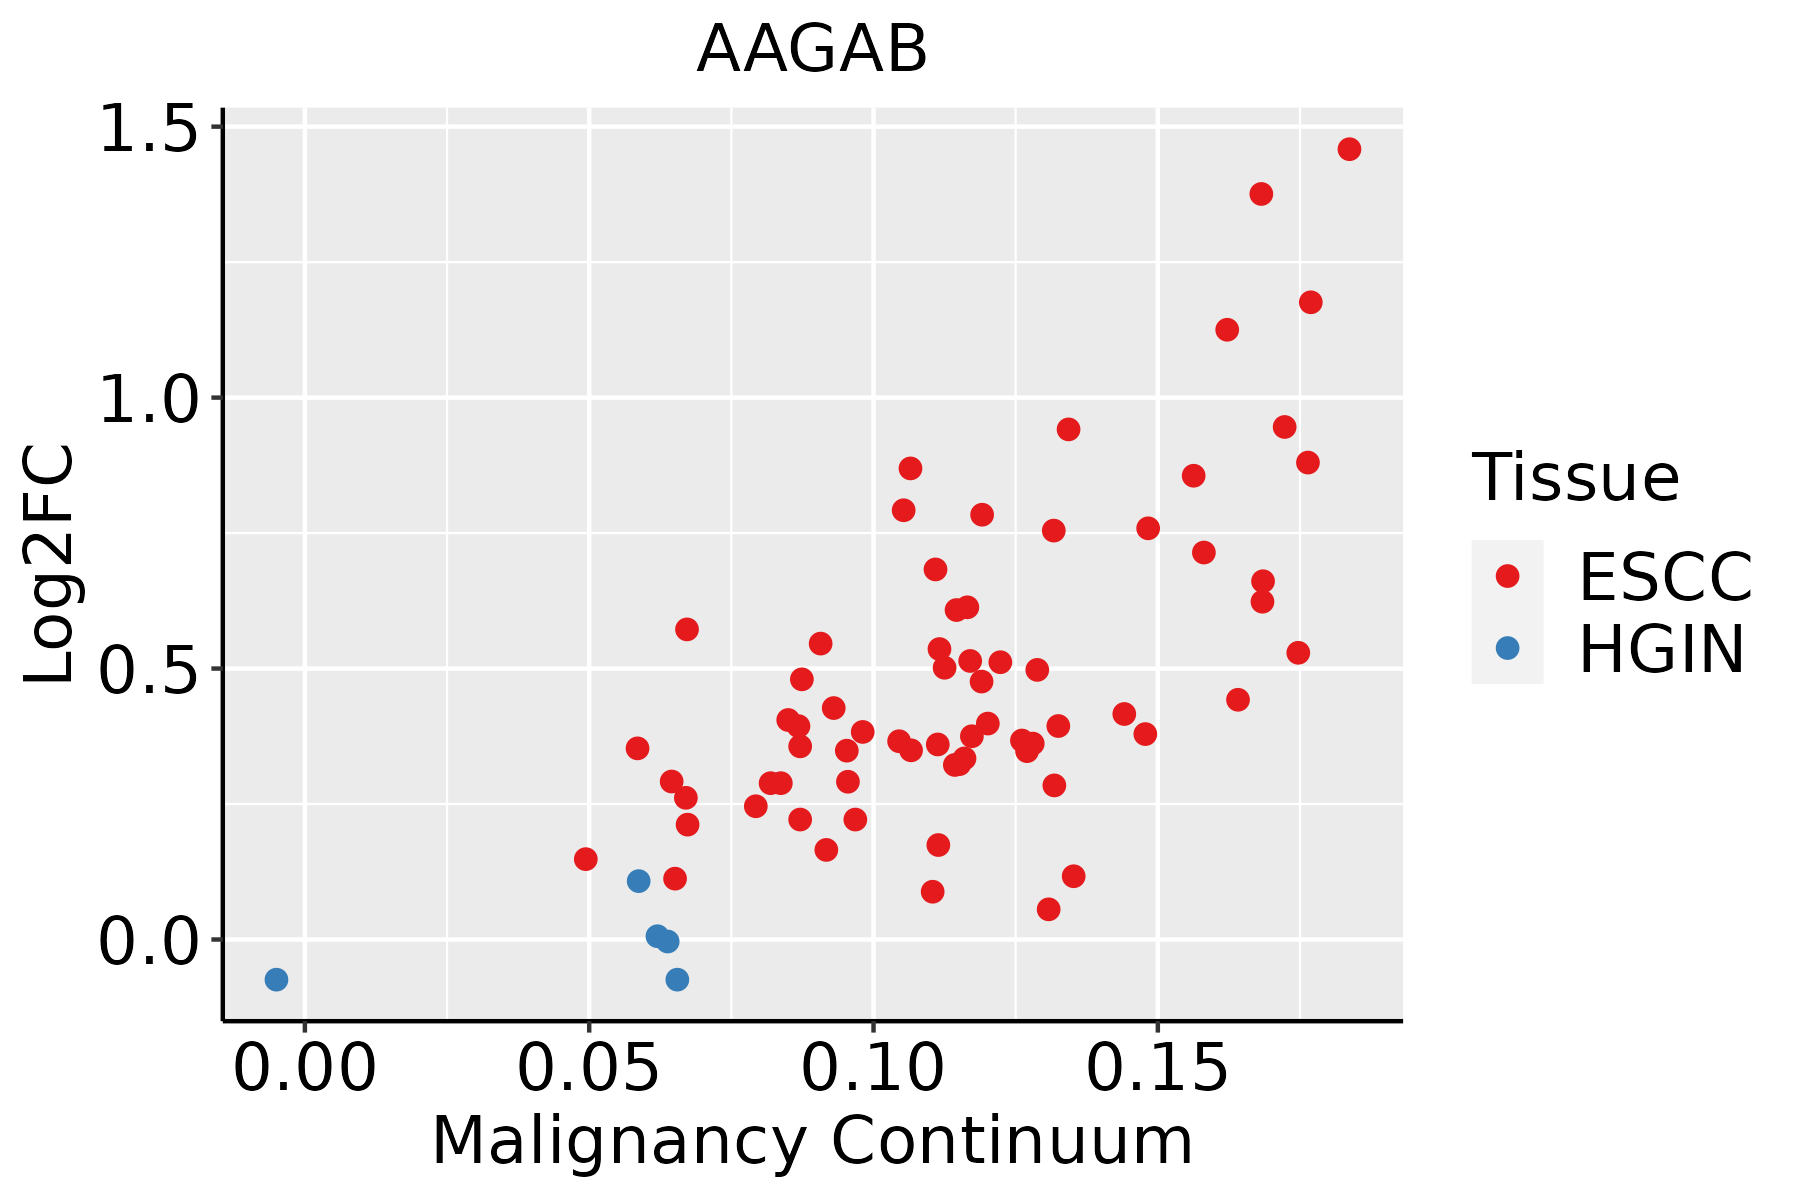 | ESCC: Esophageal squamous cell carcinoma |
| HGIN: High-grade intraepithelial neoplasias | ||
| LGIN: Low-grade intraepithelial neoplasias | ||
| Liver | 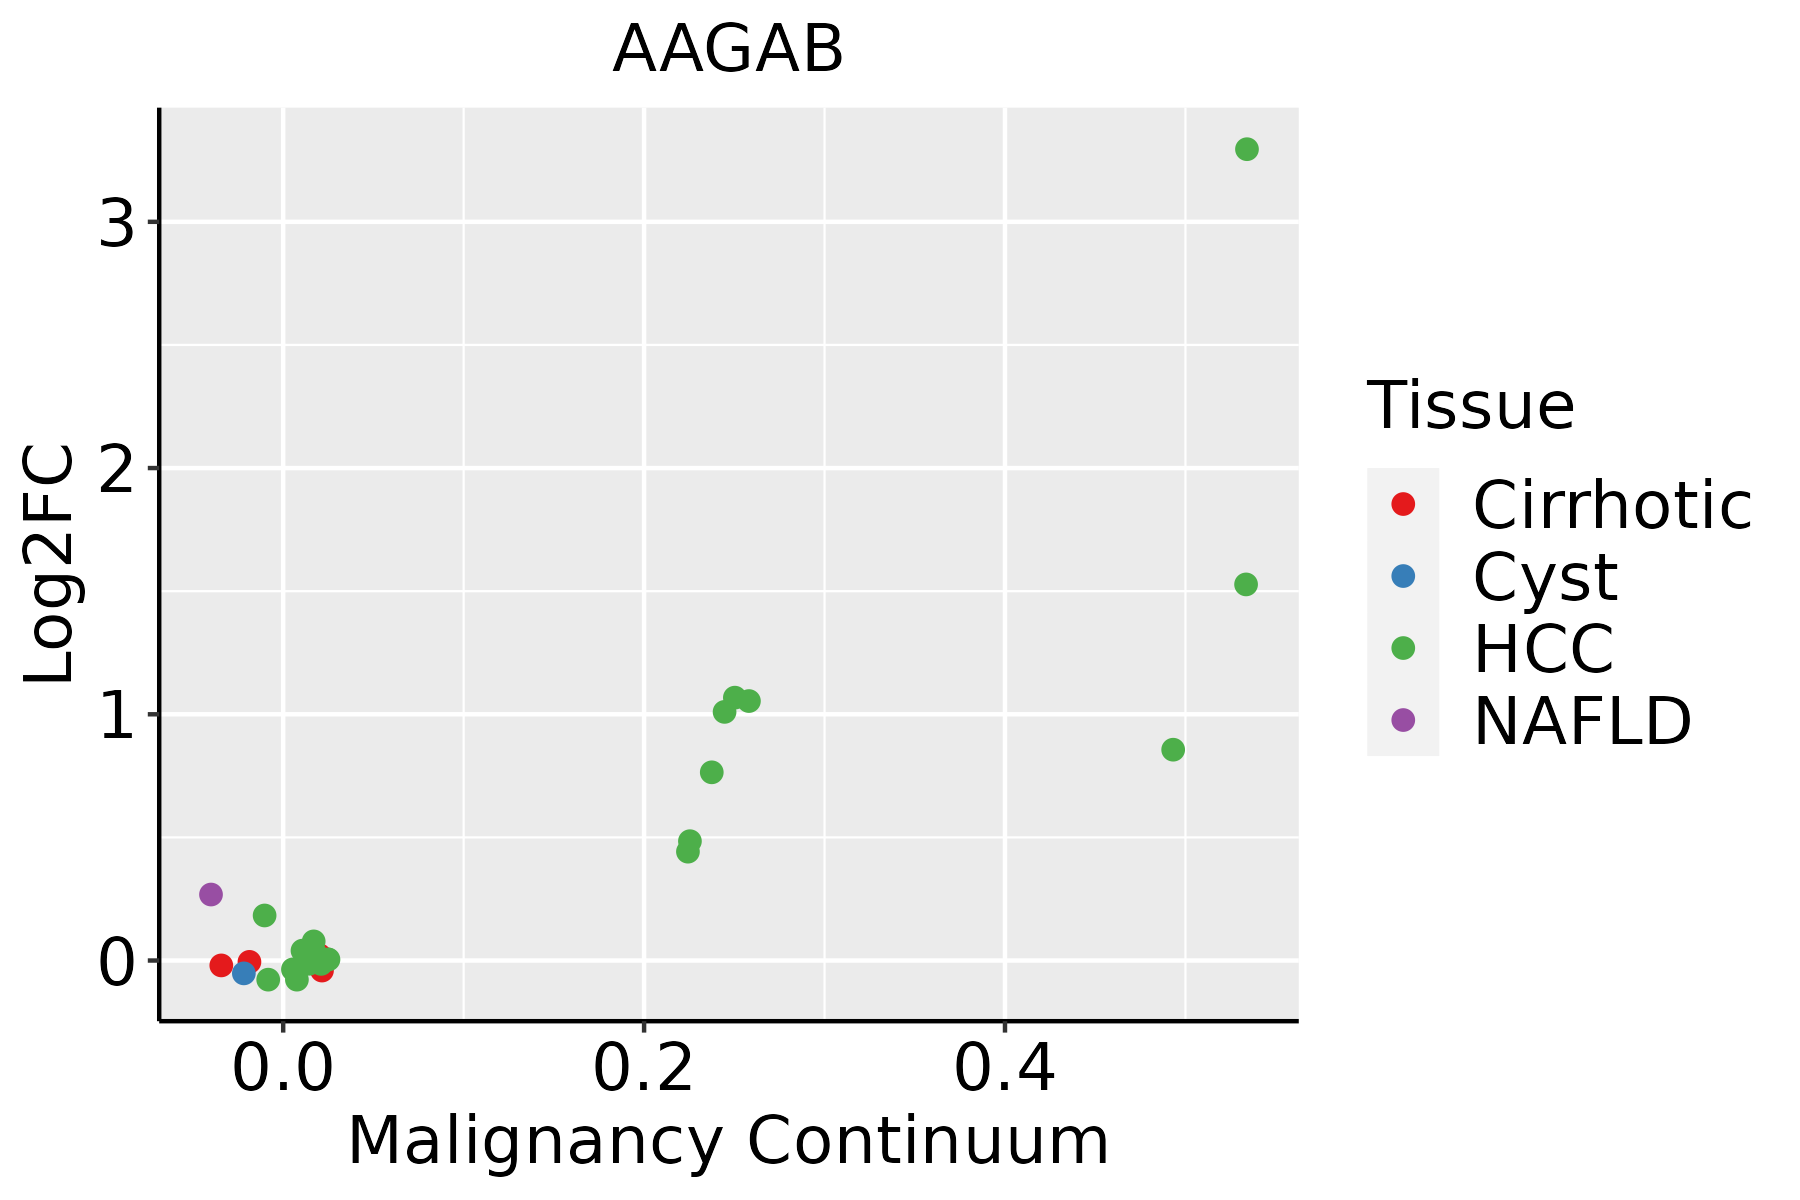 | HCC: Hepatocellular carcinoma |
| NAFLD: Non-alcoholic fatty liver disease | ||
| Oral Cavity |  | EOLP: Erosive Oral lichen planus |
| LP: leukoplakia | ||
| NEOLP: Non-erosive oral lichen planus | ||
| OSCC: Oral squamous cell carcinoma | ||
| Skin | 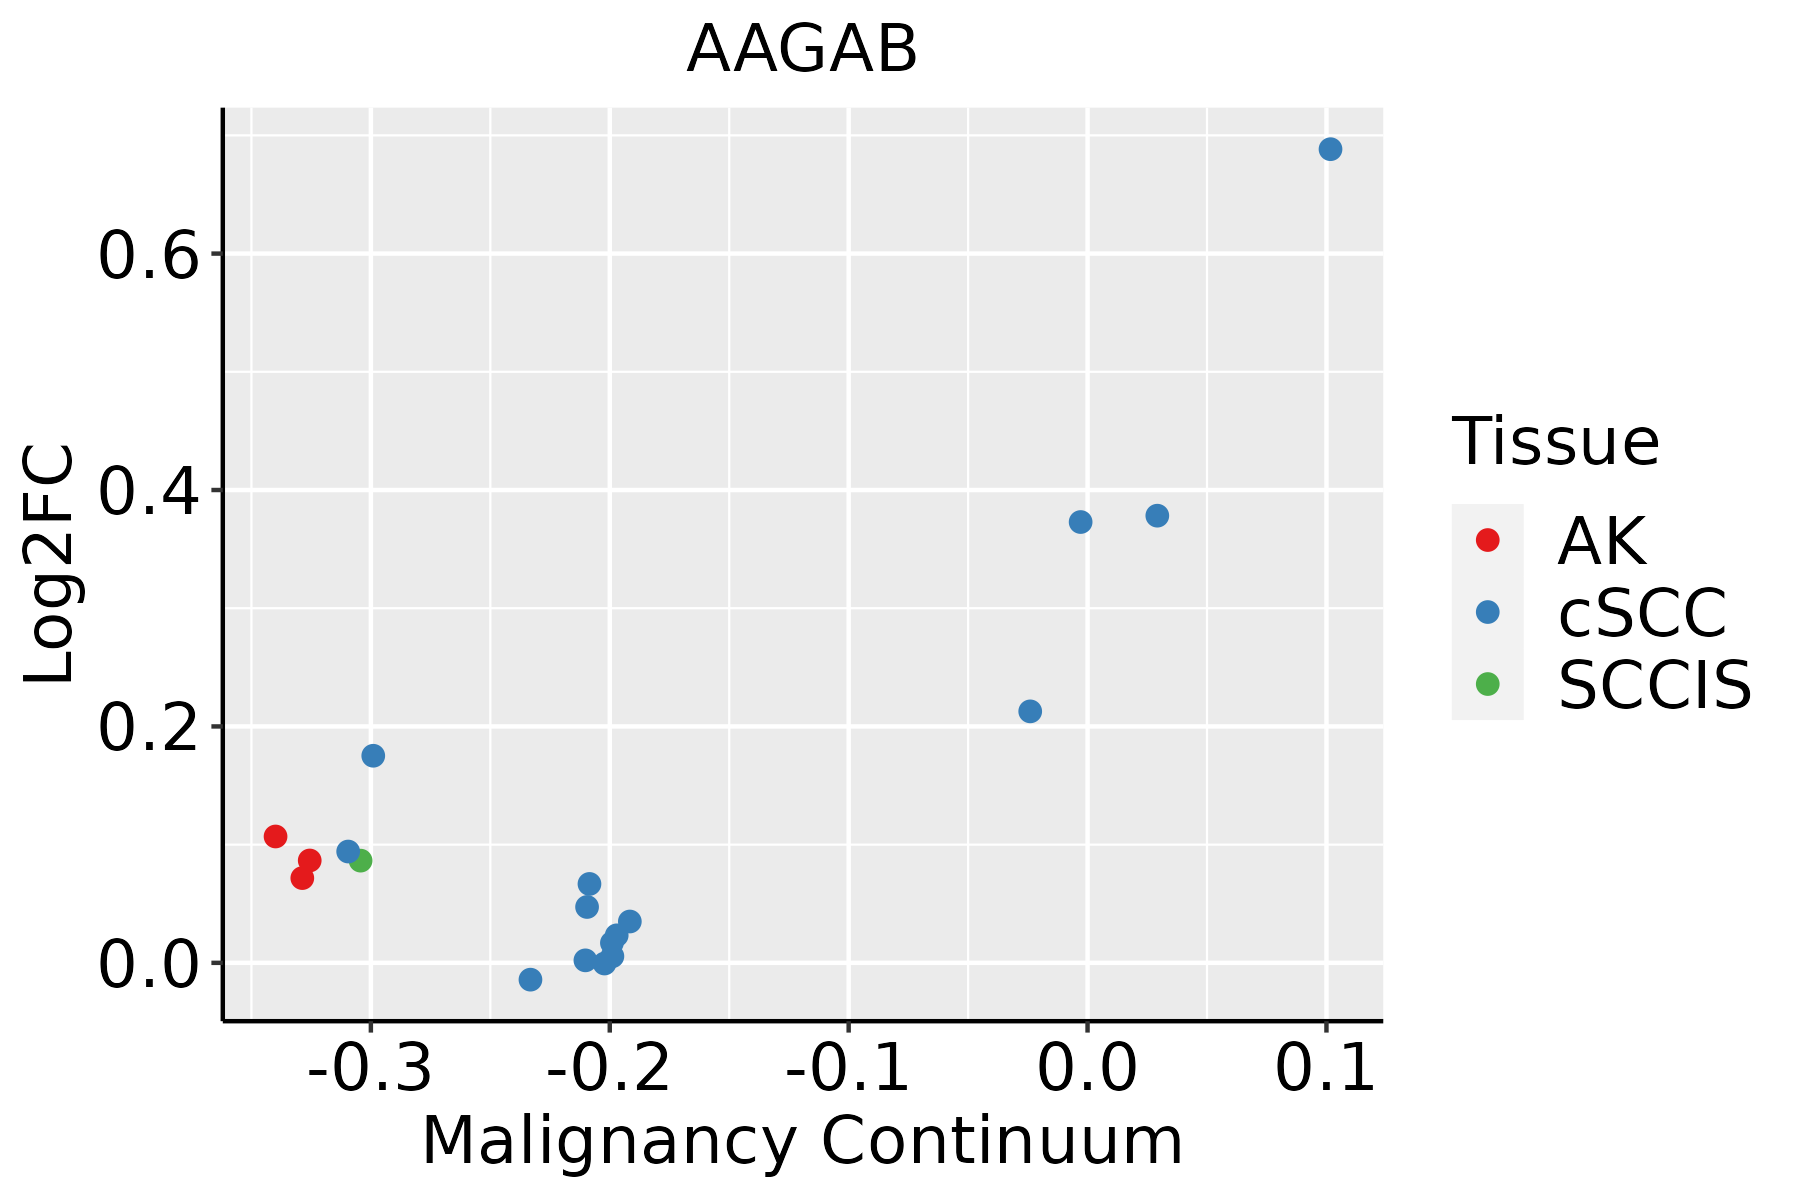 | AK: Actinic keratosis |
| cSCC: Cutaneous squamous cell carcinoma | ||
| SCCIS:squamous cell carcinoma in situ |
| ∗log2FC in expression of this searched gene in stem-like cells from each diseased tissue sample relative to stem-like cells in normal samples in each tissue plotted against the malignancy continuum. Samples are colored based on if they are from different disease stage. |
Top |
Malignant transformation related pathway analysis |
| Find out the enriched GO biological processes and KEGG pathways involved in transition from healthy to precancer to cancer |
| Tissue | Disease Stage | Enriched GO biological Processes |
| Colorectum | AD |  |
| Colorectum | SER |  |
| Colorectum | MSS |  |
| Colorectum | MSI-H |  |
| Colorectum | FAP |  |
| ∗Top 15 enriched GO BP terms are showed in the bar plot of each disease state in each tissue. Each row represents a significant GO biological process which is colored according to the -log10(p.adjust). |
| Page: 1 2 3 4 5 6 7 8 9 |
| GO ID | Tissue | Disease Stage | Description | Gene Ratio | Bg Ratio | pvalue | p.adjust | Count |
| Page: 1 |
| Pathway ID | Tissue | Disease Stage | Description | Gene Ratio | Bg Ratio | pvalue | p.adjust | qvalue | Count |
| Page: 1 |
Top |
Cell-cell communication analysis |
| Identification of potential cell-cell interactions between two cell types and their ligand-receptor pairs for different disease states |
| Ligand | Receptor | LRpair | Pathway | Tissue | Disease Stage |
| Page: 1 |
Top |
Single-cell gene regulatory network inference analysis |
| Find out the significant the regulons (TFs) and the target genes of each regulon across cell types for different disease states |
| TF | Cell Type | Tissue | Disease Stage | Target Gene | RSS | Regulon Activity |
| ∗The dot plots of a searched regulon are shown for all cell subpopulations in each disease state of each tissue based on the regulon specific score inferred using pySCENIC and by calculating the average expression. |
| Page: 1 |
Top |
Somatic mutation of malignant transformation related genes |
| Annotation of somatic variants for genes involved in malignant transformation |
| Hugo Symbol | Variant Class | Variant Classification | dbSNP RS | HGVSc | HGVSp | HGVSp Short | SWISSPROT | BIOTYPE | SIFT | PolyPhen | Tumor Sample Barcode | Tissue | Histology | Sex | Age | Stage | Therapy Types | Drugs | Outcome |
| AAGAB | SNV | Missense_Mutation | c.772G>C | p.Asp258His | p.D258H | Q6PD74 | protein_coding | deleterious(0.01) | probably_damaging(0.947) | TCGA-EW-A1OV-01 | Breast | breast invasive carcinoma | Female | <65 | I/II | Chemotherapy | epirubicin | SD | |
| AAGAB | SNV | Missense_Mutation | novel | c.865N>A | p.Glu289Lys | p.E289K | Q6PD74 | protein_coding | deleterious(0) | probably_damaging(0.999) | TCGA-MA-AA41-01 | Cervix | cervical & endocervical cancer | Female | <65 | I/II | Unknown | Unknown | SD |
| AAGAB | SNV | Missense_Mutation | novel | c.703G>A | p.Asp235Asn | p.D235N | Q6PD74 | protein_coding | tolerated(0.13) | benign(0.021) | TCGA-VS-A94X-01 | Cervix | cervical & endocervical cancer | Female | <65 | I/II | Chemotherapy | cisplatin | PD |
| AAGAB | SNV | Missense_Mutation | novel | c.277G>C | p.Asp93His | p.D93H | Q6PD74 | protein_coding | deleterious(0.01) | possibly_damaging(0.809) | TCGA-VS-A9U7-01 | Cervix | cervical & endocervical cancer | Female | <65 | I/II | Chemotherapy | cisplatin | CR |
| AAGAB | SNV | Missense_Mutation | novel | c.223G>A | p.Glu75Lys | p.E75K | Q6PD74 | protein_coding | deleterious(0.01) | benign(0.319) | TCGA-VS-A9U7-01 | Cervix | cervical & endocervical cancer | Female | <65 | I/II | Chemotherapy | cisplatin | CR |
| AAGAB | SNV | Missense_Mutation | c.782N>G | p.Asn261Ser | p.N261S | Q6PD74 | protein_coding | tolerated(0.24) | possibly_damaging(0.626) | TCGA-A6-3809-01 | Colorectum | colon adenocarcinoma | Female | >=65 | I/II | Unknown | Unknown | SD | |
| AAGAB | SNV | Missense_Mutation | rs756314278 | c.269N>T | p.Ser90Leu | p.S90L | Q6PD74 | protein_coding | tolerated(0.23) | benign(0.005) | TCGA-D5-6932-01 | Colorectum | colon adenocarcinoma | Male | >=65 | I/II | Unknown | Unknown | SD |
| AAGAB | SNV | Missense_Mutation | rs868733495 | c.427N>T | p.Pro143Ser | p.P143S | Q6PD74 | protein_coding | deleterious(0) | probably_damaging(0.992) | TCGA-EI-7002-01 | Colorectum | rectum adenocarcinoma | Male | <65 | III/IV | Chemotherapy | irinotecan+5-fluorouracilim | SD |
| AAGAB | deletion | Frame_Shift_Del | c.911_912delAT | p.Asp304GlyfsTer3 | p.D304Gfs*3 | Q6PD74 | protein_coding | TCGA-F5-6813-01 | Colorectum | rectum adenocarcinoma | Male | >=65 | III/IV | Unknown | Unknown | PD | |||
| AAGAB | SNV | Missense_Mutation | novel | c.218N>G | p.Ile73Ser | p.I73S | Q6PD74 | protein_coding | deleterious(0) | benign(0.396) | TCGA-AJ-A3EK-01 | Endometrium | uterine corpus endometrioid carcinoma | Female | <65 | I/II | Chemotherapy | carboplatin | CR |
| Page: 1 2 3 |
Top |
Related drugs of malignant transformation related genes |
| Identification of chemicals and drugs interact with genes involved in malignant transfromation |
| (DGIdb 4.0) |
| Entrez ID | Symbol | Category | Interaction Types | Drug Claim Name | Drug Name | PMIDs |
| Page: 1 |

Copyright 2023-Present -The University of Texas Health Science Center at Houston |