
|
|||||
|
 | |
| |
| |
| |
| |
| |
|
Gene: AAAS |
Gene summary for AAAS |
| Gene information | Species | Human | Gene symbol | AAAS | Gene ID | 8086 |
| Gene name | aladin WD repeat nucleoporin | |
| Gene Alias | AAA | |
| Cytomap | 12q13.13 | |
| Gene Type | protein-coding | GO ID | GO:0000003 | UniProtAcc | Q9NRG9 |
Top |
Malignant transformation analysis |
| Identification of the aberrant gene expression in precancerous and cancerous lesions by comparing the gene expression of stem-like cells in diseased tissues with normal stem cells |
| Entrez ID | Symbol | Replicates | Species | Organ | Tissue | Adj P-value | Log2FC | Malignancy |
| 8086 | AAAS | LZE4T | Human | Esophagus | ESCC | 2.32e-09 | 1.33e-01 | 0.0811 |
| 8086 | AAAS | LZE7T | Human | Esophagus | ESCC | 1.06e-02 | 1.36e-01 | 0.0667 |
| 8086 | AAAS | LZE8T | Human | Esophagus | ESCC | 1.02e-02 | 1.19e-01 | 0.067 |
| 8086 | AAAS | LZE24T | Human | Esophagus | ESCC | 1.50e-24 | 3.91e-01 | 0.0596 |
| 8086 | AAAS | LZE6T | Human | Esophagus | ESCC | 1.36e-05 | 2.37e-01 | 0.0845 |
| 8086 | AAAS | P1T-E | Human | Esophagus | ESCC | 3.04e-10 | 3.39e-01 | 0.0875 |
| 8086 | AAAS | P2T-E | Human | Esophagus | ESCC | 1.13e-55 | 9.80e-01 | 0.1177 |
| 8086 | AAAS | P4T-E | Human | Esophagus | ESCC | 1.14e-15 | 3.94e-01 | 0.1323 |
| 8086 | AAAS | P5T-E | Human | Esophagus | ESCC | 9.45e-17 | 3.08e-01 | 0.1327 |
| 8086 | AAAS | P8T-E | Human | Esophagus | ESCC | 3.02e-27 | 4.19e-01 | 0.0889 |
| 8086 | AAAS | P9T-E | Human | Esophagus | ESCC | 2.84e-10 | 1.75e-01 | 0.1131 |
| 8086 | AAAS | P10T-E | Human | Esophagus | ESCC | 1.20e-24 | 4.66e-01 | 0.116 |
| 8086 | AAAS | P11T-E | Human | Esophagus | ESCC | 2.09e-11 | 4.79e-01 | 0.1426 |
| 8086 | AAAS | P12T-E | Human | Esophagus | ESCC | 1.34e-25 | 4.93e-01 | 0.1122 |
| 8086 | AAAS | P15T-E | Human | Esophagus | ESCC | 6.30e-23 | 4.35e-01 | 0.1149 |
| 8086 | AAAS | P16T-E | Human | Esophagus | ESCC | 3.49e-30 | 5.74e-01 | 0.1153 |
| 8086 | AAAS | P17T-E | Human | Esophagus | ESCC | 5.68e-13 | 4.50e-01 | 0.1278 |
| 8086 | AAAS | P19T-E | Human | Esophagus | ESCC | 4.78e-08 | 6.38e-01 | 0.1662 |
| 8086 | AAAS | P20T-E | Human | Esophagus | ESCC | 6.56e-28 | 4.83e-01 | 0.1124 |
| 8086 | AAAS | P21T-E | Human | Esophagus | ESCC | 5.65e-18 | 3.68e-01 | 0.1617 |
| Page: 1 2 3 4 5 |
| Tissue | Expression Dynamics | Abbreviation |
| Esophagus |  | ESCC: Esophageal squamous cell carcinoma |
| HGIN: High-grade intraepithelial neoplasias | ||
| LGIN: Low-grade intraepithelial neoplasias | ||
| Liver | 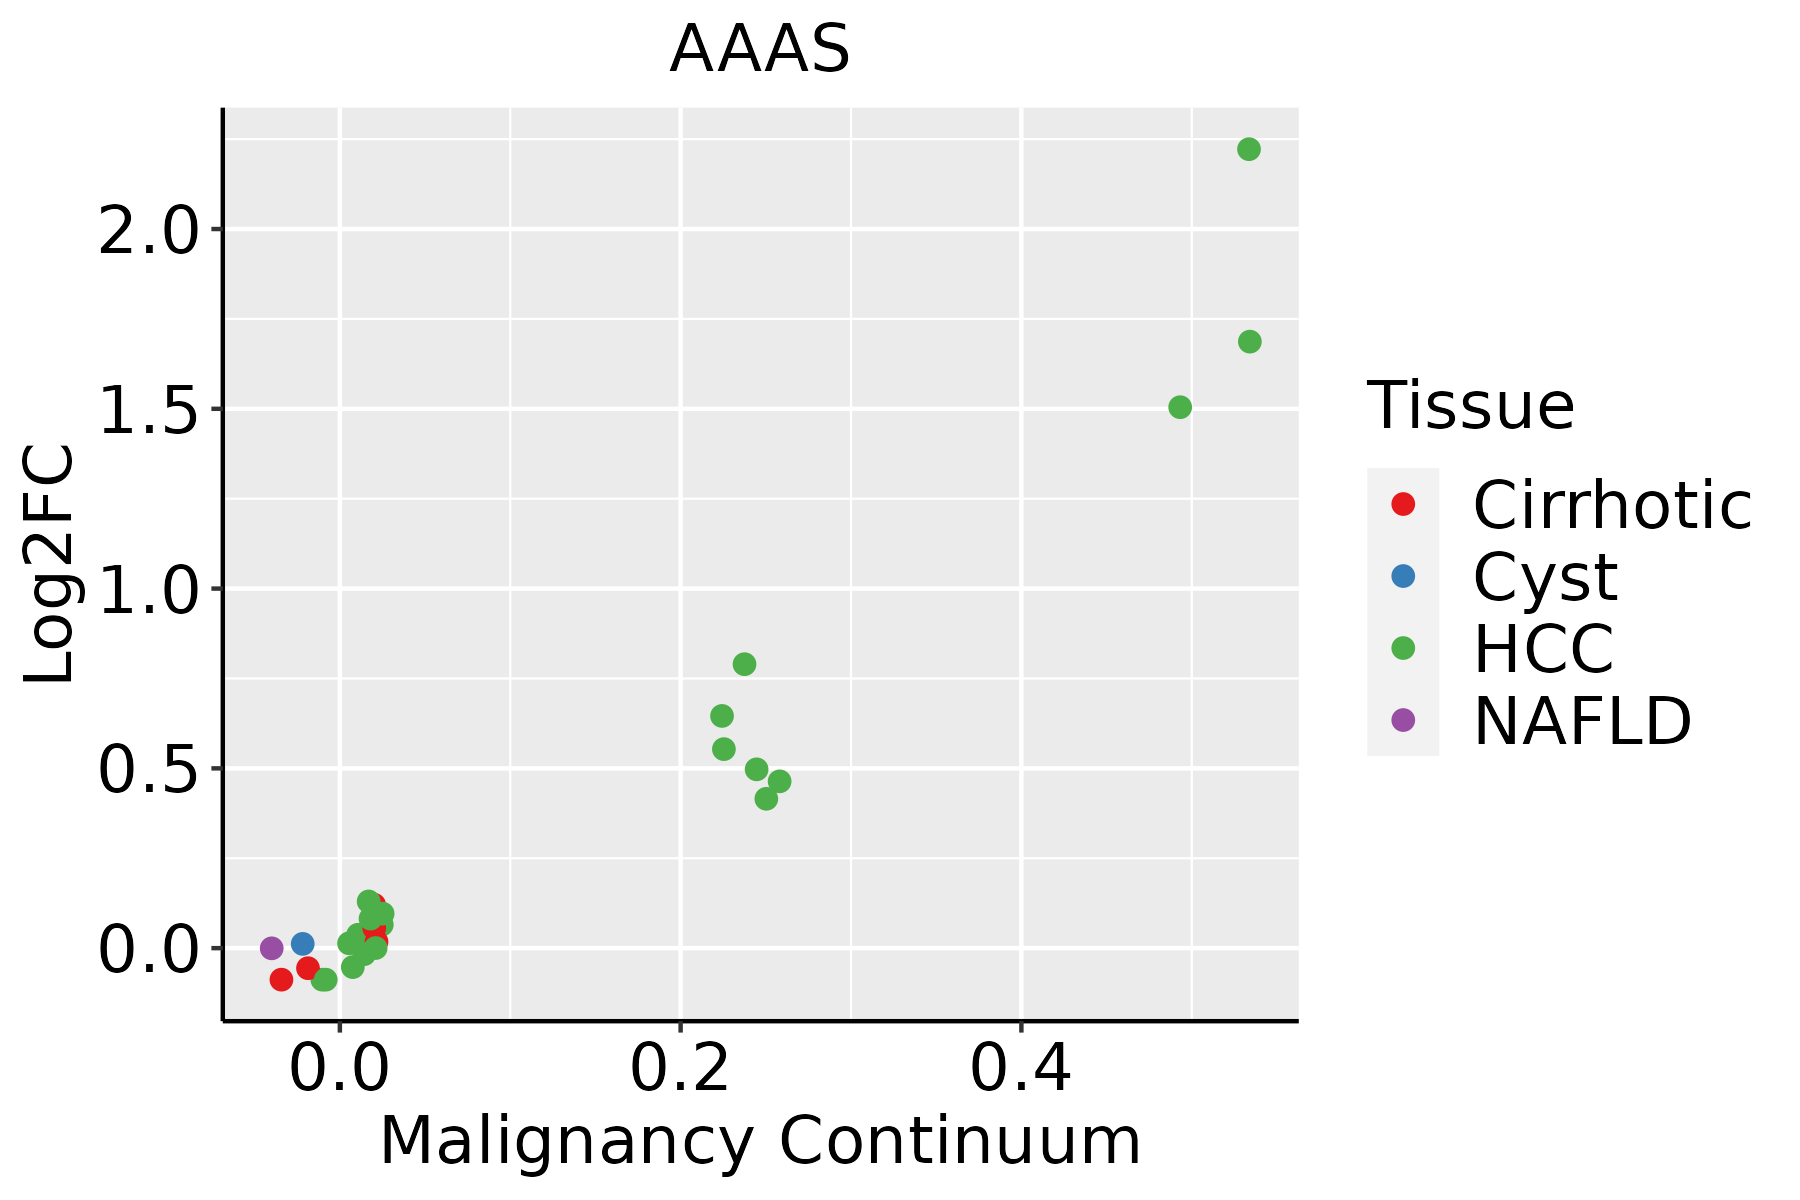 | HCC: Hepatocellular carcinoma |
| NAFLD: Non-alcoholic fatty liver disease | ||
| Oral Cavity | 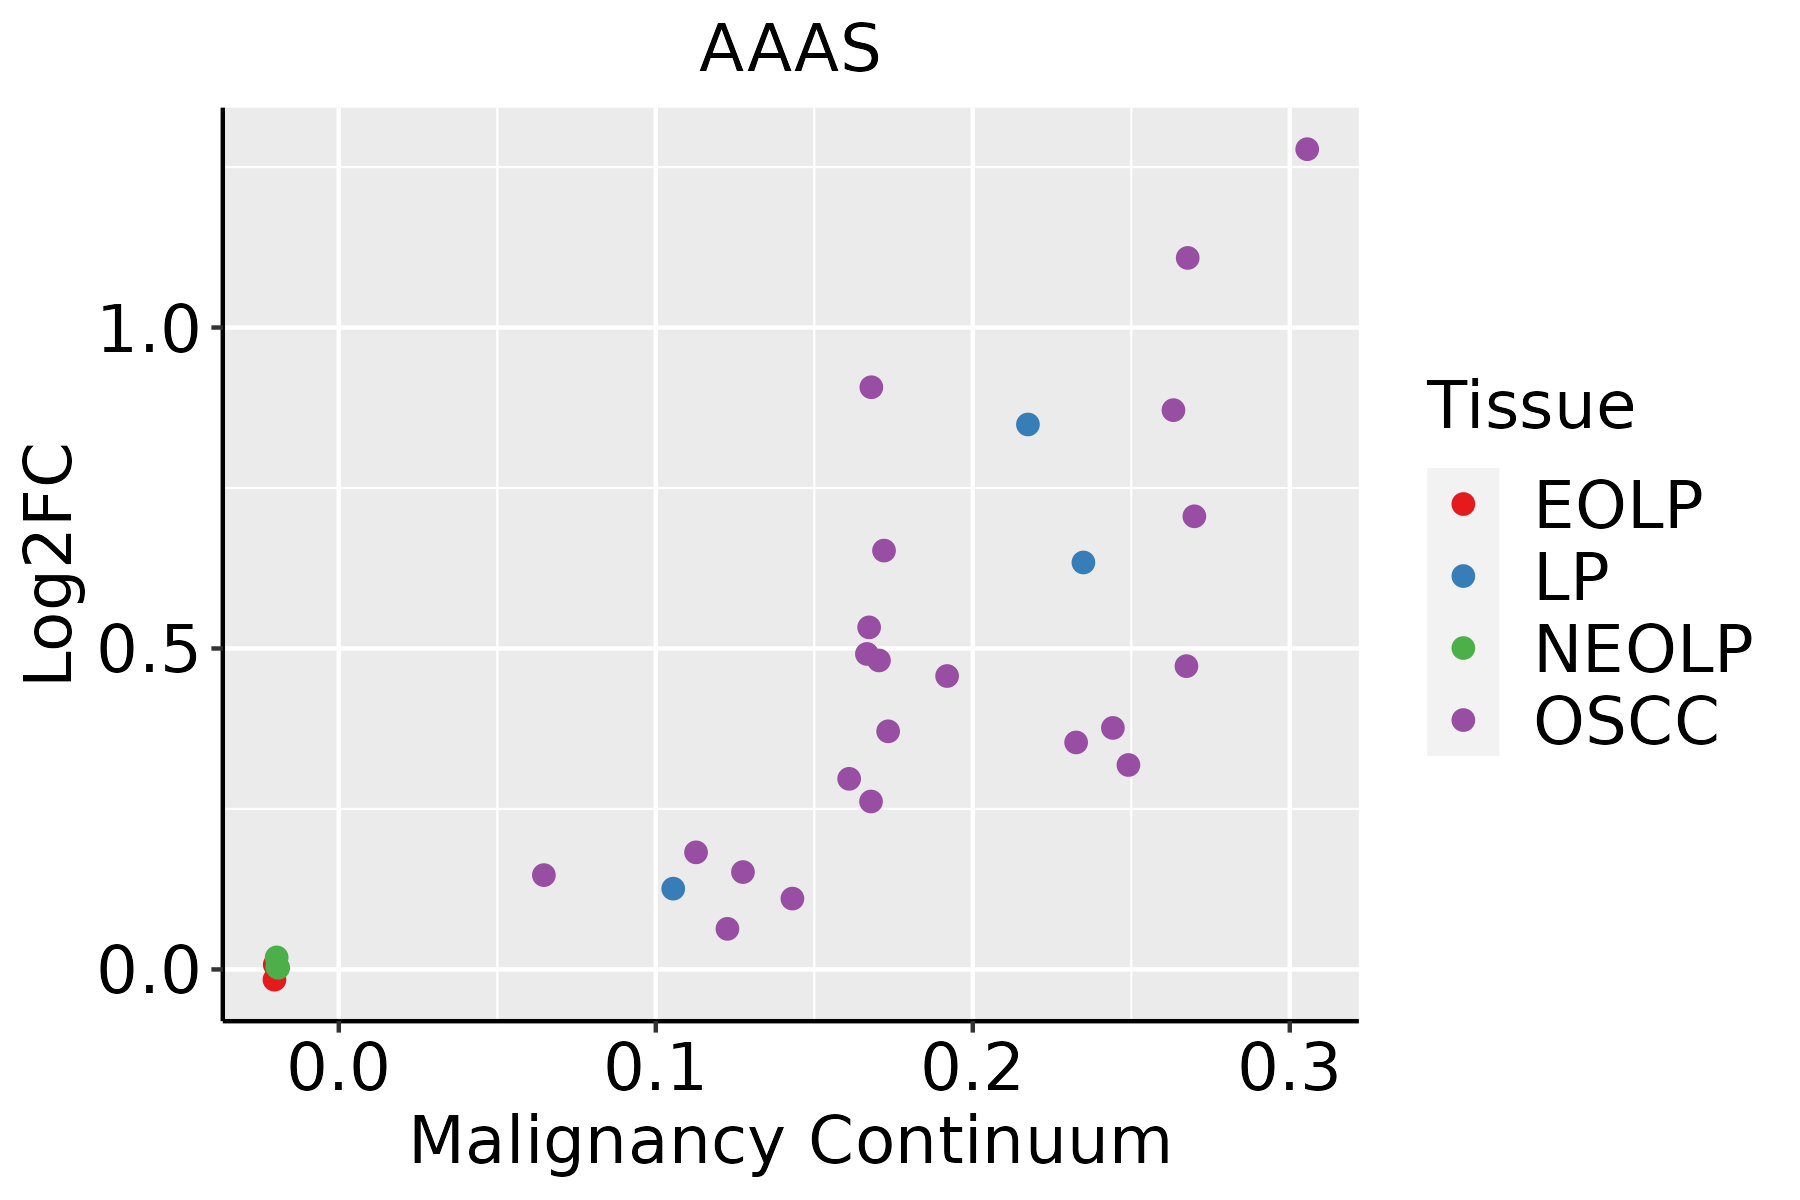 | EOLP: Erosive Oral lichen planus |
| LP: leukoplakia | ||
| NEOLP: Non-erosive oral lichen planus | ||
| OSCC: Oral squamous cell carcinoma | ||
| Skin |  | AK: Actinic keratosis |
| cSCC: Cutaneous squamous cell carcinoma | ||
| SCCIS:squamous cell carcinoma in situ |
| ∗log2FC in expression of this searched gene in stem-like cells from each diseased tissue sample relative to stem-like cells in normal samples in each tissue plotted against the malignancy continuum. Samples are colored based on if they are from different disease stage. |
Top |
Malignant transformation related pathway analysis |
| Find out the enriched GO biological processes and KEGG pathways involved in transition from healthy to precancer to cancer |
| Tissue | Disease Stage | Enriched GO biological Processes |
| Colorectum | AD |  |
| Colorectum | SER |  |
| Colorectum | MSS |  |
| Colorectum | MSI-H |  |
| Colorectum | FAP |  |
| ∗Top 15 enriched GO BP terms are showed in the bar plot of each disease state in each tissue. Each row represents a significant GO biological process which is colored according to the -log10(p.adjust). |
| Page: 1 2 3 4 5 6 7 8 9 |
| GO ID | Tissue | Disease Stage | Description | Gene Ratio | Bg Ratio | pvalue | p.adjust | Count |
| GO:0006913110 | Esophagus | ESCC | nucleocytoplasmic transport | 230/8552 | 301/18723 | 6.04e-28 | 2.02e-25 | 230 |
| GO:0051169110 | Esophagus | ESCC | nuclear transport | 230/8552 | 301/18723 | 6.04e-28 | 2.02e-25 | 230 |
| GO:0006403110 | Esophagus | ESCC | RNA localization | 166/8552 | 201/18723 | 1.95e-27 | 6.18e-25 | 166 |
| GO:014001414 | Esophagus | ESCC | mitotic nuclear division | 218/8552 | 287/18723 | 6.17e-26 | 1.78e-23 | 218 |
| GO:003238618 | Esophagus | ESCC | regulation of intracellular transport | 243/8552 | 337/18723 | 3.20e-23 | 7.25e-21 | 243 |
| GO:005123617 | Esophagus | ESCC | establishment of RNA localization | 134/8552 | 166/18723 | 1.23e-20 | 1.81e-18 | 134 |
| GO:005102815 | Esophagus | ESCC | mRNA transport | 110/8552 | 130/18723 | 2.76e-20 | 3.80e-18 | 110 |
| GO:005065717 | Esophagus | ESCC | nucleic acid transport | 131/8552 | 163/18723 | 6.94e-20 | 8.46e-18 | 131 |
| GO:005065817 | Esophagus | ESCC | RNA transport | 131/8552 | 163/18723 | 6.94e-20 | 8.46e-18 | 131 |
| GO:001593117 | Esophagus | ESCC | nucleobase-containing compound transport | 162/8552 | 222/18723 | 9.87e-17 | 7.93e-15 | 162 |
| GO:190285015 | Esophagus | ESCC | microtubule cytoskeleton organization involved in mitosis | 116/8552 | 147/18723 | 1.25e-16 | 9.91e-15 | 116 |
| GO:0046822110 | Esophagus | ESCC | regulation of nucleocytoplasmic transport | 88/8552 | 106/18723 | 1.88e-15 | 1.19e-13 | 88 |
| GO:000705214 | Esophagus | ESCC | mitotic spindle organization | 97/8552 | 120/18723 | 2.17e-15 | 1.33e-13 | 97 |
| GO:000705114 | Esophagus | ESCC | spindle organization | 134/8552 | 184/18723 | 5.70e-14 | 2.87e-12 | 134 |
| GO:00482853 | Esophagus | ESCC | organelle fission | 301/8552 | 488/18723 | 4.64e-13 | 2.12e-11 | 301 |
| GO:00002802 | Esophagus | ESCC | nuclear division | 270/8552 | 439/18723 | 1.17e-11 | 4.24e-10 | 270 |
| GO:00512256 | Esophagus | ESCC | spindle assembly | 85/8552 | 117/18723 | 2.72e-09 | 5.98e-08 | 85 |
| GO:009030715 | Esophagus | ESCC | mitotic spindle assembly | 52/8552 | 65/18723 | 1.41e-08 | 2.77e-07 | 52 |
| GO:003238611 | Liver | Cirrhotic | regulation of intracellular transport | 147/4634 | 337/18723 | 1.84e-14 | 1.72e-12 | 147 |
| GO:000640312 | Liver | Cirrhotic | RNA localization | 94/4634 | 201/18723 | 8.57e-12 | 5.66e-10 | 94 |
| Page: 1 2 3 4 5 6 |
| Pathway ID | Tissue | Disease Stage | Description | Gene Ratio | Bg Ratio | pvalue | p.adjust | qvalue | Count |
| hsa0301321 | Esophagus | ESCC | Nucleocytoplasmic transport | 89/4205 | 108/8465 | 1.20e-12 | 2.37e-11 | 1.21e-11 | 89 |
| hsa0301331 | Esophagus | ESCC | Nucleocytoplasmic transport | 89/4205 | 108/8465 | 1.20e-12 | 2.37e-11 | 1.21e-11 | 89 |
| hsa03013 | Liver | HCC | Nucleocytoplasmic transport | 81/4020 | 108/8465 | 4.28e-09 | 6.83e-08 | 3.80e-08 | 81 |
| hsa030131 | Liver | HCC | Nucleocytoplasmic transport | 81/4020 | 108/8465 | 4.28e-09 | 6.83e-08 | 3.80e-08 | 81 |
| Page: 1 |
Top |
Cell-cell communication analysis |
| Identification of potential cell-cell interactions between two cell types and their ligand-receptor pairs for different disease states |
| Ligand | Receptor | LRpair | Pathway | Tissue | Disease Stage |
| Page: 1 |
Top |
Single-cell gene regulatory network inference analysis |
| Find out the significant the regulons (TFs) and the target genes of each regulon across cell types for different disease states |
| TF | Cell Type | Tissue | Disease Stage | Target Gene | RSS | Regulon Activity |
| ∗The dot plots of a searched regulon are shown for all cell subpopulations in each disease state of each tissue based on the regulon specific score inferred using pySCENIC and by calculating the average expression. |
| Page: 1 |
Top |
Somatic mutation of malignant transformation related genes |
| Annotation of somatic variants for genes involved in malignant transformation |
| Hugo Symbol | Variant Class | Variant Classification | dbSNP RS | HGVSc | HGVSp | HGVSp Short | SWISSPROT | BIOTYPE | SIFT | PolyPhen | Tumor Sample Barcode | Tissue | Histology | Sex | Age | Stage | Therapy Types | Drugs | Outcome |
| AAAS | SNV | Missense_Mutation | c.656N>C | p.Ile219Thr | p.I219T | Q9NRG9 | protein_coding | deleterious(0.01) | possibly_damaging(0.549) | TCGA-A8-A06P-01 | Breast | breast invasive carcinoma | Female | <65 | III/IV | Unspecific | SD | ||
| AAAS | SNV | Missense_Mutation | c.1109G>A | p.Gly370Glu | p.G370E | Q9NRG9 | protein_coding | tolerated(0.16) | probably_damaging(0.998) | TCGA-BH-A0HX-01 | Breast | breast invasive carcinoma | Female | <65 | I/II | Chemotherapy | adrimycin | SD | |
| AAAS | SNV | Missense_Mutation | rs886049649 | c.1498N>T | p.Arg500Trp | p.R500W | Q9NRG9 | protein_coding | deleterious_low_confidence(0.03) | benign(0) | TCGA-2W-A8YY-01 | Cervix | cervical & endocervical cancer | Female | <65 | I/II | Chemotherapy | cisplatin | CR |
| AAAS | SNV | Missense_Mutation | c.593C>T | p.Ser198Phe | p.S198F | Q9NRG9 | protein_coding | tolerated(0.48) | benign(0.121) | TCGA-JX-A3Q0-01 | Cervix | cervical & endocervical cancer | Female | <65 | III/IV | Unknown | Unknown | SD | |
| AAAS | SNV | Missense_Mutation | rs11540352 | c.212N>G | p.His71Arg | p.H71R | Q9NRG9 | protein_coding | tolerated(0.09) | benign(0.354) | TCGA-4N-A93T-01 | Colorectum | colon adenocarcinoma | Male | >=65 | III/IV | Chemotherapy | xeloda | SD |
| AAAS | SNV | Missense_Mutation | novel | c.745A>G | p.Ser249Gly | p.S249G | Q9NRG9 | protein_coding | deleterious(0) | benign(0.279) | TCGA-A6-3809-01 | Colorectum | colon adenocarcinoma | Female | >=65 | I/II | Unknown | Unknown | SD |
| AAAS | SNV | Missense_Mutation | c.839N>C | p.Val280Ala | p.V280A | Q9NRG9 | protein_coding | deleterious(0.02) | benign(0.108) | TCGA-A6-5665-01 | Colorectum | colon adenocarcinoma | Female | >=65 | I/II | Unknown | Unknown | PD | |
| AAAS | SNV | Missense_Mutation | c.1547N>T | p.Pro516Leu | p.P516L | Q9NRG9 | protein_coding | deleterious_low_confidence(0.01) | benign(0.023) | TCGA-AA-A022-01 | Colorectum | colon adenocarcinoma | Female | >=65 | I/II | Unknown | Unknown | SD | |
| AAAS | SNV | Missense_Mutation | c.259G>A | p.Val87Met | p.V87M | Q9NRG9 | protein_coding | tolerated(0.25) | benign(0) | TCGA-G4-6302-01 | Colorectum | colon adenocarcinoma | Female | >=65 | I/II | Unknown | Unknown | SD | |
| AAAS | SNV | Missense_Mutation | c.896N>T | p.Gly299Val | p.G299V | Q9NRG9 | protein_coding | deleterious(0) | probably_damaging(0.998) | TCGA-A5-A0G1-01 | Endometrium | uterine corpus endometrioid carcinoma | Female | >=65 | I/II | Unknown | Unknown | SD |
| Page: 1 2 3 4 5 6 |
Top |
Related drugs of malignant transformation related genes |
| Identification of chemicals and drugs interact with genes involved in malignant transfromation |
| (DGIdb 4.0) |
| Entrez ID | Symbol | Category | Interaction Types | Drug Claim Name | Drug Name | PMIDs |
| Page: 1 |

Copyright 2023-Present -The University of Texas Health Science Center at Houston |