
|
|||||
|
 | |
| |
| |
| |
| |
| |
|
Gene: A4GALT |
Gene summary for A4GALT |
| Gene information | Species | Human | Gene symbol | A4GALT | Gene ID | 53947 |
| Gene name | alpha 1,4-galactosyltransferase (P blood group) | |
| Gene Alias | A14GALT | |
| Cytomap | 22q13.2 | |
| Gene Type | protein-coding | GO ID | GO:0001575 | UniProtAcc | A0A0S2Z5J1 |
Top |
Malignant transformation analysis |
| Identification of the aberrant gene expression in precancerous and cancerous lesions by comparing the gene expression of stem-like cells in diseased tissues with normal stem cells |
| Entrez ID | Symbol | Replicates | Species | Organ | Tissue | Adj P-value | Log2FC | Malignancy |
| 53947 | A4GALT | LZE4T | Human | Esophagus | ESCC | 3.57e-04 | 1.05e-01 | 0.0811 |
| 53947 | A4GALT | LZE5T | Human | Esophagus | ESCC | 7.40e-09 | 7.31e-01 | 0.0514 |
| 53947 | A4GALT | LZE7T | Human | Esophagus | ESCC | 1.34e-05 | 3.99e-01 | 0.0667 |
| 53947 | A4GALT | LZE8T | Human | Esophagus | ESCC | 9.83e-09 | 3.39e-01 | 0.067 |
| 53947 | A4GALT | LZE20T | Human | Esophagus | ESCC | 7.16e-06 | 2.75e-01 | 0.0662 |
| 53947 | A4GALT | LZE22T | Human | Esophagus | ESCC | 4.16e-05 | 4.91e-01 | 0.068 |
| 53947 | A4GALT | LZE24T | Human | Esophagus | ESCC | 4.95e-32 | 1.01e+00 | 0.0596 |
| 53947 | A4GALT | LZE21T | Human | Esophagus | ESCC | 3.12e-08 | 9.25e-01 | 0.0655 |
| 53947 | A4GALT | P1T-E | Human | Esophagus | ESCC | 2.56e-11 | 6.90e-01 | 0.0875 |
| 53947 | A4GALT | P2T-E | Human | Esophagus | ESCC | 4.69e-04 | 1.70e-01 | 0.1177 |
| 53947 | A4GALT | P4T-E | Human | Esophagus | ESCC | 1.28e-12 | 4.29e-01 | 0.1323 |
| 53947 | A4GALT | P5T-E | Human | Esophagus | ESCC | 5.30e-37 | 7.45e-01 | 0.1327 |
| 53947 | A4GALT | P8T-E | Human | Esophagus | ESCC | 3.41e-34 | 6.82e-01 | 0.0889 |
| 53947 | A4GALT | P9T-E | Human | Esophagus | ESCC | 3.64e-55 | 1.17e+00 | 0.1131 |
| 53947 | A4GALT | P11T-E | Human | Esophagus | ESCC | 8.13e-06 | 3.55e-01 | 0.1426 |
| 53947 | A4GALT | P12T-E | Human | Esophagus | ESCC | 1.41e-49 | 1.45e+00 | 0.1122 |
| 53947 | A4GALT | P15T-E | Human | Esophagus | ESCC | 2.76e-18 | 5.61e-01 | 0.1149 |
| 53947 | A4GALT | P17T-E | Human | Esophagus | ESCC | 7.59e-07 | 4.49e-01 | 0.1278 |
| 53947 | A4GALT | P20T-E | Human | Esophagus | ESCC | 4.66e-22 | 5.97e-01 | 0.1124 |
| 53947 | A4GALT | P21T-E | Human | Esophagus | ESCC | 3.05e-24 | 5.53e-01 | 0.1617 |
| Page: 1 2 3 4 |
| Tissue | Expression Dynamics | Abbreviation |
| Esophagus | 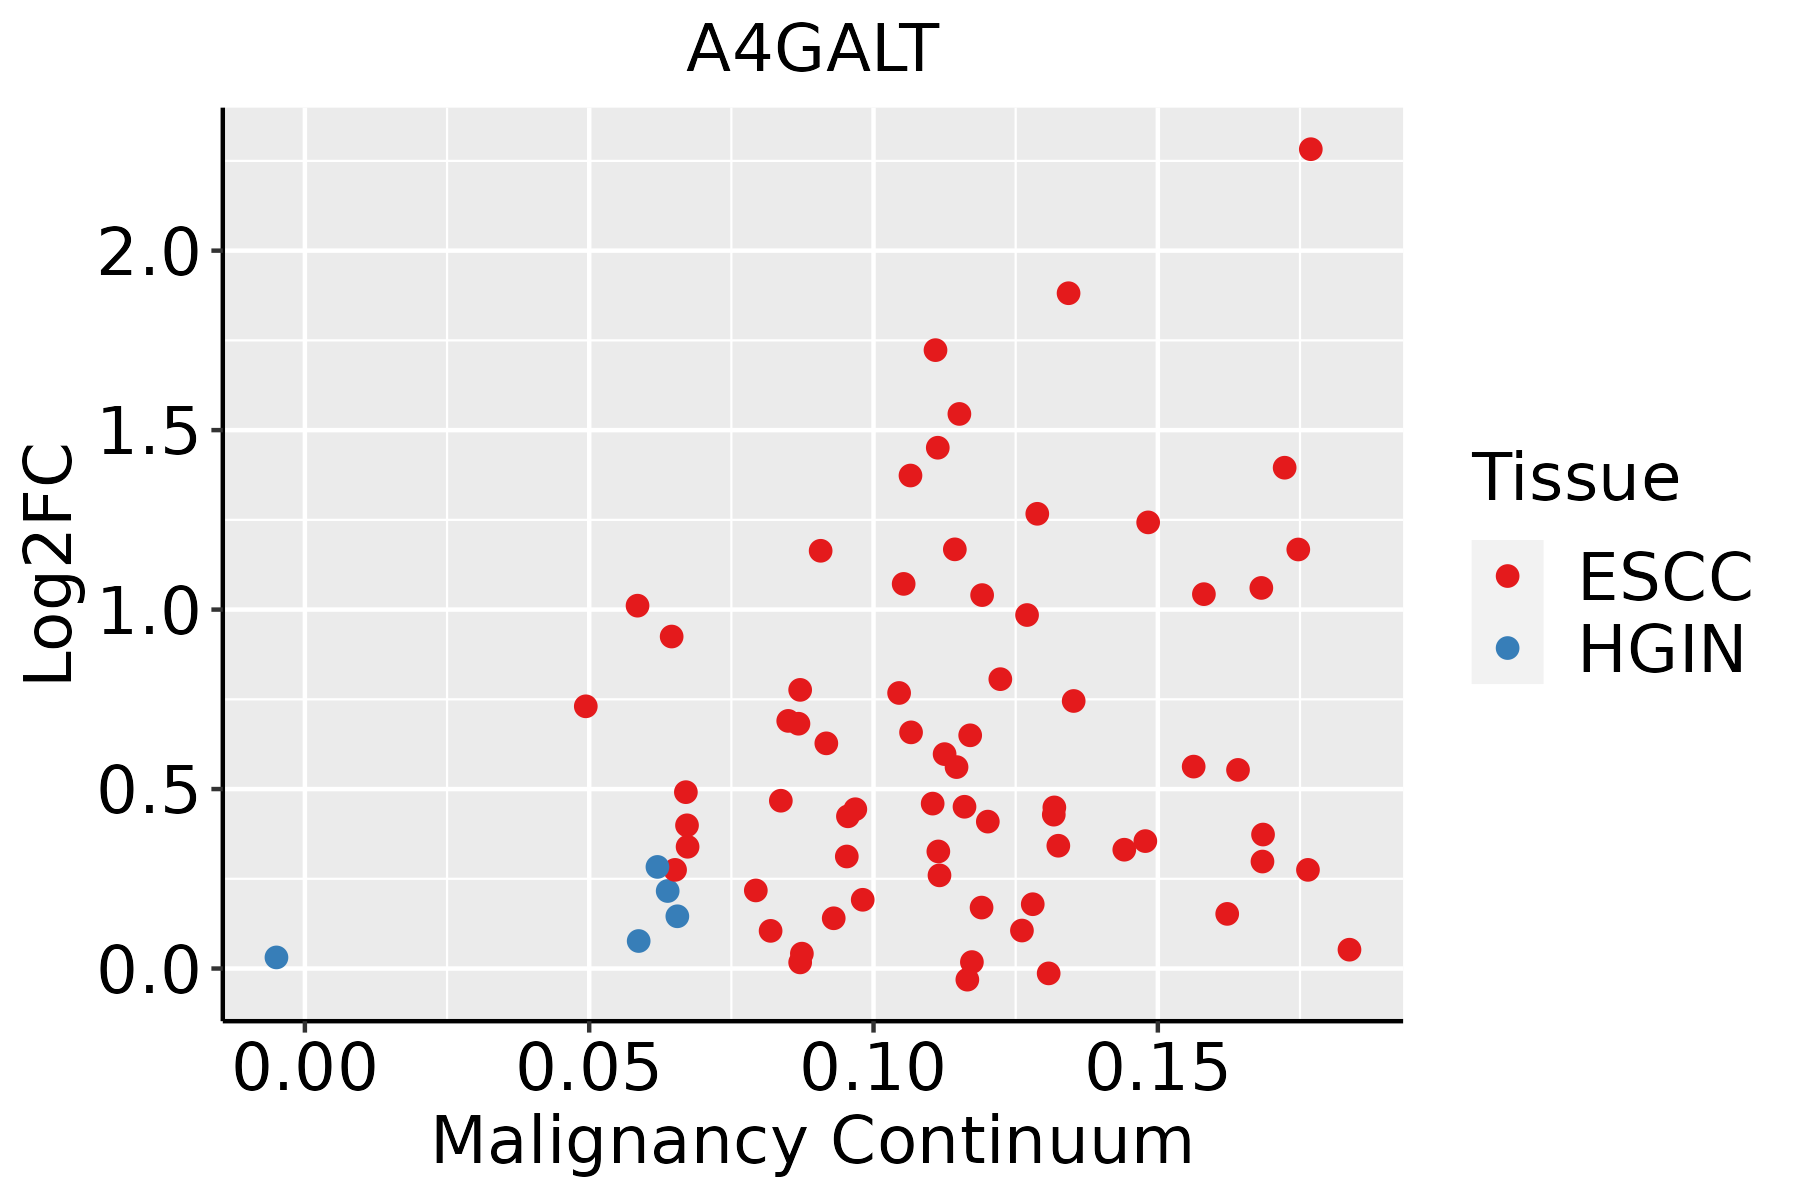 | ESCC: Esophageal squamous cell carcinoma |
| HGIN: High-grade intraepithelial neoplasias | ||
| LGIN: Low-grade intraepithelial neoplasias | ||
| Oral Cavity | 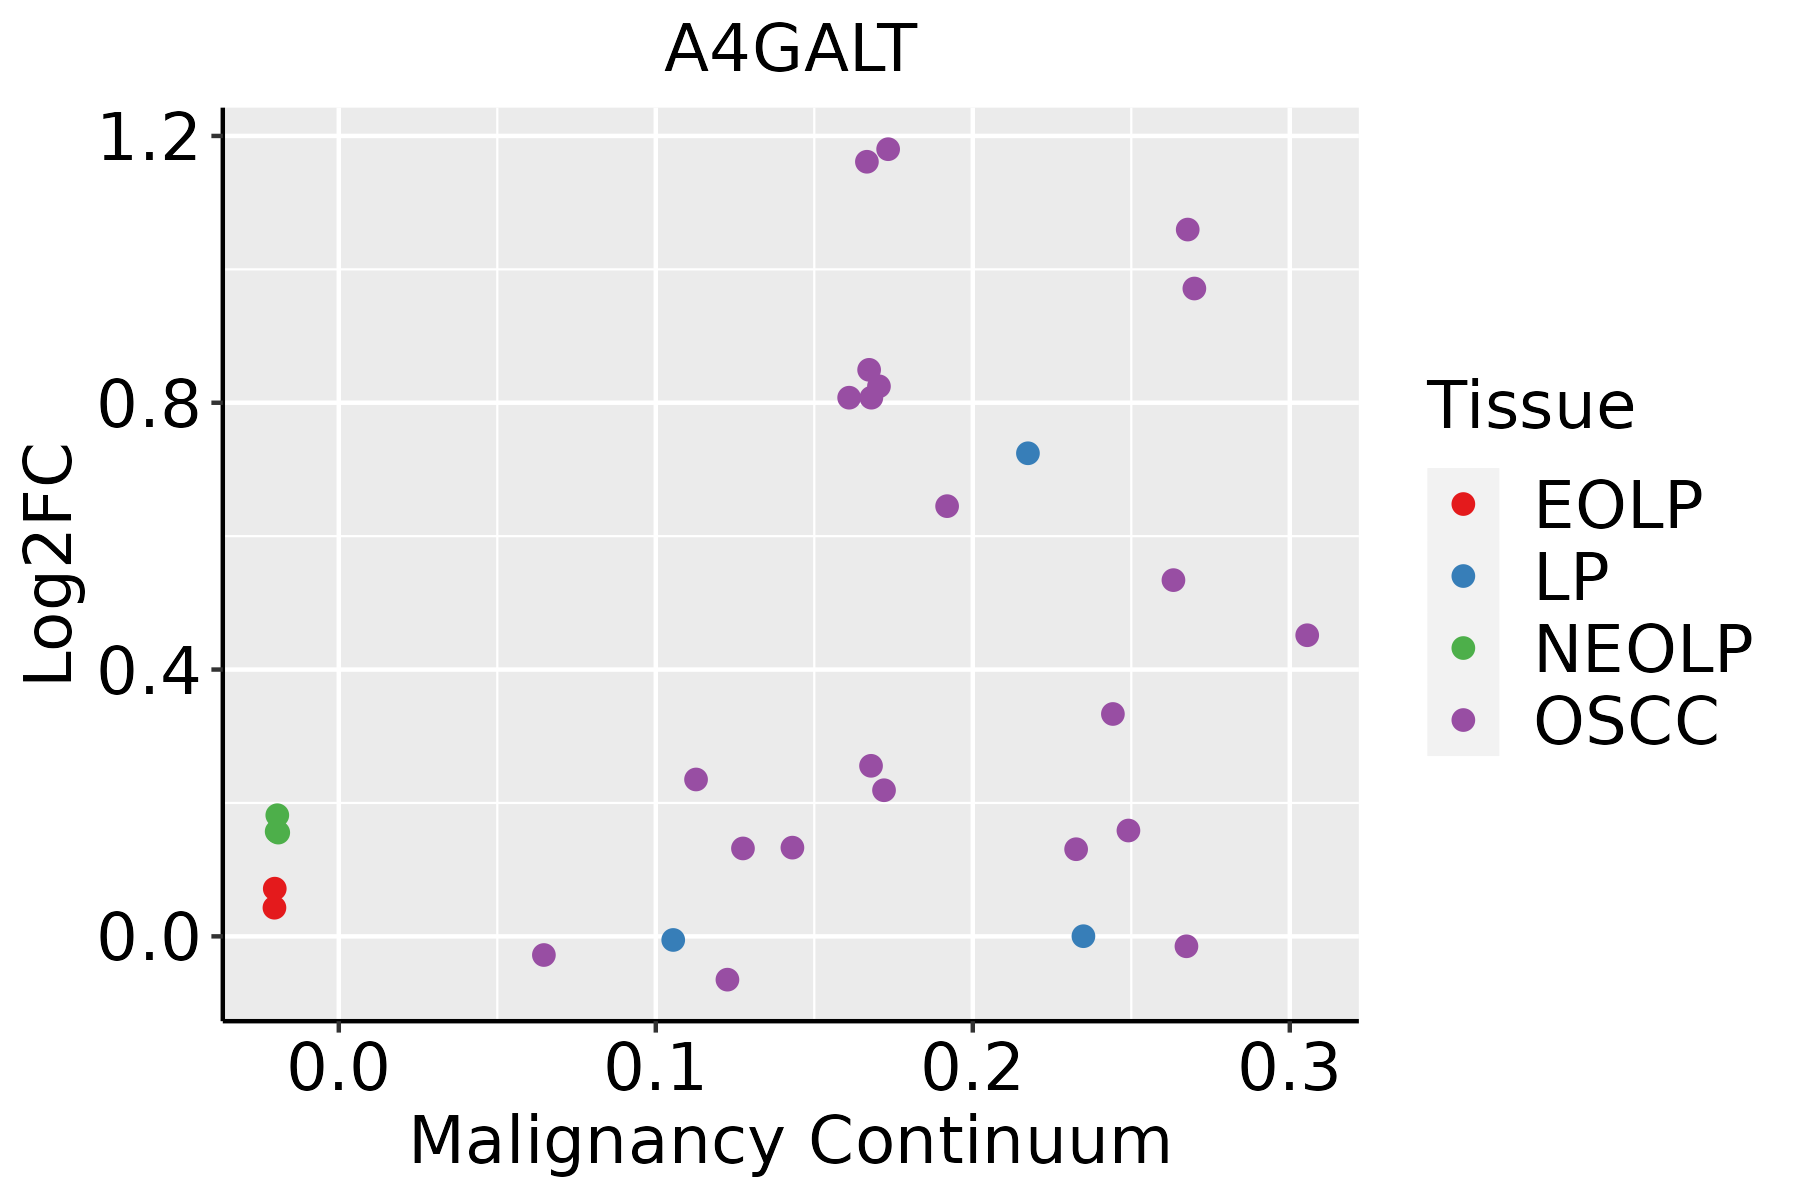 | EOLP: Erosive Oral lichen planus |
| LP: leukoplakia | ||
| NEOLP: Non-erosive oral lichen planus | ||
| OSCC: Oral squamous cell carcinoma |
| ∗log2FC in expression of this searched gene in stem-like cells from each diseased tissue sample relative to stem-like cells in normal samples in each tissue plotted against the malignancy continuum. Samples are colored based on if they are from different disease stage. |
Top |
Malignant transformation related pathway analysis |
| Find out the enriched GO biological processes and KEGG pathways involved in transition from healthy to precancer to cancer |
| Tissue | Disease Stage | Enriched GO biological Processes |
| Colorectum | AD |  |
| Colorectum | SER |  |
| Colorectum | MSS |  |
| Colorectum | MSI-H |  |
| Colorectum | FAP |  |
| ∗Top 15 enriched GO BP terms are showed in the bar plot of each disease state in each tissue. Each row represents a significant GO biological process which is colored according to the -log10(p.adjust). |
| Page: 1 2 3 4 5 6 7 8 9 |
| GO ID | Tissue | Disease Stage | Description | Gene Ratio | Bg Ratio | pvalue | p.adjust | Count |
| GO:00066433 | Esophagus | ESCC | membrane lipid metabolic process | 130/8552 | 203/18723 | 9.29e-08 | 1.54e-06 | 130 |
| GO:00464673 | Esophagus | ESCC | membrane lipid biosynthetic process | 91/8552 | 142/18723 | 7.19e-06 | 7.19e-05 | 91 |
| GO:00066652 | Esophagus | ESCC | sphingolipid metabolic process | 96/8552 | 155/18723 | 3.21e-05 | 2.66e-04 | 96 |
| GO:00066642 | Esophagus | ESCC | glycolipid metabolic process | 63/8552 | 100/18723 | 3.55e-04 | 2.06e-03 | 63 |
| GO:19035092 | Esophagus | ESCC | liposaccharide metabolic process | 63/8552 | 101/18723 | 5.25e-04 | 2.90e-03 | 63 |
| GO:00301481 | Esophagus | ESCC | sphingolipid biosynthetic process | 62/8552 | 103/18723 | 2.10e-03 | 9.38e-03 | 62 |
| GO:0009247 | Esophagus | ESCC | glycolipid biosynthetic process | 42/8552 | 68/18723 | 5.48e-03 | 2.05e-02 | 42 |
| GO:00066432 | Oral cavity | OSCC | membrane lipid metabolic process | 111/7305 | 203/18723 | 4.02e-06 | 4.69e-05 | 111 |
| GO:00066651 | Oral cavity | OSCC | sphingolipid metabolic process | 84/7305 | 155/18723 | 8.64e-05 | 6.61e-04 | 84 |
| GO:00464672 | Oral cavity | OSCC | membrane lipid biosynthetic process | 77/7305 | 142/18723 | 1.63e-04 | 1.13e-03 | 77 |
| GO:00066641 | Oral cavity | OSCC | glycolipid metabolic process | 53/7305 | 100/18723 | 3.09e-03 | 1.33e-02 | 53 |
| GO:19035091 | Oral cavity | OSCC | liposaccharide metabolic process | 53/7305 | 101/18723 | 4.06e-03 | 1.66e-02 | 53 |
| GO:0030148 | Oral cavity | OSCC | sphingolipid biosynthetic process | 53/7305 | 103/18723 | 6.81e-03 | 2.53e-02 | 53 |
| Page: 1 |
| Pathway ID | Tissue | Disease Stage | Description | Gene Ratio | Bg Ratio | pvalue | p.adjust | qvalue | Count |
| Page: 1 |
Top |
Cell-cell communication analysis |
| Identification of potential cell-cell interactions between two cell types and their ligand-receptor pairs for different disease states |
| Ligand | Receptor | LRpair | Pathway | Tissue | Disease Stage |
| Page: 1 |
Top |
Single-cell gene regulatory network inference analysis |
| Find out the significant the regulons (TFs) and the target genes of each regulon across cell types for different disease states |
| TF | Cell Type | Tissue | Disease Stage | Target Gene | RSS | Regulon Activity |
| ∗The dot plots of a searched regulon are shown for all cell subpopulations in each disease state of each tissue based on the regulon specific score inferred using pySCENIC and by calculating the average expression. |
| Page: 1 |
Top |
Somatic mutation of malignant transformation related genes |
| Annotation of somatic variants for genes involved in malignant transformation |
| Hugo Symbol | Variant Class | Variant Classification | dbSNP RS | HGVSc | HGVSp | HGVSp Short | SWISSPROT | BIOTYPE | SIFT | PolyPhen | Tumor Sample Barcode | Tissue | Histology | Sex | Age | Stage | Therapy Types | Drugs | Outcome |
| A4GALT | insertion | Frame_Shift_Ins | rs756055465 | c.15_16insC | p.Asp6ArgfsTer49 | p.D6Rfs*49 | Q9NPC4 | protein_coding | TCGA-S3-AA0Z-01 | Breast | breast invasive carcinoma | Female | <65 | I/II | Ancillary | neulasta | CR | ||
| A4GALT | SNV | Missense_Mutation | novel | c.957N>T | p.Lys319Asn | p.K319N | Q9NPC4 | protein_coding | tolerated(0.13) | possibly_damaging(0.681) | TCGA-VS-A94W-01 | Cervix | cervical & endocervical cancer | Female | <65 | I/II | Chemotherapy | cisplatin | CR |
| A4GALT | insertion | Frame_Shift_Ins | novel | c.169_170insGG | p.Ala57GlyfsTer9 | p.A57Gfs*9 | Q9NPC4 | protein_coding | TCGA-DS-A1OB-01 | Cervix | cervical & endocervical cancer | Female | <65 | I/II | Chemotherapy | carboplatin | PD | ||
| A4GALT | SNV | Missense_Mutation | novel | c.1006N>A | p.Gln336Lys | p.Q336K | Q9NPC4 | protein_coding | tolerated(0.14) | benign(0.427) | TCGA-A6-5665-01 | Colorectum | colon adenocarcinoma | Female | >=65 | I/II | Unknown | Unknown | PD |
| A4GALT | SNV | Missense_Mutation | c.655N>A | p.Ala219Thr | p.A219T | Q9NPC4 | protein_coding | deleterious(0.01) | probably_damaging(0.962) | TCGA-AA-3667-01 | Colorectum | colon adenocarcinoma | Female | <65 | I/II | Unknown | Unknown | SD | |
| A4GALT | SNV | Missense_Mutation | c.769N>T | p.Val257Phe | p.V257F | Q9NPC4 | protein_coding | deleterious(0) | possibly_damaging(0.867) | TCGA-AA-3947-01 | Colorectum | colon adenocarcinoma | Female | <65 | I/II | Unknown | Unknown | SD | |
| A4GALT | SNV | Missense_Mutation | rs750440854 | c.364N>A | p.Ala122Thr | p.A122T | Q9NPC4 | protein_coding | tolerated(0.31) | benign(0.019) | TCGA-AA-A022-01 | Colorectum | colon adenocarcinoma | Female | >=65 | I/II | Unknown | Unknown | SD |
| A4GALT | SNV | Missense_Mutation | c.926N>C | p.Ser309Thr | p.S309T | Q9NPC4 | protein_coding | deleterious(0.02) | benign(0.026) | TCGA-AD-6888-01 | Colorectum | colon adenocarcinoma | Male | >=65 | III/IV | Unknown | Unknown | PD | |
| A4GALT | SNV | Missense_Mutation | rs750737826 | c.517N>A | p.Val173Met | p.V173M | Q9NPC4 | protein_coding | deleterious(0) | possibly_damaging(0.874) | TCGA-AZ-6598-01 | Colorectum | colon adenocarcinoma | Female | >=65 | I/II | Unknown | Unknown | SD |
| A4GALT | SNV | Missense_Mutation | rs779713387 | c.620N>G | p.Val207Gly | p.V207G | Q9NPC4 | protein_coding | deleterious(0.02) | benign(0.042) | TCGA-F4-6570-01 | Colorectum | colon adenocarcinoma | Female | >=65 | I/II | Unknown | Unknown | SD |
| Page: 1 2 3 4 |
Top |
Related drugs of malignant transformation related genes |
| Identification of chemicals and drugs interact with genes involved in malignant transfromation |
| (DGIdb 4.0) |
| Entrez ID | Symbol | Category | Interaction Types | Drug Claim Name | Drug Name | PMIDs |
| Page: 1 |

Copyright 2023-Present -The University of Texas Health Science Center at Houston |