
|
|||||
|
 | |
| |
| |
| |
| |
| |
|
Gene: A2M |
Gene summary for A2M |
| Gene information | Species | Human | Gene symbol | A2M | Gene ID | 2 |
| Gene name | alpha-2-macroglobulin | |
| Gene Alias | A2MD | |
| Cytomap | 12p13.31 | |
| Gene Type | protein-coding | GO ID | GO:0001867 | UniProtAcc | P01023 |
Top |
Malignant transformation analysis |
| Identification of the aberrant gene expression in precancerous and cancerous lesions by comparing the gene expression of stem-like cells in diseased tissues with normal stem cells |
| Entrez ID | Symbol | Replicates | Species | Organ | Tissue | Adj P-value | Log2FC | Malignancy |
| 2 | A2M | EEC-subject2 | Human | Endometrium | EEC | 1.28e-03 | -1.04e-01 | -0.2607 |
| 2 | A2M | EEC-subject3 | Human | Endometrium | EEC | 4.01e-05 | 2.28e-01 | -0.2525 |
| 2 | A2M | GSM6177621_NYU_UCEC2_lib1_lib1 | Human | Endometrium | EEC | 4.86e-03 | -4.40e-02 | -0.1934 |
| 2 | A2M | GSM6177622_NYU_UCEC3_lib1_lib1 | Human | Endometrium | EEC | 1.89e-07 | -1.44e-01 | -0.1917 |
| 2 | A2M | GSM6177622_NYU_UCEC3_lib2_lib2 | Human | Endometrium | EEC | 2.08e-03 | -1.44e-01 | -0.1916 |
| 2 | A2M | GSM6177623_NYU_UCEC3_Vis | Human | Endometrium | EEC | 5.96e-24 | 6.34e-01 | -0.1269 |
| 2 | A2M | NAFLD1 | Human | Liver | NAFLD | 3.20e-11 | 1.18e+00 | -0.04 |
| 2 | A2M | S41 | Human | Liver | Cirrhotic | 1.84e-11 | 1.12e+00 | -0.0343 |
| 2 | A2M | S43 | Human | Liver | Cirrhotic | 1.00e-14 | 6.63e-01 | -0.0187 |
| 2 | A2M | HCC1_Meng | Human | Liver | HCC | 4.09e-89 | 2.27e-01 | 0.0246 |
| 2 | A2M | HCC2_Meng | Human | Liver | HCC | 4.99e-16 | -5.66e-01 | 0.0107 |
| 2 | A2M | cirrhotic1 | Human | Liver | Cirrhotic | 9.33e-06 | -3.62e-01 | 0.0202 |
| 2 | A2M | cirrhotic2 | Human | Liver | Cirrhotic | 2.26e-07 | -9.72e-03 | 0.0201 |
| 2 | A2M | cirrhotic3 | Human | Liver | Cirrhotic | 1.79e-17 | 1.01e-01 | 0.0215 |
| 2 | A2M | HCC1 | Human | Liver | HCC | 3.79e-15 | 5.66e+00 | 0.5336 |
| 2 | A2M | HCC2 | Human | Liver | HCC | 4.30e-36 | 6.87e+00 | 0.5341 |
| 2 | A2M | HCC5 | Human | Liver | HCC | 1.90e-03 | 4.16e+00 | 0.4932 |
| 2 | A2M | Pt13.a | Human | Liver | HCC | 6.12e-03 | 2.15e-02 | 0.021 |
| 2 | A2M | Pt13.b | Human | Liver | HCC | 3.44e-31 | 1.61e-01 | 0.0251 |
| 2 | A2M | Pt14.a | Human | Liver | HCC | 2.28e-17 | 5.73e-01 | 0.0169 |
| Page: 1 2 |
| Tissue | Expression Dynamics | Abbreviation |
| Endometrium | 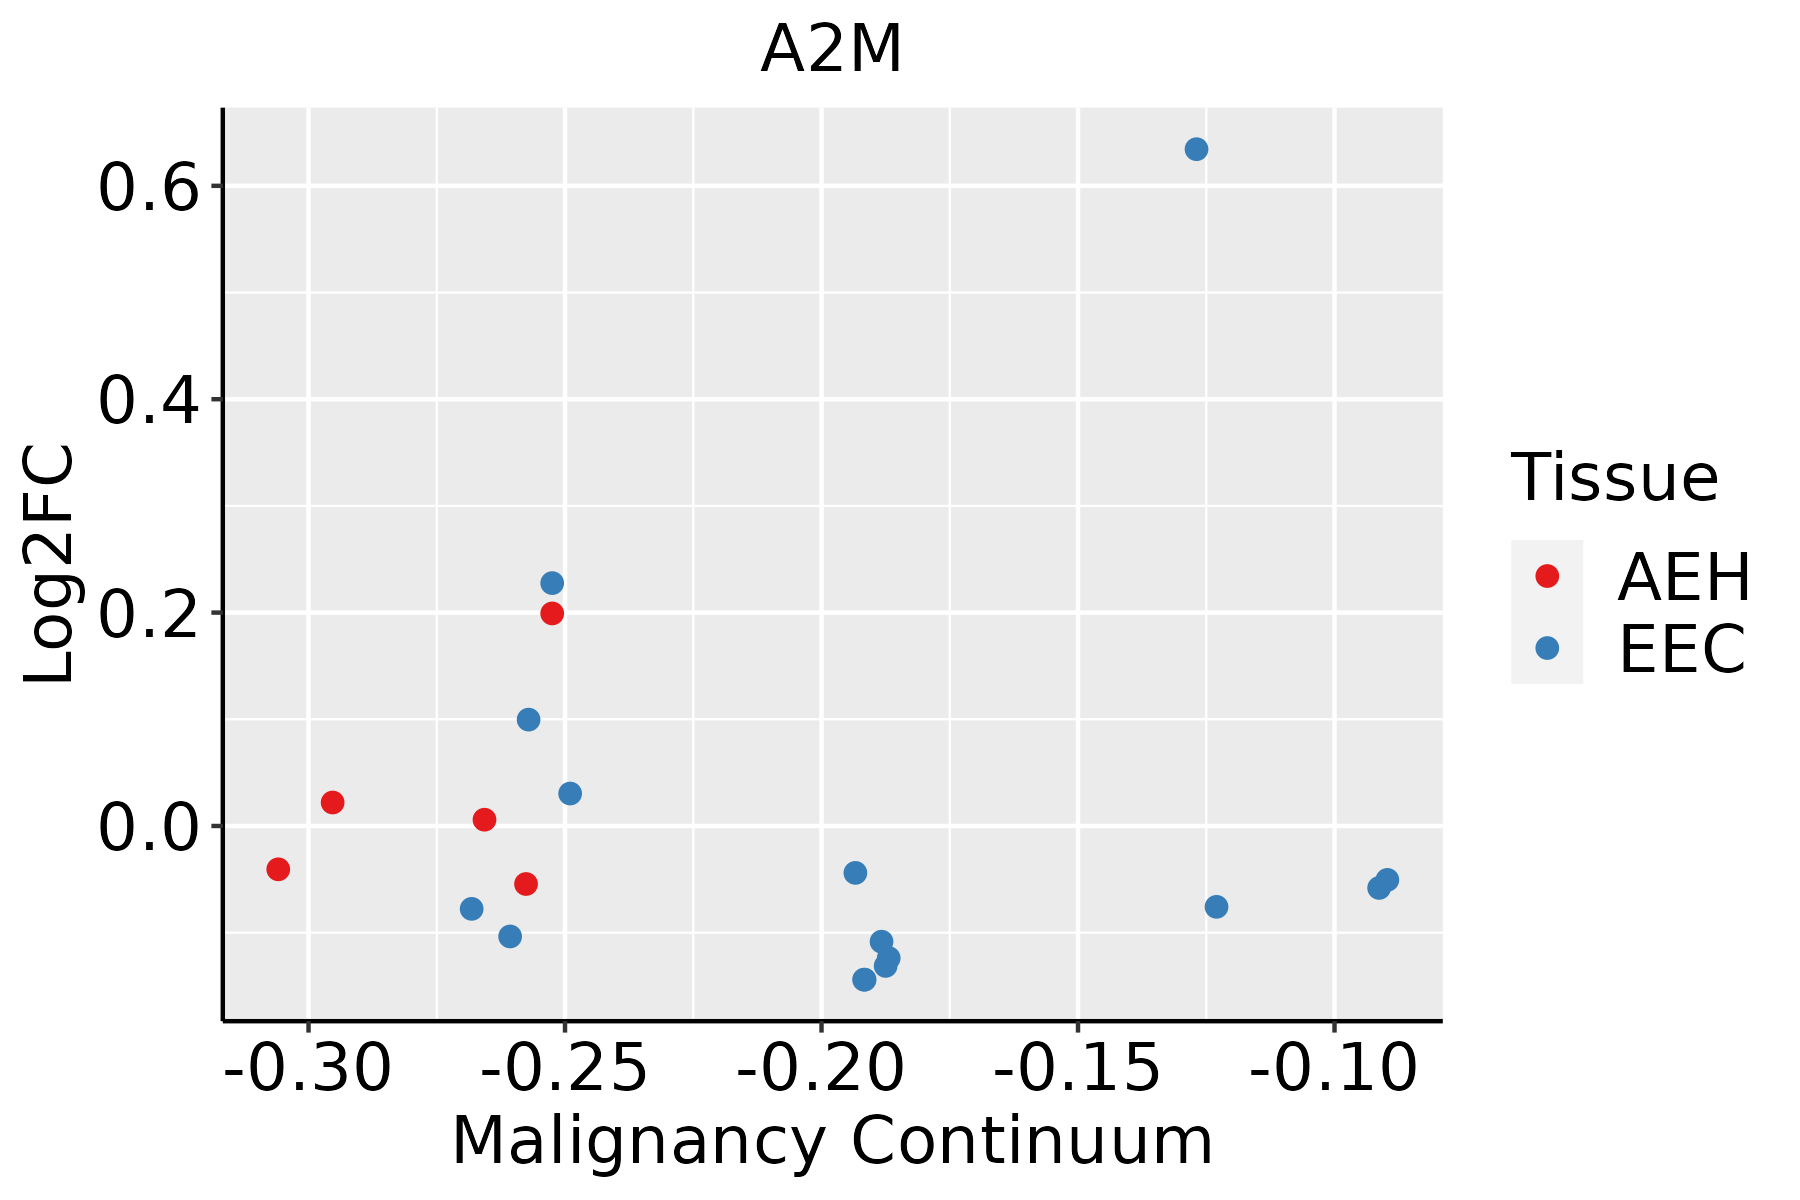 | AEH: Atypical endometrial hyperplasia |
| EEC: Endometrioid Cancer | ||
| Liver | 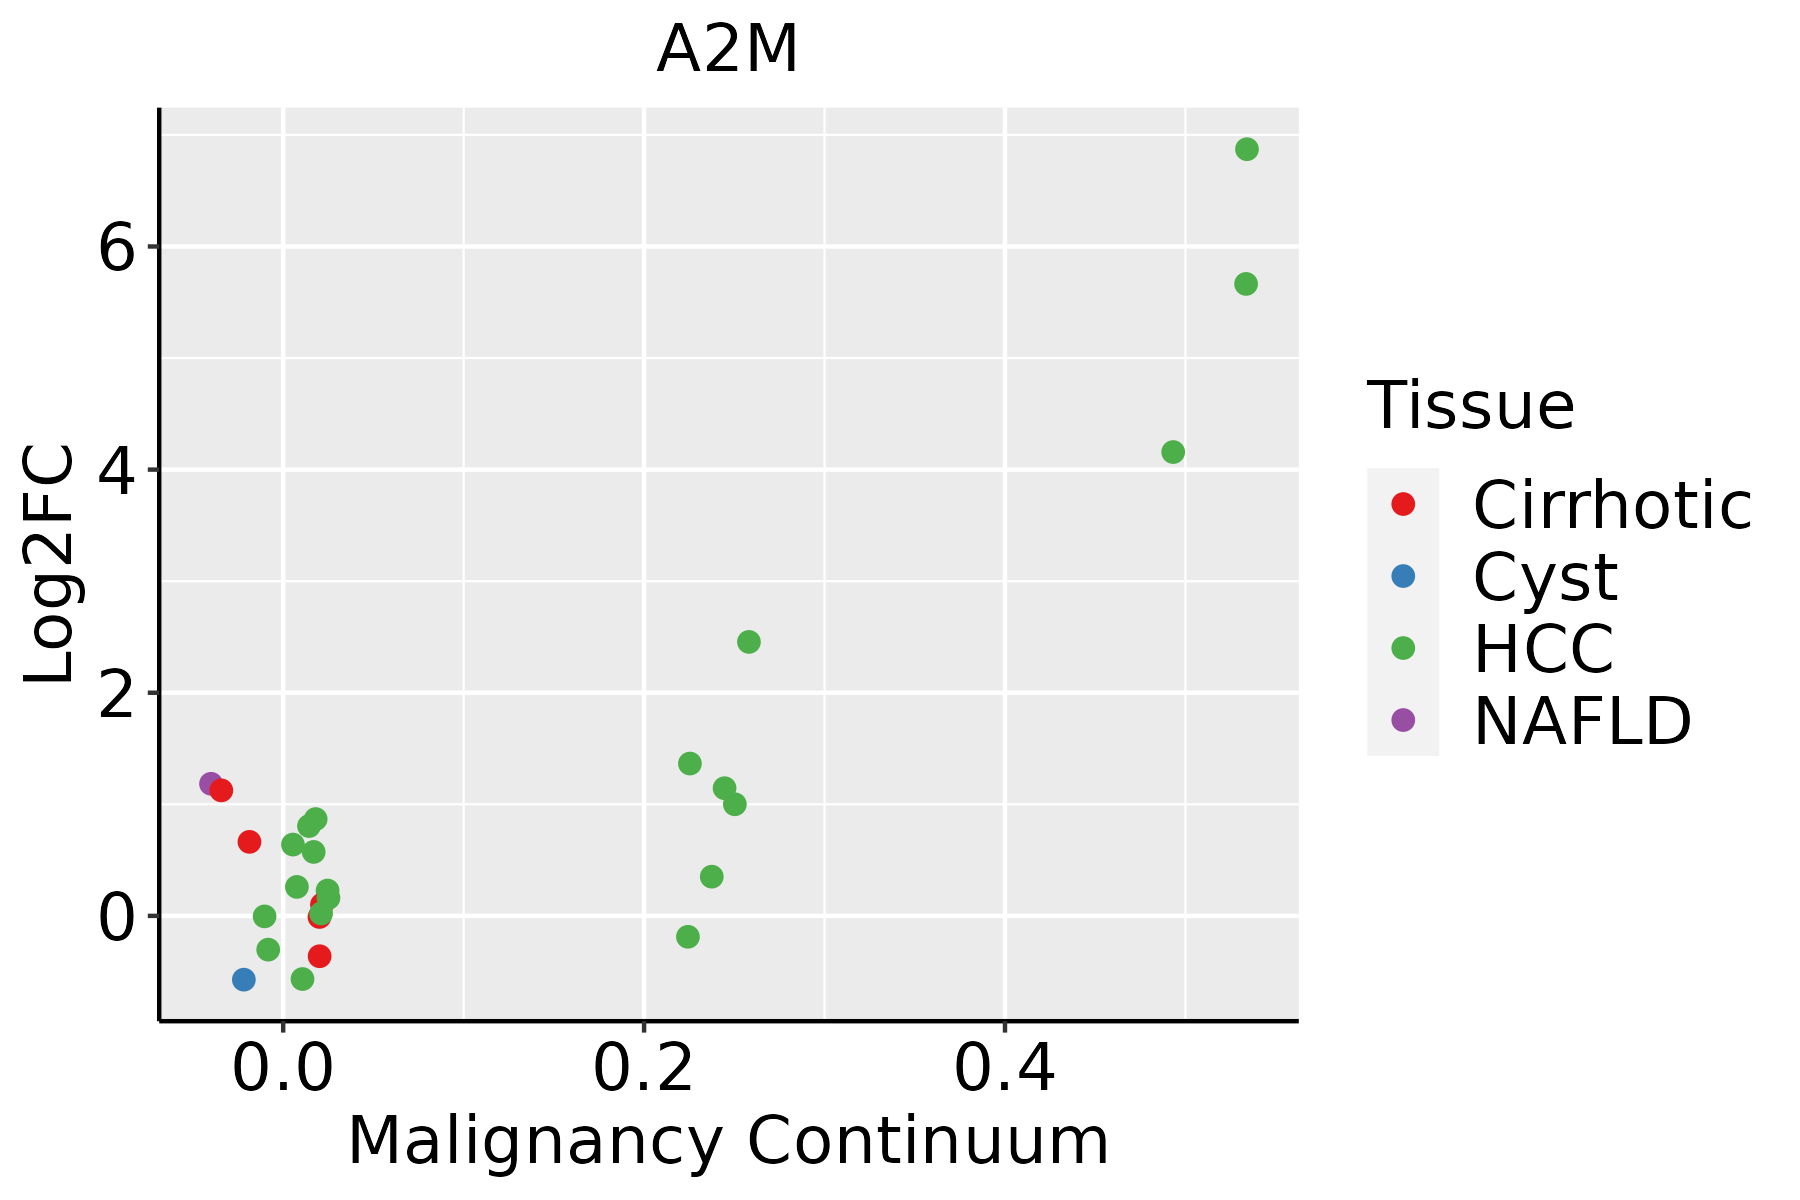 | HCC: Hepatocellular carcinoma |
| NAFLD: Non-alcoholic fatty liver disease |
| ∗log2FC in expression of this searched gene in stem-like cells from each diseased tissue sample relative to stem-like cells in normal samples in each tissue plotted against the malignancy continuum. Samples are colored based on if they are from different disease stage. |
Top |
Malignant transformation related pathway analysis |
| Find out the enriched GO biological processes and KEGG pathways involved in transition from healthy to precancer to cancer |
| Tissue | Disease Stage | Enriched GO biological Processes |
| Colorectum | AD |  |
| Colorectum | SER |  |
| Colorectum | MSS |  |
| Colorectum | MSI-H |  |
| Colorectum | FAP |  |
| ∗Top 15 enriched GO BP terms are showed in the bar plot of each disease state in each tissue. Each row represents a significant GO biological process which is colored according to the -log10(p.adjust). |
| Page: 1 2 3 4 5 6 7 8 9 |
| GO ID | Tissue | Disease Stage | Description | Gene Ratio | Bg Ratio | pvalue | p.adjust | Count |
| GO:005254710 | Cervix | CC | regulation of peptidase activity | 112/2311 | 461/18723 | 6.70e-13 | 3.08e-10 | 112 |
| GO:005254810 | Cervix | CC | regulation of endopeptidase activity | 103/2311 | 432/18723 | 1.89e-11 | 5.14e-09 | 103 |
| GO:004586110 | Cervix | CC | negative regulation of proteolysis | 80/2311 | 351/18723 | 2.88e-08 | 1.98e-06 | 80 |
| GO:00513469 | Cervix | CC | negative regulation of hydrolase activity | 81/2311 | 379/18723 | 4.27e-07 | 1.67e-05 | 81 |
| GO:00104669 | Cervix | CC | negative regulation of peptidase activity | 60/2311 | 262/18723 | 1.27e-06 | 4.34e-05 | 60 |
| GO:001095110 | Cervix | CC | negative regulation of endopeptidase activity | 56/2311 | 252/18723 | 7.43e-06 | 1.74e-04 | 56 |
| GO:005254715 | Cervix | HSIL_HPV | regulation of peptidase activity | 52/737 | 461/18723 | 8.35e-12 | 6.81e-09 | 52 |
| GO:005254815 | Cervix | HSIL_HPV | regulation of endopeptidase activity | 48/737 | 432/18723 | 9.20e-11 | 3.70e-08 | 48 |
| GO:004586115 | Cervix | HSIL_HPV | negative regulation of proteolysis | 36/737 | 351/18723 | 1.64e-07 | 1.02e-05 | 36 |
| GO:001046614 | Cervix | HSIL_HPV | negative regulation of peptidase activity | 30/737 | 262/18723 | 1.66e-07 | 1.03e-05 | 30 |
| GO:001095113 | Cervix | HSIL_HPV | negative regulation of endopeptidase activity | 29/737 | 252/18723 | 2.39e-07 | 1.44e-05 | 29 |
| GO:005134614 | Cervix | HSIL_HPV | negative regulation of hydrolase activity | 37/737 | 379/18723 | 3.81e-07 | 2.06e-05 | 37 |
| GO:005254717 | Endometrium | EEC | regulation of peptidase activity | 91/2168 | 461/18723 | 2.00e-07 | 8.93e-06 | 91 |
| GO:004586117 | Endometrium | EEC | negative regulation of proteolysis | 72/2168 | 351/18723 | 8.46e-07 | 2.98e-05 | 72 |
| GO:005254817 | Endometrium | EEC | regulation of endopeptidase activity | 82/2168 | 432/18723 | 3.96e-06 | 1.04e-04 | 82 |
| GO:005134615 | Endometrium | EEC | negative regulation of hydrolase activity | 72/2168 | 379/18723 | 1.46e-05 | 2.87e-04 | 72 |
| GO:004886314 | Endometrium | EEC | stem cell differentiation | 43/2168 | 206/18723 | 8.48e-05 | 1.21e-03 | 43 |
| GO:001046615 | Endometrium | EEC | negative regulation of peptidase activity | 49/2168 | 262/18723 | 4.64e-04 | 4.79e-03 | 49 |
| GO:001095114 | Endometrium | EEC | negative regulation of endopeptidase activity | 47/2168 | 252/18723 | 6.37e-04 | 6.25e-03 | 47 |
| GO:000268313 | Endometrium | EEC | negative regulation of immune system process | 72/2168 | 434/18723 | 1.04e-03 | 9.13e-03 | 72 |
| Page: 1 2 3 4 |
| Pathway ID | Tissue | Disease Stage | Description | Gene Ratio | Bg Ratio | pvalue | p.adjust | qvalue | Count |
| hsa046104 | Liver | HCC | Complement and coagulation cascades | 57/4020 | 86/8465 | 3.19e-04 | 1.45e-03 | 8.04e-04 | 57 |
| hsa046105 | Liver | HCC | Complement and coagulation cascades | 57/4020 | 86/8465 | 3.19e-04 | 1.45e-03 | 8.04e-04 | 57 |
| Page: 1 |
Top |
Cell-cell communication analysis |
| Identification of potential cell-cell interactions between two cell types and their ligand-receptor pairs for different disease states |
| Ligand | Receptor | LRpair | Pathway | Tissue | Disease Stage |
| Page: 1 |
Top |
Single-cell gene regulatory network inference analysis |
| Find out the significant the regulons (TFs) and the target genes of each regulon across cell types for different disease states |
| TF | Cell Type | Tissue | Disease Stage | Target Gene | RSS | Regulon Activity |
| ∗The dot plots of a searched regulon are shown for all cell subpopulations in each disease state of each tissue based on the regulon specific score inferred using pySCENIC and by calculating the average expression. |
| Page: 1 |
Top |
Somatic mutation of malignant transformation related genes |
| Annotation of somatic variants for genes involved in malignant transformation |
| Hugo Symbol | Variant Class | Variant Classification | dbSNP RS | HGVSc | HGVSp | HGVSp Short | SWISSPROT | BIOTYPE | SIFT | PolyPhen | Tumor Sample Barcode | Tissue | Histology | Sex | Age | Stage | Therapy Types | Drugs | Outcome |
| A2M | SNV | Missense_Mutation | novel | c.2257N>A | p.Glu753Lys | p.E753K | P01023 | protein_coding | deleterious(0.01) | probably_damaging(0.981) | TCGA-3C-AALI-01 | Breast | breast invasive carcinoma | Female | <65 | I/II | Unspecific | Poly E | Complete Response |
| A2M | SNV | Missense_Mutation | rs774076635 | c.526G>A | p.Ala176Thr | p.A176T | P01023 | protein_coding | tolerated(0.13) | benign(0.025) | TCGA-AN-A0AK-01 | Breast | breast invasive carcinoma | Female | >=65 | I/II | Unknown | Unknown | SD |
| A2M | SNV | Missense_Mutation | rs200527343 | c.3103N>G | p.Asn1035Asp | p.N1035D | P01023 | protein_coding | tolerated(0.2) | benign(0.007) | TCGA-AO-A0JB-01 | Breast | breast invasive carcinoma | Female | <65 | III/IV | Chemotherapy | cyclophosphamide | SD |
| A2M | SNV | Missense_Mutation | rs774772832 | c.1310T>G | p.Val437Gly | p.V437G | P01023 | protein_coding | deleterious(0.02) | benign(0.439) | TCGA-BH-A0BR-01 | Breast | breast invasive carcinoma | Female | <65 | I/II | Unknown | Unknown | SD |
| A2M | SNV | Missense_Mutation | c.3164N>G | p.Tyr1055Cys | p.Y1055C | P01023 | protein_coding | deleterious(0) | probably_damaging(0.964) | TCGA-BH-A18H-01 | Breast | breast invasive carcinoma | Female | <65 | I/II | Chemotherapy | adriamycin | CR | |
| A2M | SNV | Missense_Mutation | rs774772832 | c.1310T>G | p.Val437Gly | p.V437G | P01023 | protein_coding | deleterious(0.02) | benign(0.439) | TCGA-EW-A1IW-01 | Breast | breast invasive carcinoma | Female | >=65 | I/II | Hormone Therapy | aromasin | SD |
| A2M | SNV | Missense_Mutation | c.118N>G | p.His40Asp | p.H40D | P01023 | protein_coding | deleterious(0) | possibly_damaging(0.67) | TCGA-EW-A1PB-01 | Breast | breast invasive carcinoma | Female | >=65 | III/IV | Unknown | Unknown | SD | |
| A2M | SNV | Missense_Mutation | rs200527343 | c.3103N>G | p.Asn1035Asp | p.N1035D | P01023 | protein_coding | tolerated(0.2) | benign(0.007) | TCGA-EW-A1PH-01 | Breast | breast invasive carcinoma | Female | <65 | I/II | Chemotherapy | cyclophosphamide | SD |
| A2M | SNV | Missense_Mutation | rs769791745 | c.976N>G | p.Ile326Val | p.I326V | P01023 | protein_coding | tolerated(0.48) | benign(0.13) | TCGA-PL-A8LV-01 | Breast | breast invasive carcinoma | Female | <65 | III/IV | Unknown | Unknown | SD |
| A2M | insertion | Frame_Shift_Ins | novel | c.428_429insT | p.Val144SerfsTer10 | p.V144Sfs*10 | P01023 | protein_coding | TCGA-A8-A06X-01 | Breast | breast invasive carcinoma | Female | >=65 | I/II | Unknown | Unknown | SD |
| Page: 1 2 3 4 5 6 7 8 9 10 11 12 13 14 15 16 17 18 19 20 |
Top |
Related drugs of malignant transformation related genes |
| Identification of chemicals and drugs interact with genes involved in malignant transfromation |
| (DGIdb 4.0) |
| Entrez ID | Symbol | Category | Interaction Types | Drug Claim Name | Drug Name | PMIDs |
| 2 | A2M | ENZYME, TRANSPORTER, DRUGGABLE GENOME, PROTEASE INHIBITOR | COBALT | 6663071 | ||
| 2 | A2M | ENZYME, TRANSPORTER, DRUGGABLE GENOME, PROTEASE INHIBITOR | PROSTAGLANDIN E1 | 6202298 | ||
| 2 | A2M | ENZYME, TRANSPORTER, DRUGGABLE GENOME, PROTEASE INHIBITOR | Enzymes | 23280790 | ||
| 2 | A2M | ENZYME, TRANSPORTER, DRUGGABLE GENOME, PROTEASE INHIBITOR | THROMBIN | THROMBIN | 2432677 |
| Page: 1 |

Copyright 2023-Present -The University of Texas Health Science Center at Houston |