
|
|||||
|
 | |
| |
| |
| |
| |
| |
|
Gene: A1CF |
Gene summary for A1CF |
| Gene information | Species | Human | Gene symbol | A1CF | Gene ID | 29974 |
| Gene name | APOBEC1 complementation factor | |
| Gene Alias | ACF | |
| Cytomap | 10q11.23 | |
| Gene Type | protein-coding | GO ID | GO:0000003 | UniProtAcc | A0A024QZJ5 |
Top |
Malignant transformation analysis |
| Identification of the aberrant gene expression in precancerous and cancerous lesions by comparing the gene expression of stem-like cells in diseased tissues with normal stem cells |
| Entrez ID | Symbol | Replicates | Species | Organ | Tissue | Adj P-value | Log2FC | Malignancy |
| 29974 | A1CF | HTA11_3410_2000001011 | Human | Colorectum | AD | 3.83e-07 | -4.70e-01 | 0.0155 |
| 29974 | A1CF | HTA11_347_2000001011 | Human | Colorectum | AD | 8.90e-09 | 5.27e-01 | -0.1954 |
| 29974 | A1CF | HTA11_866_3004761011 | Human | Colorectum | AD | 1.70e-02 | -4.02e-01 | 0.096 |
| 29974 | A1CF | HTA11_10711_2000001011 | Human | Colorectum | AD | 1.44e-05 | -5.30e-01 | 0.0338 |
| 29974 | A1CF | HTA11_7696_3000711011 | Human | Colorectum | AD | 2.01e-14 | -4.65e-01 | 0.0674 |
| 29974 | A1CF | HTA11_99999970781_79442 | Human | Colorectum | MSS | 7.16e-18 | -5.18e-01 | 0.294 |
| 29974 | A1CF | HTA11_99999973899_84307 | Human | Colorectum | MSS | 8.90e-04 | -5.60e-01 | 0.2585 |
| 29974 | A1CF | HTA11_99999974143_84620 | Human | Colorectum | MSS | 4.08e-07 | -3.20e-01 | 0.3005 |
| 29974 | A1CF | F007 | Human | Colorectum | FAP | 6.53e-04 | -4.29e-01 | 0.1176 |
| 29974 | A1CF | A002-C-010 | Human | Colorectum | FAP | 5.35e-07 | -2.26e-01 | 0.242 |
| 29974 | A1CF | A001-C-207 | Human | Colorectum | FAP | 7.45e-06 | -4.40e-01 | 0.1278 |
| 29974 | A1CF | A015-C-203 | Human | Colorectum | FAP | 3.26e-27 | -4.72e-01 | -0.1294 |
| 29974 | A1CF | A015-C-204 | Human | Colorectum | FAP | 3.00e-06 | -3.86e-01 | -0.0228 |
| 29974 | A1CF | A014-C-040 | Human | Colorectum | FAP | 7.70e-03 | -4.25e-01 | -0.1184 |
| 29974 | A1CF | A002-C-201 | Human | Colorectum | FAP | 5.44e-13 | -4.46e-01 | 0.0324 |
| 29974 | A1CF | A002-C-203 | Human | Colorectum | FAP | 2.92e-08 | -2.59e-01 | 0.2786 |
| 29974 | A1CF | A001-C-119 | Human | Colorectum | FAP | 3.13e-10 | -5.54e-01 | -0.1557 |
| 29974 | A1CF | A001-C-108 | Human | Colorectum | FAP | 1.35e-24 | -5.15e-01 | -0.0272 |
| 29974 | A1CF | A002-C-205 | Human | Colorectum | FAP | 2.57e-18 | -5.18e-01 | -0.1236 |
| 29974 | A1CF | A001-C-104 | Human | Colorectum | FAP | 1.02e-15 | -4.59e-01 | 0.0184 |
| Page: 1 2 3 |
| Tissue | Expression Dynamics | Abbreviation |
| Colorectum (GSE201348) | 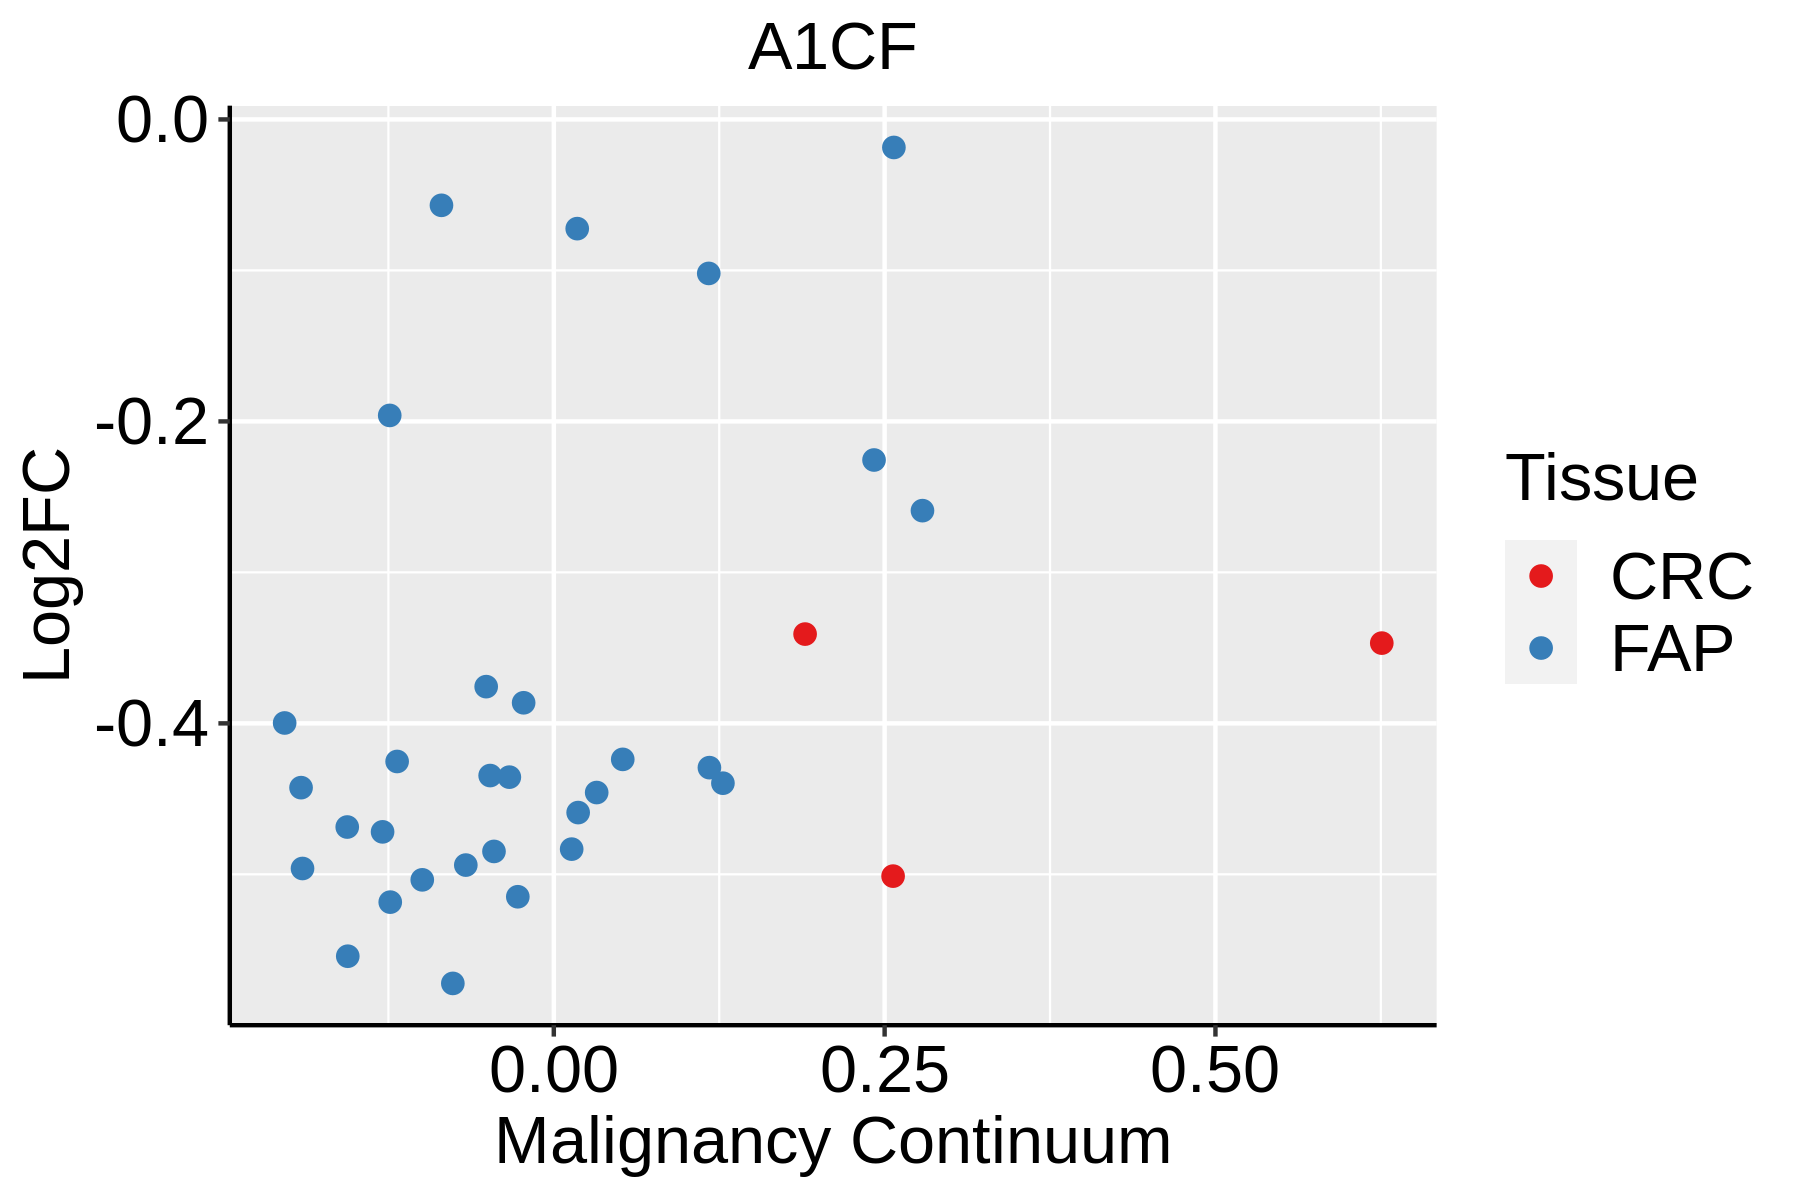 | FAP: Familial adenomatous polyposis |
| CRC: Colorectal cancer | ||
| Colorectum (HTA11) |  | AD: Adenomas |
| SER: Sessile serrated lesions | ||
| MSI-H: Microsatellite-high colorectal cancer | ||
| MSS: Microsatellite stable colorectal cancer | ||
| Liver | 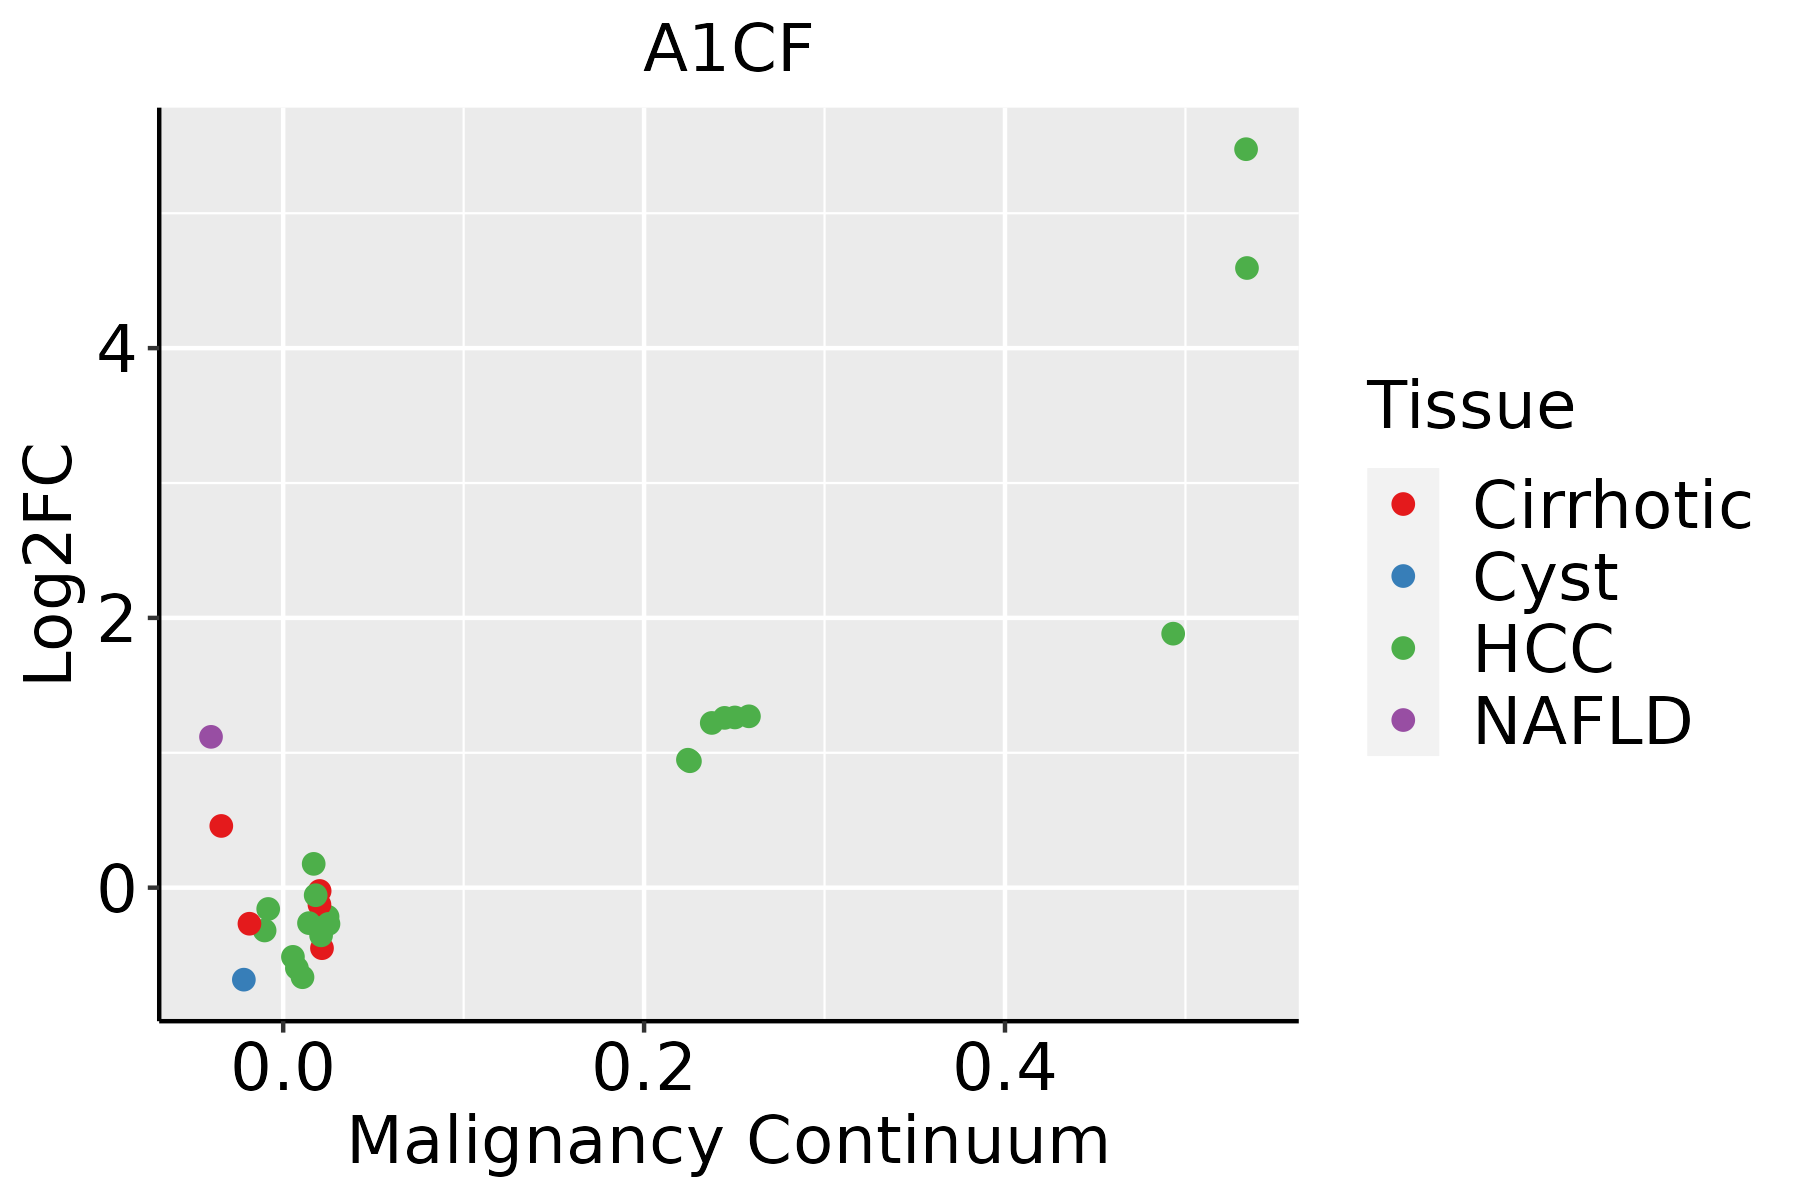 | HCC: Hepatocellular carcinoma |
| NAFLD: Non-alcoholic fatty liver disease |
| ∗log2FC in expression of this searched gene in stem-like cells from each diseased tissue sample relative to stem-like cells in normal samples in each tissue plotted against the malignancy continuum. Samples are colored based on if they are from different disease stage. |
Top |
Malignant transformation related pathway analysis |
| Find out the enriched GO biological processes and KEGG pathways involved in transition from healthy to precancer to cancer |
| Tissue | Disease Stage | Enriched GO biological Processes |
| Colorectum | AD |  |
| Colorectum | SER |  |
| Colorectum | MSS |  |
| Colorectum | MSI-H |  |
| Colorectum | FAP |  |
| ∗Top 15 enriched GO BP terms are showed in the bar plot of each disease state in each tissue. Each row represents a significant GO biological process which is colored according to the -log10(p.adjust). |
| Page: 1 2 3 4 5 6 7 8 9 |
| GO ID | Tissue | Disease Stage | Description | Gene Ratio | Bg Ratio | pvalue | p.adjust | Count |
| GO:0031647 | Colorectum | AD | regulation of protein stability | 108/3918 | 298/18723 | 6.33e-10 | 5.08e-08 | 108 |
| GO:0050821 | Colorectum | AD | protein stabilization | 73/3918 | 191/18723 | 3.02e-08 | 1.64e-06 | 73 |
| GO:0006403 | Colorectum | AD | RNA localization | 71/3918 | 201/18723 | 1.54e-06 | 4.76e-05 | 71 |
| GO:00316472 | Colorectum | MSS | regulation of protein stability | 103/3467 | 298/18723 | 2.52e-11 | 3.49e-09 | 103 |
| GO:00508212 | Colorectum | MSS | protein stabilization | 68/3467 | 191/18723 | 1.53e-08 | 8.81e-07 | 68 |
| GO:00064032 | Colorectum | MSS | RNA localization | 69/3467 | 201/18723 | 6.33e-08 | 3.26e-06 | 69 |
| GO:00508214 | Colorectum | FAP | protein stabilization | 51/2622 | 191/18723 | 2.63e-06 | 9.96e-05 | 51 |
| GO:00316474 | Colorectum | FAP | regulation of protein stability | 70/2622 | 298/18723 | 6.60e-06 | 2.04e-04 | 70 |
| GO:00064034 | Colorectum | FAP | RNA localization | 47/2622 | 201/18723 | 2.27e-04 | 3.22e-03 | 47 |
| GO:00508215 | Colorectum | CRC | protein stabilization | 44/2078 | 191/18723 | 1.77e-06 | 8.92e-05 | 44 |
| GO:00316475 | Colorectum | CRC | regulation of protein stability | 58/2078 | 298/18723 | 1.38e-05 | 4.37e-04 | 58 |
| GO:00064035 | Colorectum | CRC | RNA localization | 35/2078 | 201/18723 | 4.64e-03 | 3.61e-02 | 35 |
| GO:00316477 | Liver | NAFLD | regulation of protein stability | 61/1882 | 298/18723 | 5.00e-08 | 4.71e-06 | 61 |
| GO:00508217 | Liver | NAFLD | protein stabilization | 40/1882 | 191/18723 | 5.38e-06 | 1.95e-04 | 40 |
| GO:00064037 | Liver | NAFLD | RNA localization | 32/1882 | 201/18723 | 5.96e-03 | 4.48e-02 | 32 |
| GO:003164712 | Liver | Cirrhotic | regulation of protein stability | 144/4634 | 298/18723 | 6.74e-19 | 1.28e-16 | 144 |
| GO:005082112 | Liver | Cirrhotic | protein stabilization | 97/4634 | 191/18723 | 6.67e-15 | 6.97e-13 | 97 |
| GO:000640312 | Liver | Cirrhotic | RNA localization | 94/4634 | 201/18723 | 8.57e-12 | 5.66e-10 | 94 |
| GO:0007565 | Liver | Cirrhotic | female pregnancy | 65/4634 | 193/18723 | 3.21e-03 | 1.80e-02 | 65 |
| GO:0007566 | Liver | Cirrhotic | embryo implantation | 22/4634 | 53/18723 | 5.36e-03 | 2.73e-02 | 22 |
| Page: 1 2 |
| Pathway ID | Tissue | Disease Stage | Description | Gene Ratio | Bg Ratio | pvalue | p.adjust | qvalue | Count |
| Page: 1 |
Top |
Cell-cell communication analysis |
| Identification of potential cell-cell interactions between two cell types and their ligand-receptor pairs for different disease states |
| Ligand | Receptor | LRpair | Pathway | Tissue | Disease Stage |
| Page: 1 |
Top |
Single-cell gene regulatory network inference analysis |
| Find out the significant the regulons (TFs) and the target genes of each regulon across cell types for different disease states |
| TF | Cell Type | Tissue | Disease Stage | Target Gene | RSS | Regulon Activity |
| ∗The dot plots of a searched regulon are shown for all cell subpopulations in each disease state of each tissue based on the regulon specific score inferred using pySCENIC and by calculating the average expression. |
| Page: 1 |
Top |
Somatic mutation of malignant transformation related genes |
| Annotation of somatic variants for genes involved in malignant transformation |
| Hugo Symbol | Variant Class | Variant Classification | dbSNP RS | HGVSc | HGVSp | HGVSp Short | SWISSPROT | BIOTYPE | SIFT | PolyPhen | Tumor Sample Barcode | Tissue | Histology | Sex | Age | Stage | Therapy Types | Drugs | Outcome |
| A1CF | SNV | Missense_Mutation | c.379N>A | p.Tyr127Asn | p.Y127N | protein_coding | deleterious(0.01) | probably_damaging(0.956) | TCGA-A8-A09Z-01 | Breast | breast invasive carcinoma | Female | >=65 | I/II | Unknown | Unknown | SD | ||
| A1CF | SNV | Missense_Mutation | novel | c.407G>A | p.Gly136Glu | p.G136E | protein_coding | deleterious(0) | probably_damaging(1) | TCGA-AC-A2FB-01 | Breast | breast invasive carcinoma | Female | >=65 | I/II | Chemotherapy | taxotere | CR | |
| A1CF | SNV | Missense_Mutation | c.100A>G | p.Ile34Val | p.I34V | protein_coding | tolerated(0.75) | benign(0.001) | TCGA-AN-A0FN-01 | Breast | breast invasive carcinoma | Female | <65 | I/II | Unknown | Unknown | SD | ||
| A1CF | SNV | Missense_Mutation | c.1296N>A | p.Asp432Glu | p.D432E | protein_coding | tolerated(0.42) | probably_damaging(0.997) | TCGA-B6-A0RS-01 | Breast | breast invasive carcinoma | Female | <65 | I/II | Unknown | Unknown | PD | ||
| A1CF | SNV | Missense_Mutation | rs748398755 | c.608N>T | p.Ala203Val | p.A203V | protein_coding | deleterious(0) | possibly_damaging(0.858) | TCGA-BH-A0HP-01 | Breast | breast invasive carcinoma | Female | >=65 | III/IV | Chemotherapy | doxorubicin | SD | |
| A1CF | SNV | Missense_Mutation | c.731G>T | p.Arg244Ile | p.R244I | protein_coding | deleterious(0) | probably_damaging(0.999) | TCGA-D8-A1J8-01 | Breast | breast invasive carcinoma | Female | >=65 | I/II | Hormone Therapy | nolvadex | SD | ||
| A1CF | insertion | Frame_Shift_Ins | novel | c.1253_1254insTAACTTCTCCAAATTCCTTACCATTT | p.Tyr419AsnfsTer33 | p.Y419Nfs*33 | protein_coding | TCGA-A7-A0CG-01 | Breast | breast invasive carcinoma | Female | >=65 | I/II | Unknown | Unknown | SD | |||
| A1CF | deletion | Frame_Shift_Del | c.1322delN | p.Pro441GlnfsTer2 | p.P441Qfs*2 | protein_coding | TCGA-BH-A0GY-01 | Breast | breast invasive carcinoma | Female | >=65 | I/II | Chemotherapy | cyotxan | SD | ||||
| A1CF | SNV | Missense_Mutation | c.1664C>A | p.Ala555Asp | p.A555D | protein_coding | deleterious_low_confidence(0.01) | possibly_damaging(0.812) | TCGA-2W-A8YY-01 | Cervix | cervical & endocervical cancer | Female | <65 | I/II | Chemotherapy | cisplatin | CR | ||
| A1CF | SNV | Missense_Mutation | c.759N>C | p.Glu253Asp | p.E253D | protein_coding | tolerated(0.36) | benign(0.017) | TCGA-EK-A3GJ-01 | Cervix | cervical & endocervical cancer | Female | <65 | I/II | Unknown | Unknown | SD |
| Page: 1 2 3 4 5 6 7 8 9 10 |
Top |
Related drugs of malignant transformation related genes |
| Identification of chemicals and drugs interact with genes involved in malignant transfromation |
| (DGIdb 4.0) |
| Entrez ID | Symbol | Category | Interaction Types | Drug Claim Name | Drug Name | PMIDs |
| Page: 1 |

Copyright 2023-Present -The University of Texas Health Science Center at Houston |