
|
|||||
|
 | |
| |
| |
| |
| |
| |
|
Gene: A1BG |
Gene summary for A1BG |
| Gene information | Species | Human | Gene symbol | A1BG | Gene ID | 1 |
| Gene name | alpha-1-B glycoprotein | |
| Gene Alias | A1B | |
| Cytomap | 19q13.43 | |
| Gene Type | protein-coding | GO ID | GO:0008150 | UniProtAcc | P04217 |
Top |
Malignant transformation analysis |
| Identification of the aberrant gene expression in precancerous and cancerous lesions by comparing the gene expression of stem-like cells in diseased tissues with normal stem cells |
| Entrez ID | Symbol | Replicates | Species | Organ | Tissue | Adj P-value | Log2FC | Malignancy |
| 1 | A1BG | LZE4T | Human | Esophagus | ESCC | 3.08e-23 | 6.00e-01 | 0.0811 |
| 1 | A1BG | LZE5T | Human | Esophagus | ESCC | 1.57e-03 | 3.08e-01 | 0.0514 |
| 1 | A1BG | LZE7T | Human | Esophagus | ESCC | 1.62e-04 | 2.13e-01 | 0.0667 |
| 1 | A1BG | LZE24T | Human | Esophagus | ESCC | 6.29e-04 | 1.71e-01 | 0.0596 |
| 1 | A1BG | P2T-E | Human | Esophagus | ESCC | 6.56e-15 | 2.72e-01 | 0.1177 |
| 1 | A1BG | P4T-E | Human | Esophagus | ESCC | 1.78e-10 | 2.98e-01 | 0.1323 |
| 1 | A1BG | P8T-E | Human | Esophagus | ESCC | 4.31e-06 | 1.44e-01 | 0.0889 |
| 1 | A1BG | P9T-E | Human | Esophagus | ESCC | 4.01e-04 | 1.56e-01 | 0.1131 |
| 1 | A1BG | P10T-E | Human | Esophagus | ESCC | 2.27e-90 | 1.24e+00 | 0.116 |
| 1 | A1BG | P11T-E | Human | Esophagus | ESCC | 7.73e-16 | 5.15e-01 | 0.1426 |
| 1 | A1BG | P12T-E | Human | Esophagus | ESCC | 6.31e-48 | 7.81e-01 | 0.1122 |
| 1 | A1BG | P16T-E | Human | Esophagus | ESCC | 1.23e-20 | 3.24e-01 | 0.1153 |
| 1 | A1BG | P17T-E | Human | Esophagus | ESCC | 1.45e-12 | 4.56e-01 | 0.1278 |
| 1 | A1BG | P19T-E | Human | Esophagus | ESCC | 5.57e-05 | 3.45e-01 | 0.1662 |
| 1 | A1BG | P20T-E | Human | Esophagus | ESCC | 4.04e-16 | 3.63e-01 | 0.1124 |
| 1 | A1BG | P21T-E | Human | Esophagus | ESCC | 4.17e-05 | 1.06e-01 | 0.1617 |
| 1 | A1BG | P22T-E | Human | Esophagus | ESCC | 2.08e-40 | 5.96e-01 | 0.1236 |
| 1 | A1BG | P24T-E | Human | Esophagus | ESCC | 1.78e-03 | 1.02e-01 | 0.1287 |
| 1 | A1BG | P26T-E | Human | Esophagus | ESCC | 3.02e-26 | 4.37e-01 | 0.1276 |
| 1 | A1BG | P27T-E | Human | Esophagus | ESCC | 1.25e-26 | 4.30e-01 | 0.1055 |
| Page: 1 2 3 4 5 |
| Tissue | Expression Dynamics | Abbreviation |
| Esophagus | 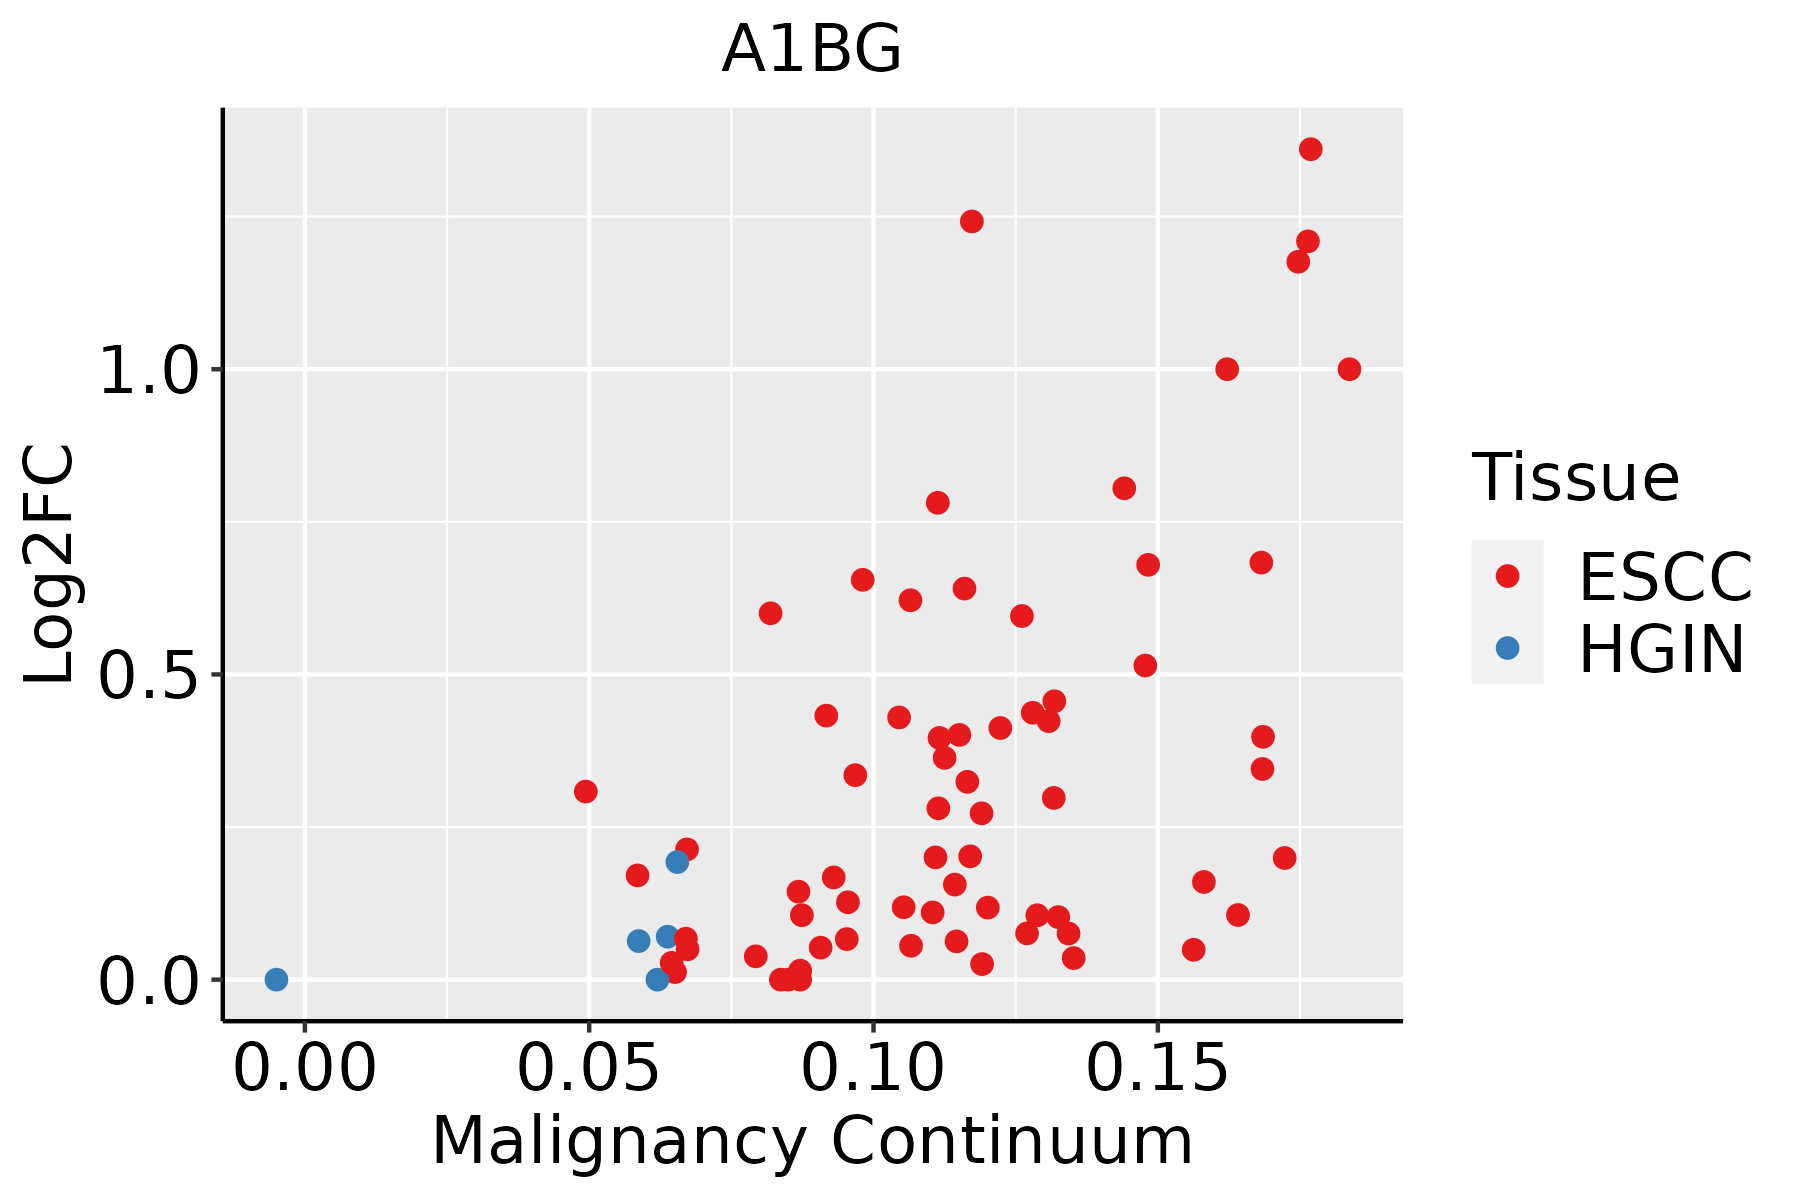 | ESCC: Esophageal squamous cell carcinoma |
| HGIN: High-grade intraepithelial neoplasias | ||
| LGIN: Low-grade intraepithelial neoplasias | ||
| Liver | 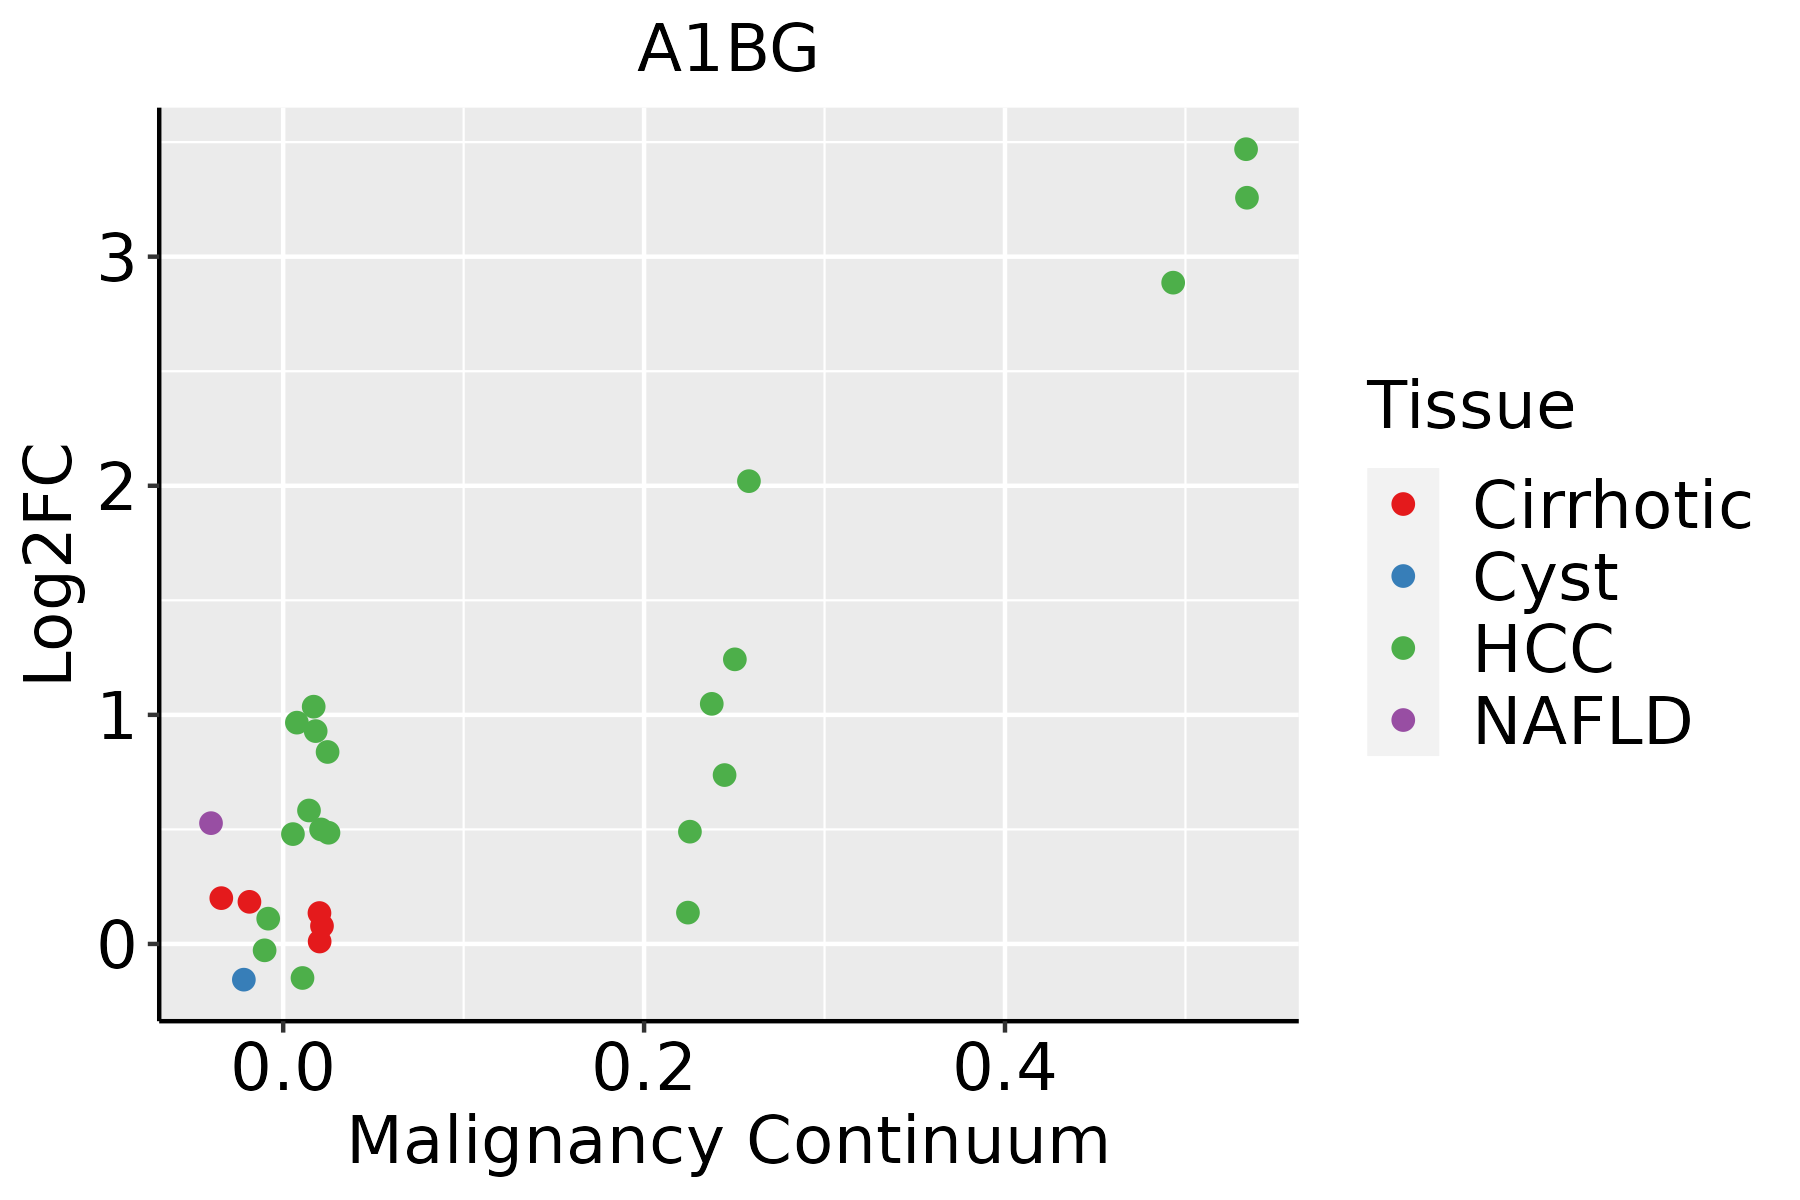 | HCC: Hepatocellular carcinoma |
| NAFLD: Non-alcoholic fatty liver disease | ||
| Oral Cavity | 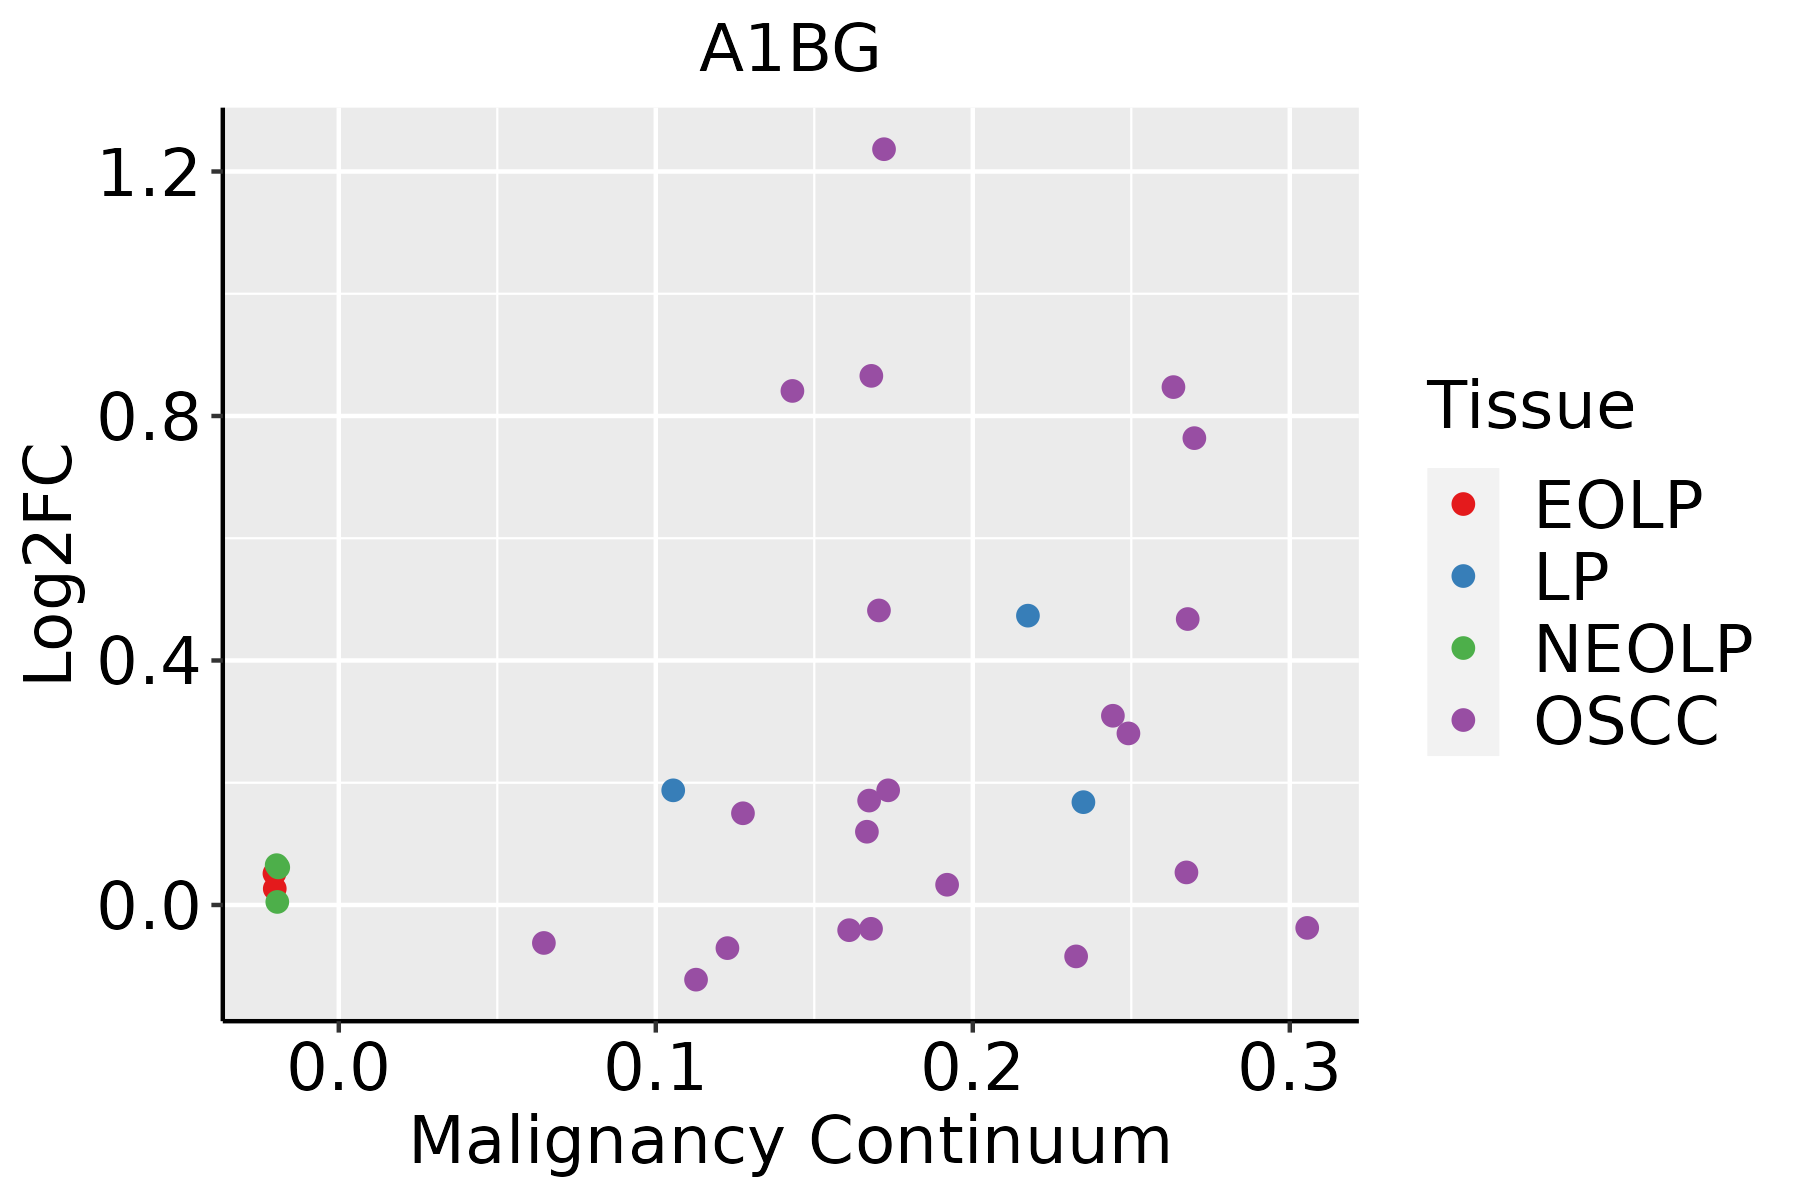 | EOLP: Erosive Oral lichen planus |
| LP: leukoplakia | ||
| NEOLP: Non-erosive oral lichen planus | ||
| OSCC: Oral squamous cell carcinoma | ||
| Thyroid | 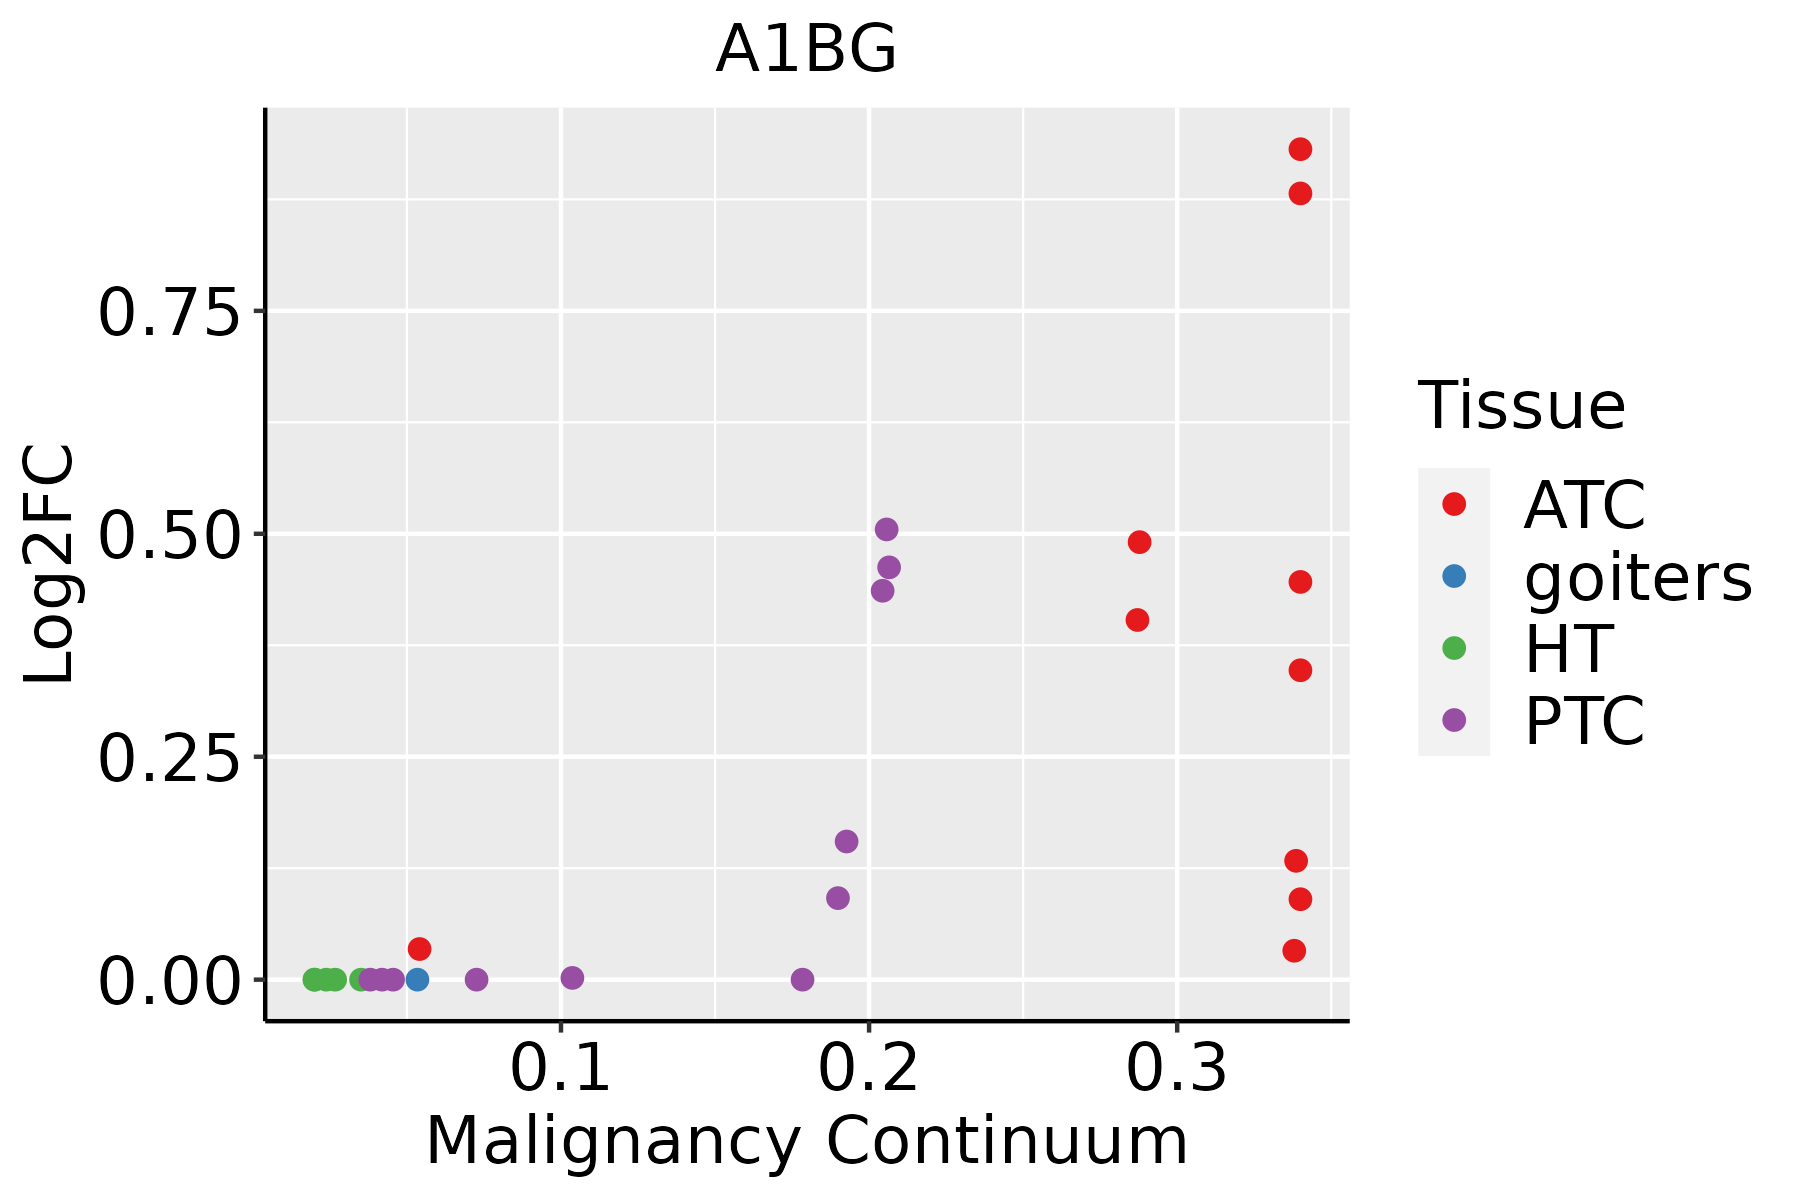 | ATC: Anaplastic thyroid cancer |
| HT: Hashimoto's thyroiditis | ||
| PTC: Papillary thyroid cancer |
| ∗log2FC in expression of this searched gene in stem-like cells from each diseased tissue sample relative to stem-like cells in normal samples in each tissue plotted against the malignancy continuum. Samples are colored based on if they are from different disease stage. |
Top |
Malignant transformation related pathway analysis |
| Find out the enriched GO biological processes and KEGG pathways involved in transition from healthy to precancer to cancer |
| Tissue | Disease Stage | Enriched GO biological Processes |
| Colorectum | AD |  |
| Colorectum | SER |  |
| Colorectum | MSS |  |
| Colorectum | MSI-H |  |
| Colorectum | FAP |  |
| ∗Top 15 enriched GO BP terms are showed in the bar plot of each disease state in each tissue. Each row represents a significant GO biological process which is colored according to the -log10(p.adjust). |
| Page: 1 2 3 4 5 6 7 8 9 |
| GO ID | Tissue | Disease Stage | Description | Gene Ratio | Bg Ratio | pvalue | p.adjust | Count |
| Page: 1 |
| Pathway ID | Tissue | Disease Stage | Description | Gene Ratio | Bg Ratio | pvalue | p.adjust | qvalue | Count |
| Page: 1 |
Top |
Cell-cell communication analysis |
| Identification of potential cell-cell interactions between two cell types and their ligand-receptor pairs for different disease states |
| Ligand | Receptor | LRpair | Pathway | Tissue | Disease Stage |
| Page: 1 |
Top |
Single-cell gene regulatory network inference analysis |
| Find out the significant the regulons (TFs) and the target genes of each regulon across cell types for different disease states |
| TF | Cell Type | Tissue | Disease Stage | Target Gene | RSS | Regulon Activity |
| ∗The dot plots of a searched regulon are shown for all cell subpopulations in each disease state of each tissue based on the regulon specific score inferred using pySCENIC and by calculating the average expression. |
| Page: 1 |
Top |
Somatic mutation of malignant transformation related genes |
| Annotation of somatic variants for genes involved in malignant transformation |
| Hugo Symbol | Variant Class | Variant Classification | dbSNP RS | HGVSc | HGVSp | HGVSp Short | SWISSPROT | BIOTYPE | SIFT | PolyPhen | Tumor Sample Barcode | Tissue | Histology | Sex | Age | Stage | Therapy Types | Drugs | Outcome |
| A1BG | SNV | Missense_Mutation | novel | c.327N>T | p.Glu109Asp | p.E109D | P04217 | protein_coding | tolerated(0.06) | probably_damaging(0.999) | TCGA-A8-A06P-01 | Breast | breast invasive carcinoma | Female | <65 | III/IV | Unspecific | SD | |
| A1BG | SNV | Missense_Mutation | rs151098196 | c.268C>T | p.Arg90Cys | p.R90C | P04217 | protein_coding | deleterious(0) | probably_damaging(0.924) | TCGA-E9-A1NH-01 | Breast | breast invasive carcinoma | Female | >=65 | I/II | Hormone Therapy | tamoxiphen | SD |
| A1BG | insertion | In_Frame_Ins | novel | c.423_424insACCGGCTGCATGACA | p.Gly141_Val142insThrGlyCysMetThr | p.G141_V142insTGCMT | P04217 | protein_coding | TCGA-BH-A0BM-01 | Breast | breast invasive carcinoma | Female | <65 | I/II | Chemotherapy | adriamycin | SD | ||
| A1BG | SNV | Missense_Mutation | rs533605370 | c.281G>A | p.Arg94His | p.R94H | P04217 | protein_coding | deleterious(0.03) | possibly_damaging(0.793) | TCGA-BI-A0VS-01 | Cervix | cervical & endocervical cancer | Female | <65 | I/II | Unknown | Unknown | SD |
| A1BG | SNV | Missense_Mutation | c.1354N>A | p.Ala452Thr | p.A452T | P04217 | protein_coding | tolerated(0.15) | benign(0.028) | TCGA-A6-2686-01 | Colorectum | colon adenocarcinoma | Female | >=65 | I/II | Unknown | Unknown | SD | |
| A1BG | SNV | Missense_Mutation | rs375725715 | c.365N>T | p.Ser122Leu | p.S122L | P04217 | protein_coding | deleterious(0.03) | benign(0.267) | TCGA-AM-5821-01 | Colorectum | colon adenocarcinoma | Female | >=65 | I/II | Unknown | Unknown | SD |
| A1BG | SNV | Missense_Mutation | rs540868706 | c.571N>A | p.Ala191Thr | p.A191T | P04217 | protein_coding | tolerated(0.64) | benign(0.011) | TCGA-AZ-4315-01 | Colorectum | colon adenocarcinoma | Male | <65 | I/II | Unknown | Unknown | SD |
| A1BG | SNV | Missense_Mutation | rs770480372 | c.781C>T | p.Arg261Cys | p.R261C | P04217 | protein_coding | deleterious(0.01) | probably_damaging(0.982) | TCGA-CA-6717-01 | Colorectum | colon adenocarcinoma | Male | <65 | I/II | Chemotherapy | oxaliplatin | CR |
| A1BG | SNV | Missense_Mutation | c.545N>A | p.Cys182Tyr | p.C182Y | P04217 | protein_coding | deleterious(0) | probably_damaging(0.999) | TCGA-CM-6162-01 | Colorectum | colon adenocarcinoma | Female | <65 | III/IV | Chemotherapy | oxaliplatin | SD | |
| A1BG | SNV | Missense_Mutation | rs540868706 | c.571N>A | p.Ala191Thr | p.A191T | P04217 | protein_coding | tolerated(0.64) | benign(0.011) | TCGA-D5-6531-01 | Colorectum | colon adenocarcinoma | Male | >=65 | I/II | Unknown | Unknown | SD |
| Page: 1 2 3 4 5 |
Top |
Related drugs of malignant transformation related genes |
| Identification of chemicals and drugs interact with genes involved in malignant transfromation |
| (DGIdb 4.0) |
| Entrez ID | Symbol | Category | Interaction Types | Drug Claim Name | Drug Name | PMIDs |
| Page: 1 |

Copyright 2023-Present -The University of Texas Health Science Center at Houston |