
|
|||||
|
 | |
| |
| |
| |
| |
| |
|
Gene: FABP4 |
Gene summary for FABP4 |
| Gene information | Species | Human | Gene symbol | FABP4 | Gene ID | 2167 |
| Gene name | fatty acid binding protein 4 | |
| Gene Alias | A-FABP | |
| Cytomap | 8q21.13 | |
| Gene Type | protein-coding | GO ID | GO:0001659 | UniProtAcc | E7DVW4 |
Top |
Malignant transformation analysis |
| Identification of the aberrant gene expression in precancerous and cancerous lesions by comparing the gene expression of stem-like cells in diseased tissues with normal stem cells |
| Entrez ID | Symbol | Replicates | Species | Organ | Tissue | Adj P-value | Log2FC | Malignancy |
| 2167 | FABP4 | Tumor | Human | Cervix | CC | 9.00e-07 | 3.05e-01 | 0.1241 |
| 2167 | FABP4 | sample3 | Human | Cervix | CC | 1.72e-03 | 1.73e-01 | 0.1387 |
| 2167 | FABP4 | L1 | Human | Cervix | CC | 2.01e-13 | 7.48e-01 | 0.0802 |
| 2167 | FABP4 | T3 | Human | Cervix | CC | 1.72e-03 | 2.23e-01 | 0.1389 |
| 2167 | FABP4 | LZE6T | Human | Esophagus | ESCC | 4.94e-09 | 1.80e+00 | 0.0845 |
| 2167 | FABP4 | P128T-E | Human | Esophagus | ESCC | 5.10e-05 | 1.33e+00 | 0.1241 |
| 2167 | FABP4 | HCC1_Meng | Human | Liver | HCC | 4.51e-03 | 1.16e-02 | 0.0246 |
| 2167 | FABP4 | cirrhotic2 | Human | Liver | Cirrhotic | 4.09e-09 | 2.11e-01 | 0.0201 |
| 2167 | FABP4 | cirrhotic3 | Human | Liver | Cirrhotic | 5.63e-04 | 1.41e-01 | 0.0215 |
| 2167 | FABP4 | Pt13.a | Human | Liver | HCC | 2.15e-21 | 7.53e-01 | 0.021 |
| 2167 | FABP4 | Pt13.b | Human | Liver | HCC | 2.20e-33 | 9.97e-01 | 0.0251 |
| 2167 | FABP4 | Pt13.c | Human | Liver | HCC | 8.87e-16 | 8.83e-01 | 0.0076 |
| Page: 1 |
| Tissue | Expression Dynamics | Abbreviation |
| Cervix | 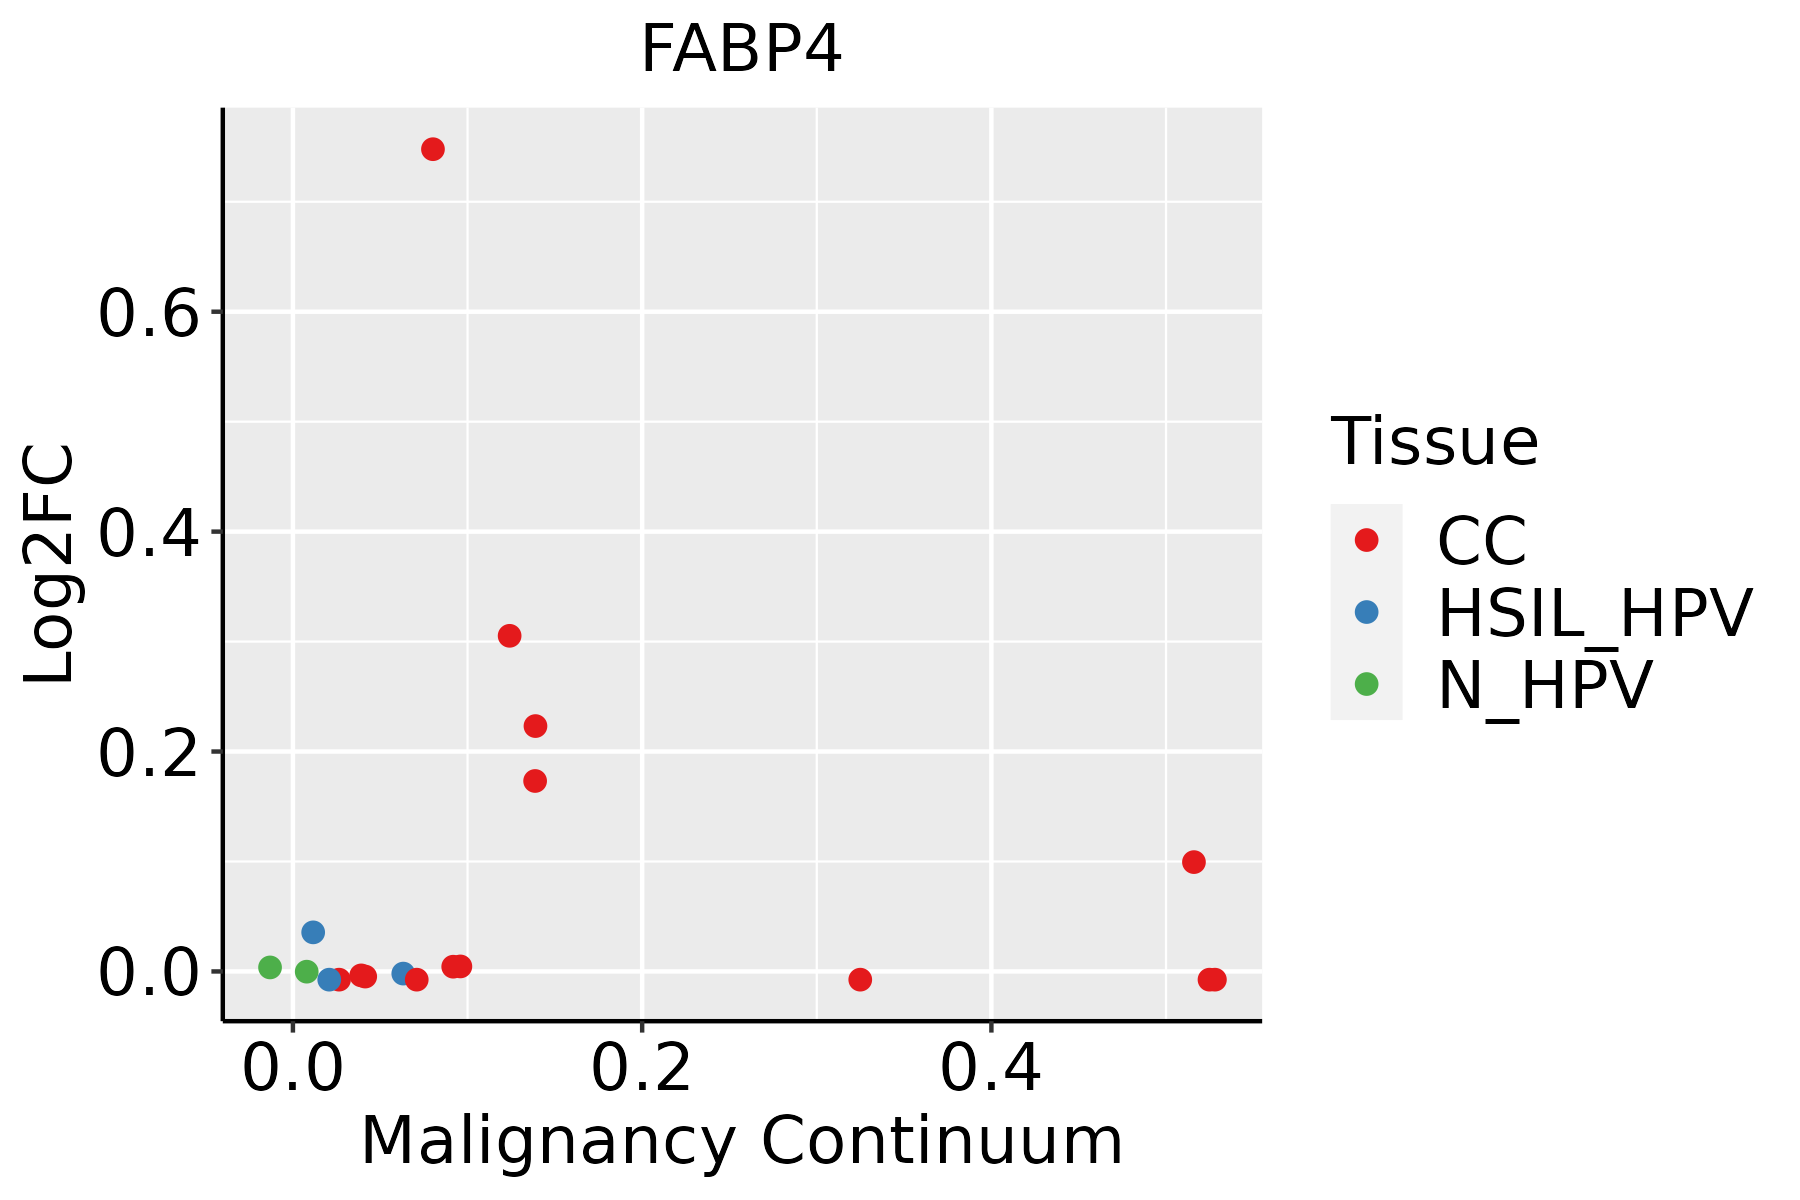 | CC: Cervix cancer |
| HSIL_HPV: HPV-infected high-grade squamous intraepithelial lesions | ||
| N_HPV: HPV-infected normal cervix | ||
| Esophagus | 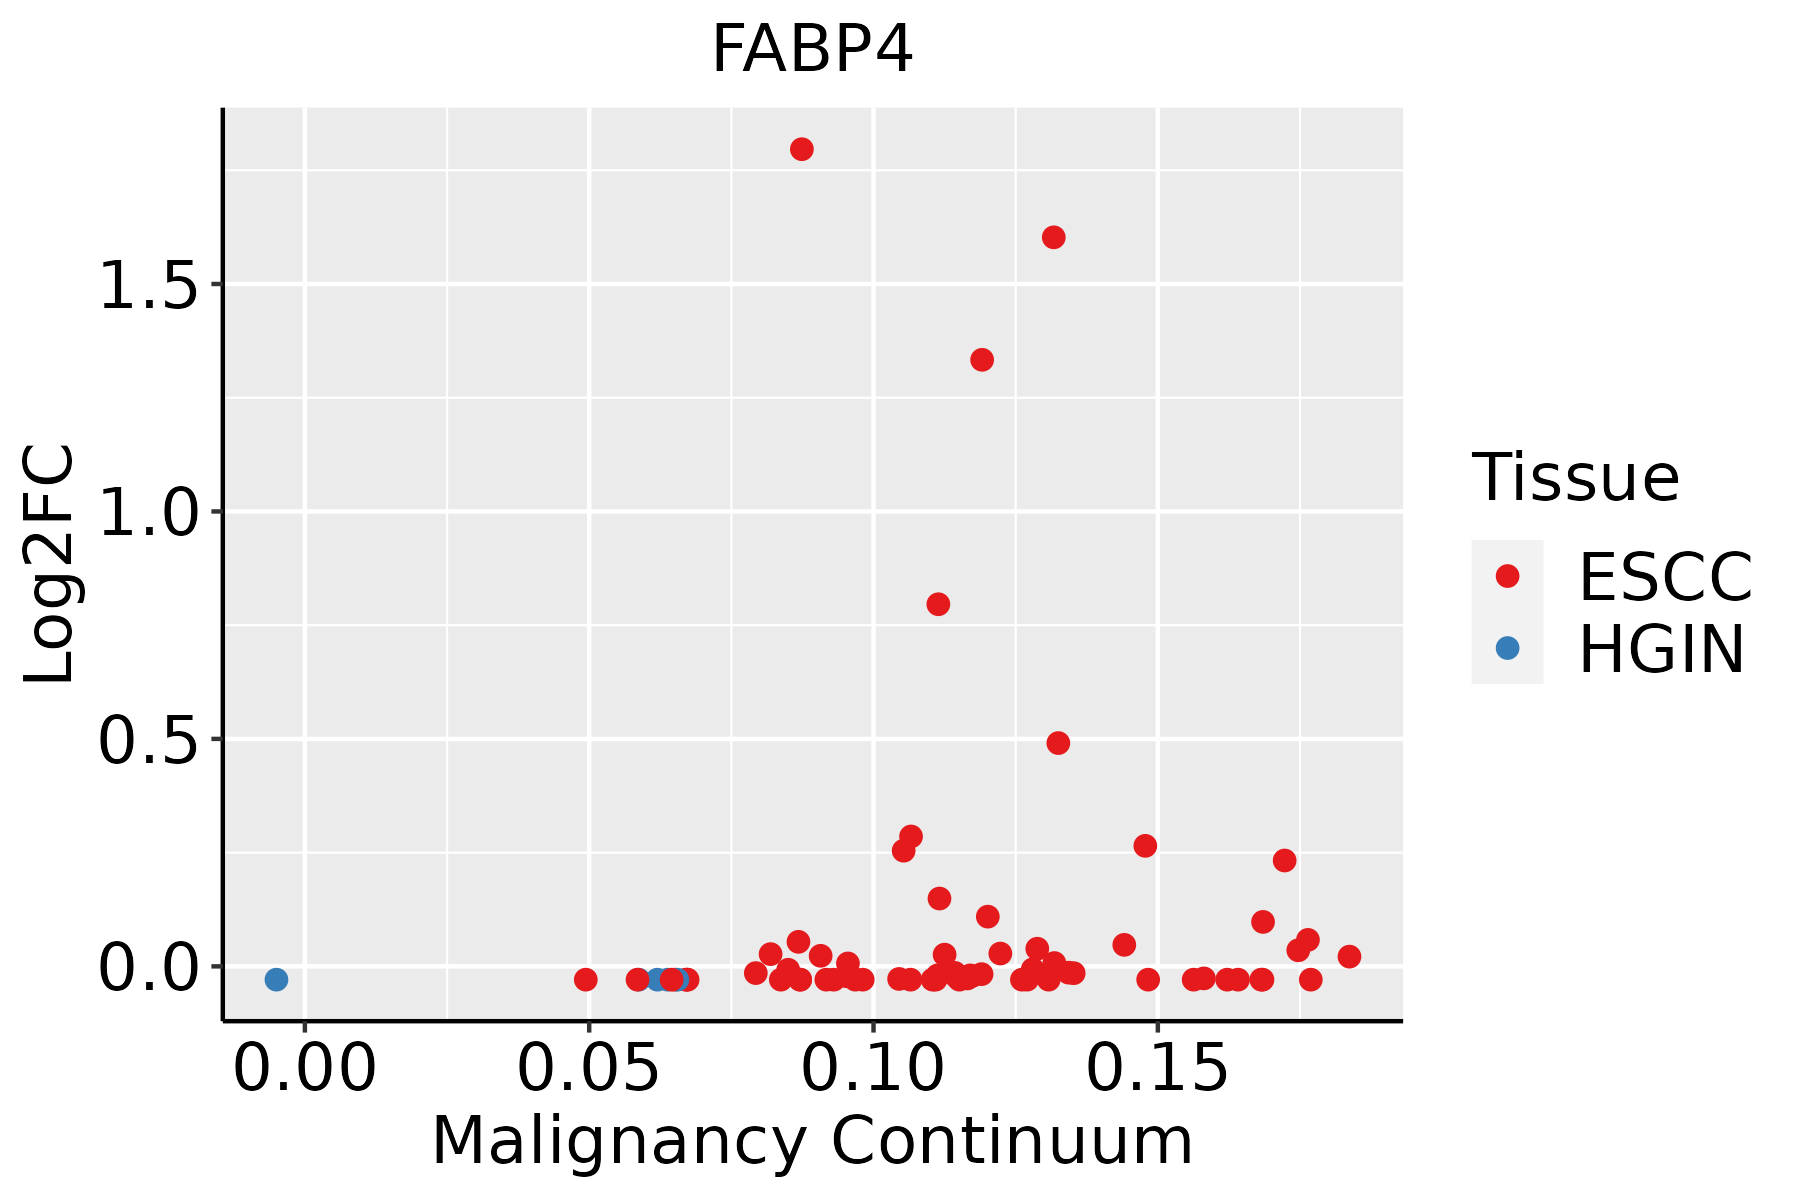 | ESCC: Esophageal squamous cell carcinoma |
| HGIN: High-grade intraepithelial neoplasias | ||
| LGIN: Low-grade intraepithelial neoplasias | ||
| Liver |  | HCC: Hepatocellular carcinoma |
| NAFLD: Non-alcoholic fatty liver disease |
| ∗log2FC in expression of this searched gene in stem-like cells from each diseased tissue sample relative to stem-like cells in normal samples in each tissue plotted against the malignancy continuum. Samples are colored based on if they are from different disease stage. |
Top |
Malignant transformation related pathway analysis |
| Find out the enriched GO biological processes and KEGG pathways involved in transition from healthy to precancer to cancer |
| Tissue | Disease Stage | Enriched GO biological Processes |
| Colorectum | AD |  |
| Colorectum | SER |  |
| Colorectum | MSS |  |
| Colorectum | MSI-H |  |
| Colorectum | FAP |  |
| ∗Top 15 enriched GO BP terms are showed in the bar plot of each disease state in each tissue. Each row represents a significant GO biological process which is colored according to the -log10(p.adjust). |
| Page: 1 2 3 4 5 6 7 8 9 |
| GO ID | Tissue | Disease Stage | Description | Gene Ratio | Bg Ratio | pvalue | p.adjust | Count |
| GO:00321035 | Cervix | CC | positive regulation of response to external stimulus | 95/2311 | 427/18723 | 5.44e-09 | 5.03e-07 | 95 |
| GO:005134810 | Cervix | CC | negative regulation of transferase activity | 60/2311 | 268/18723 | 2.77e-06 | 8.02e-05 | 60 |
| GO:004593610 | Cervix | CC | negative regulation of phosphate metabolic process | 88/2311 | 441/18723 | 2.92e-06 | 8.27e-05 | 88 |
| GO:001056310 | Cervix | CC | negative regulation of phosphorus metabolic process | 88/2311 | 442/18723 | 3.21e-06 | 8.77e-05 | 88 |
| GO:00454445 | Cervix | CC | fat cell differentiation | 53/2311 | 229/18723 | 3.72e-06 | 9.75e-05 | 53 |
| GO:00313494 | Cervix | CC | positive regulation of defense response | 60/2311 | 278/18723 | 9.38e-06 | 2.11e-04 | 60 |
| GO:004232610 | Cervix | CC | negative regulation of phosphorylation | 77/2311 | 385/18723 | 1.09e-05 | 2.38e-04 | 77 |
| GO:00346129 | Cervix | CC | response to tumor necrosis factor | 55/2311 | 253/18723 | 1.75e-05 | 3.32e-04 | 55 |
| GO:00713569 | Cervix | CC | cellular response to tumor necrosis factor | 51/2311 | 229/18723 | 1.75e-05 | 3.32e-04 | 51 |
| GO:000193310 | Cervix | CC | negative regulation of protein phosphorylation | 69/2311 | 342/18723 | 2.29e-05 | 4.01e-04 | 69 |
| GO:00507273 | Cervix | CC | regulation of inflammatory response | 75/2311 | 386/18723 | 3.95e-05 | 6.18e-04 | 75 |
| GO:000646910 | Cervix | CC | negative regulation of protein kinase activity | 47/2311 | 212/18723 | 4.13e-05 | 6.36e-04 | 47 |
| GO:00336739 | Cervix | CC | negative regulation of kinase activity | 50/2311 | 237/18723 | 9.22e-05 | 1.21e-03 | 50 |
| GO:00507294 | Cervix | CC | positive regulation of inflammatory response | 34/2311 | 142/18723 | 9.51e-05 | 1.25e-03 | 34 |
| GO:001003810 | Cervix | CC | response to metal ion | 67/2311 | 373/18723 | 9.67e-04 | 8.10e-03 | 67 |
| GO:0050873 | Cervix | CC | brown fat cell differentiation | 13/2311 | 50/18723 | 6.42e-03 | 3.58e-02 | 13 |
| GO:0010563111 | Esophagus | ESCC | negative regulation of phosphorus metabolic process | 274/8552 | 442/18723 | 2.32e-12 | 9.41e-11 | 274 |
| GO:0045936111 | Esophagus | ESCC | negative regulation of phosphate metabolic process | 273/8552 | 441/18723 | 3.18e-12 | 1.25e-10 | 273 |
| GO:0051348111 | Esophagus | ESCC | negative regulation of transferase activity | 177/8552 | 268/18723 | 1.08e-11 | 4.00e-10 | 177 |
| GO:0042326111 | Esophagus | ESCC | negative regulation of phosphorylation | 237/8552 | 385/18723 | 1.86e-10 | 5.33e-09 | 237 |
| Page: 1 2 3 4 |
| Pathway ID | Tissue | Disease Stage | Description | Gene Ratio | Bg Ratio | pvalue | p.adjust | qvalue | Count |
| hsa0332021 | Liver | Cirrhotic | PPAR signaling pathway | 32/2530 | 75/8465 | 1.24e-02 | 3.92e-02 | 2.42e-02 | 32 |
| hsa0332031 | Liver | Cirrhotic | PPAR signaling pathway | 32/2530 | 75/8465 | 1.24e-02 | 3.92e-02 | 2.42e-02 | 32 |
| hsa033204 | Liver | HCC | PPAR signaling pathway | 48/4020 | 75/8465 | 2.83e-03 | 9.37e-03 | 5.21e-03 | 48 |
| hsa033205 | Liver | HCC | PPAR signaling pathway | 48/4020 | 75/8465 | 2.83e-03 | 9.37e-03 | 5.21e-03 | 48 |
| Page: 1 |
Top |
Cell-cell communication analysis |
| Identification of potential cell-cell interactions between two cell types and their ligand-receptor pairs for different disease states |
| Ligand | Receptor | LRpair | Pathway | Tissue | Disease Stage |
| Page: 1 |
Top |
Single-cell gene regulatory network inference analysis |
| Find out the significant the regulons (TFs) and the target genes of each regulon across cell types for different disease states |
| TF | Cell Type | Tissue | Disease Stage | Target Gene | RSS | Regulon Activity |
| ∗The dot plots of a searched regulon are shown for all cell subpopulations in each disease state of each tissue based on the regulon specific score inferred using pySCENIC and by calculating the average expression. |
| Page: 1 |
Top |
Somatic mutation of malignant transformation related genes |
| Annotation of somatic variants for genes involved in malignant transformation |
| Hugo Symbol | Variant Class | Variant Classification | dbSNP RS | HGVSc | HGVSp | HGVSp Short | SWISSPROT | BIOTYPE | SIFT | PolyPhen | Tumor Sample Barcode | Tissue | Histology | Sex | Age | Stage | Therapy Types | Drugs | Outcome |
| FABP4 | SNV | Missense_Mutation | c.226N>T | p.Ala76Ser | p.A76S | P15090 | protein_coding | deleterious(0.02) | benign(0.036) | TCGA-A1-A0SO-01 | Breast | breast invasive carcinoma | Female | >=65 | I/II | Chemotherapy | SD | ||
| FABP4 | SNV | Missense_Mutation | c.109G>A | p.Ala37Thr | p.A37T | P15090 | protein_coding | tolerated(0.83) | possibly_damaging(0.5) | TCGA-AA-3966-01 | Colorectum | colon adenocarcinoma | Female | >=65 | I/II | Unknown | Unknown | SD | |
| FABP4 | SNV | Missense_Mutation | c.288N>T | p.Gln96His | p.Q96H | P15090 | protein_coding | deleterious(0) | probably_damaging(0.998) | TCGA-CA-6717-01 | Colorectum | colon adenocarcinoma | Male | <65 | I/II | Chemotherapy | oxaliplatin | CR | |
| FABP4 | SNV | Missense_Mutation | c.11N>A | p.Ala4Asp | p.A4D | P15090 | protein_coding | tolerated(0.16) | benign(0.026) | TCGA-AP-A0LM-01 | Endometrium | uterine corpus endometrioid carcinoma | Female | <65 | III/IV | Chemotherapy | cisplatin | SD | |
| FABP4 | SNV | Missense_Mutation | novel | c.169N>G | p.Thr57Ala | p.T57A | P15090 | protein_coding | tolerated(0.12) | benign(0.007) | TCGA-EO-A22R-01 | Endometrium | uterine corpus endometrioid carcinoma | Female | <65 | I/II | Unknown | Unknown | SD |
| FABP4 | SNV | Missense_Mutation | novel | c.98T>C | p.Val33Ala | p.V33A | P15090 | protein_coding | tolerated(0.14) | benign(0.045) | TCGA-EO-A22U-01 | Endometrium | uterine corpus endometrioid carcinoma | Female | >=65 | I/II | Unknown | Unknown | SD |
| FABP4 | SNV | Missense_Mutation | novel | c.373T>C | p.Ser125Pro | p.S125P | P15090 | protein_coding | deleterious(0.01) | possibly_damaging(0.747) | TCGA-FI-A2D5-01 | Endometrium | uterine corpus endometrioid carcinoma | Female | <65 | III/IV | Chemotherapy | carboplatinum | PD |
| FABP4 | SNV | Missense_Mutation | c.266N>T | p.Gly89Val | p.G89V | P15090 | protein_coding | deleterious(0.01) | possibly_damaging(0.497) | TCGA-62-A46S-01 | Lung | lung adenocarcinoma | Male | >=65 | I/II | Targeted Molecular therapy | tarceva | PD | |
| FABP4 | SNV | Missense_Mutation | c.266N>T | p.Gly89Val | p.G89V | P15090 | protein_coding | deleterious(0.01) | possibly_damaging(0.497) | TCGA-86-A4D0-01 | Lung | lung adenocarcinoma | Male | <65 | I/II | Chemotherapy | etoposide | CR | |
| FABP4 | SNV | Missense_Mutation | novel | c.142G>C | p.Asp48His | p.D48H | P15090 | protein_coding | deleterious(0) | probably_damaging(0.969) | TCGA-94-8490-01 | Lung | lung squamous cell carcinoma | Male | >=65 | I/II | Unknown | Unknown | SD |
| Page: 1 2 |
Top |
Related drugs of malignant transformation related genes |
| Identification of chemicals and drugs interact with genes involved in malignant transfromation |
| (DGIdb 4.0) |
| Entrez ID | Symbol | Category | Interaction Types | Drug Claim Name | Drug Name | PMIDs |
| 2167 | FABP4 | DRUGGABLE GENOME | PMID27109571-Compound-31 | |||
| 2167 | FABP4 | DRUGGABLE GENOME | PMID27109571-Compound-21 | |||
| 2167 | FABP4 | DRUGGABLE GENOME | PMID27109571-Compound-7 | |||
| 2167 | FABP4 | DRUGGABLE GENOME | PMID27109571-Compound-12 | |||
| 2167 | FABP4 | DRUGGABLE GENOME | inhibitor | 252827455 | ||
| 2167 | FABP4 | DRUGGABLE GENOME | PMID27109571-Compound-19 | |||
| 2167 | FABP4 | DRUGGABLE GENOME | PMID27109571-Compound-27 |
| Page: 1 2 3 |

Copyright 2023-Present -The University of Texas Health Science Center at Houston |