
|
|||||
|
 | |
| |
| |
| |
| |
| |
|
Gene: FGFR3 |
Gene summary for FGFR3 |
| Gene information | Species | Human | Gene symbol | FGFR3 | Gene ID | 2261 |
| Gene name | fibroblast growth factor receptor 3 | |
| Gene Alias | ACH | |
| Cytomap | 4p16.3 | |
| Gene Type | protein-coding | GO ID | GO:0000165 | UniProtAcc | P22607 |
Top |
Malignant transformation analysis |
| Identification of the aberrant gene expression in precancerous and cancerous lesions by comparing the gene expression of stem-like cells in diseased tissues with normal stem cells |
| Entrez ID | Symbol | Replicates | Species | Organ | Tissue | Adj P-value | Log2FC | Malignancy |
| 2261 | FGFR3 | LZE8T | Human | Esophagus | ESCC | 1.07e-08 | 4.32e-01 | 0.067 |
| 2261 | FGFR3 | LZE20T | Human | Esophagus | ESCC | 2.56e-05 | 3.72e-01 | 0.0662 |
| 2261 | FGFR3 | LZE24T | Human | Esophagus | ESCC | 4.54e-11 | 4.28e-01 | 0.0596 |
| 2261 | FGFR3 | LZE21T | Human | Esophagus | ESCC | 2.66e-02 | 2.17e-01 | 0.0655 |
| 2261 | FGFR3 | P1T-E | Human | Esophagus | ESCC | 3.17e-08 | 5.70e-01 | 0.0875 |
| 2261 | FGFR3 | P2T-E | Human | Esophagus | ESCC | 1.83e-03 | -4.85e-02 | 0.1177 |
| 2261 | FGFR3 | P4T-E | Human | Esophagus | ESCC | 7.31e-05 | 1.27e-01 | 0.1323 |
| 2261 | FGFR3 | P8T-E | Human | Esophagus | ESCC | 2.84e-72 | 1.29e+00 | 0.0889 |
| 2261 | FGFR3 | P10T-E | Human | Esophagus | ESCC | 7.87e-21 | 5.65e-01 | 0.116 |
| 2261 | FGFR3 | P12T-E | Human | Esophagus | ESCC | 4.60e-15 | 2.27e-01 | 0.1122 |
| 2261 | FGFR3 | P15T-E | Human | Esophagus | ESCC | 5.98e-11 | 1.83e-01 | 0.1149 |
| 2261 | FGFR3 | P20T-E | Human | Esophagus | ESCC | 2.46e-18 | 3.21e-01 | 0.1124 |
| 2261 | FGFR3 | P21T-E | Human | Esophagus | ESCC | 1.63e-07 | 2.05e-01 | 0.1617 |
| 2261 | FGFR3 | P22T-E | Human | Esophagus | ESCC | 1.11e-06 | 4.62e-02 | 0.1236 |
| 2261 | FGFR3 | P26T-E | Human | Esophagus | ESCC | 2.10e-07 | -1.94e-02 | 0.1276 |
| 2261 | FGFR3 | P27T-E | Human | Esophagus | ESCC | 2.01e-09 | 1.48e-01 | 0.1055 |
| 2261 | FGFR3 | P28T-E | Human | Esophagus | ESCC | 9.86e-10 | 1.44e-01 | 0.1149 |
| 2261 | FGFR3 | P30T-E | Human | Esophagus | ESCC | 2.47e-06 | 2.99e-01 | 0.137 |
| 2261 | FGFR3 | P31T-E | Human | Esophagus | ESCC | 7.14e-07 | 7.43e-02 | 0.1251 |
| 2261 | FGFR3 | P37T-E | Human | Esophagus | ESCC | 6.14e-05 | 9.59e-02 | 0.1371 |
| Page: 1 2 3 4 5 |
| Tissue | Expression Dynamics | Abbreviation |
| Esophagus | 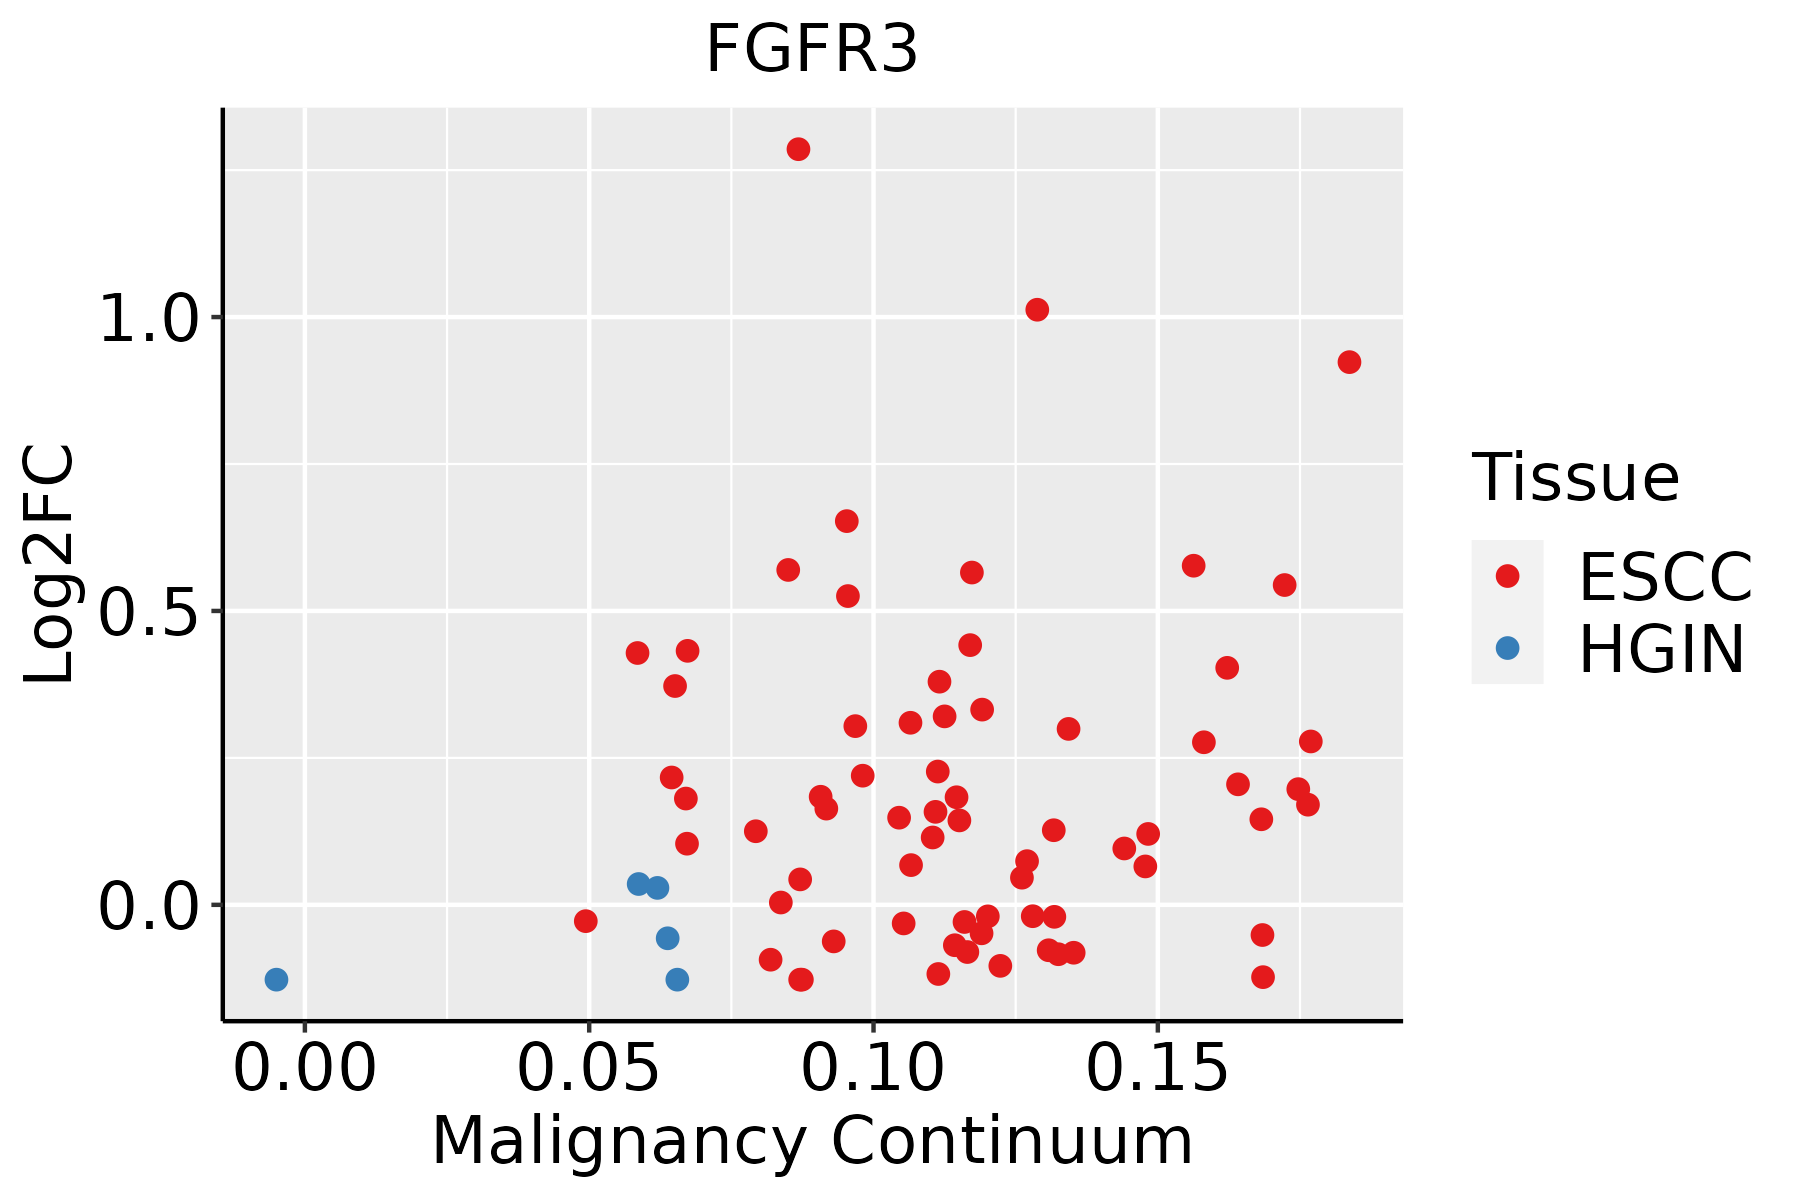 | ESCC: Esophageal squamous cell carcinoma |
| HGIN: High-grade intraepithelial neoplasias | ||
| LGIN: Low-grade intraepithelial neoplasias | ||
| Liver |  | HCC: Hepatocellular carcinoma |
| NAFLD: Non-alcoholic fatty liver disease | ||
| Oral Cavity | 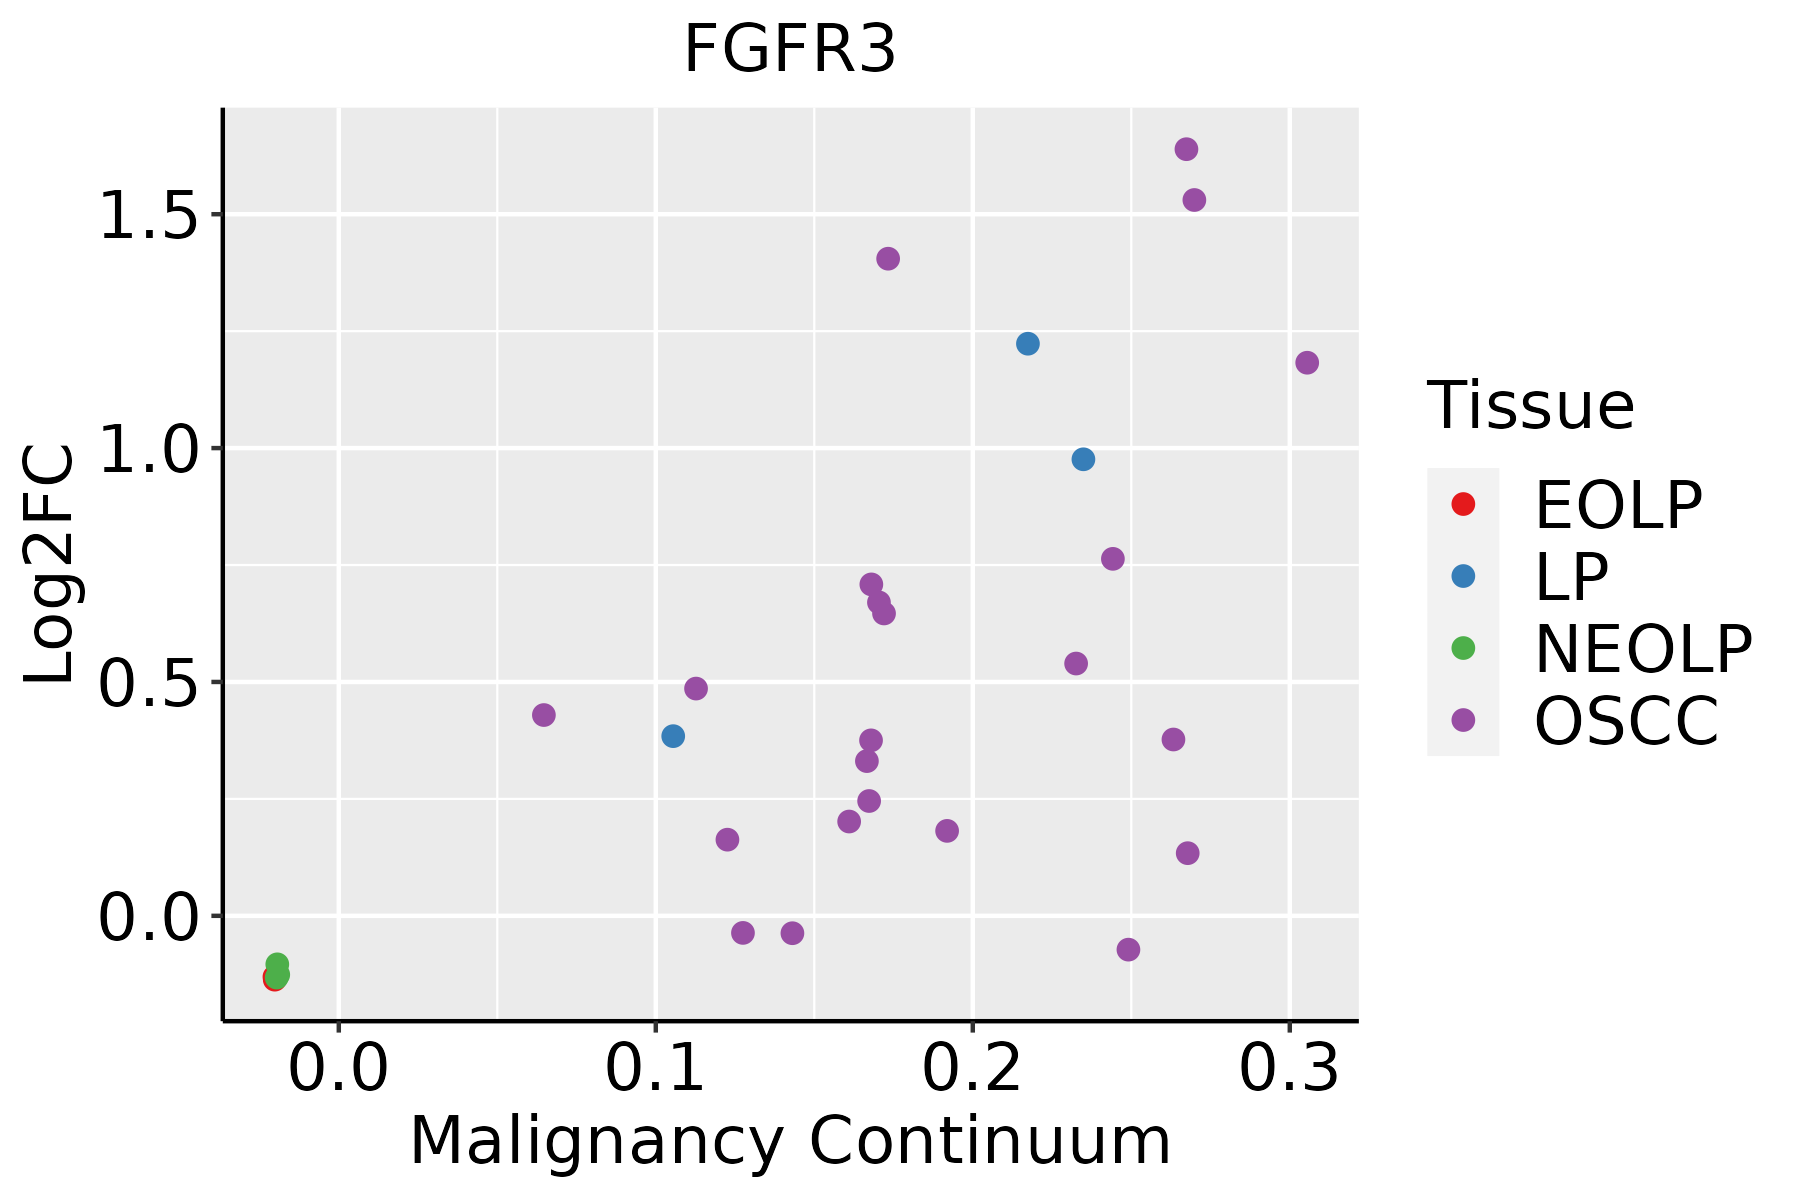 | EOLP: Erosive Oral lichen planus |
| LP: leukoplakia | ||
| NEOLP: Non-erosive oral lichen planus | ||
| OSCC: Oral squamous cell carcinoma | ||
| Prostate |  | BPH: Benign Prostatic Hyperplasia |
| Skin | 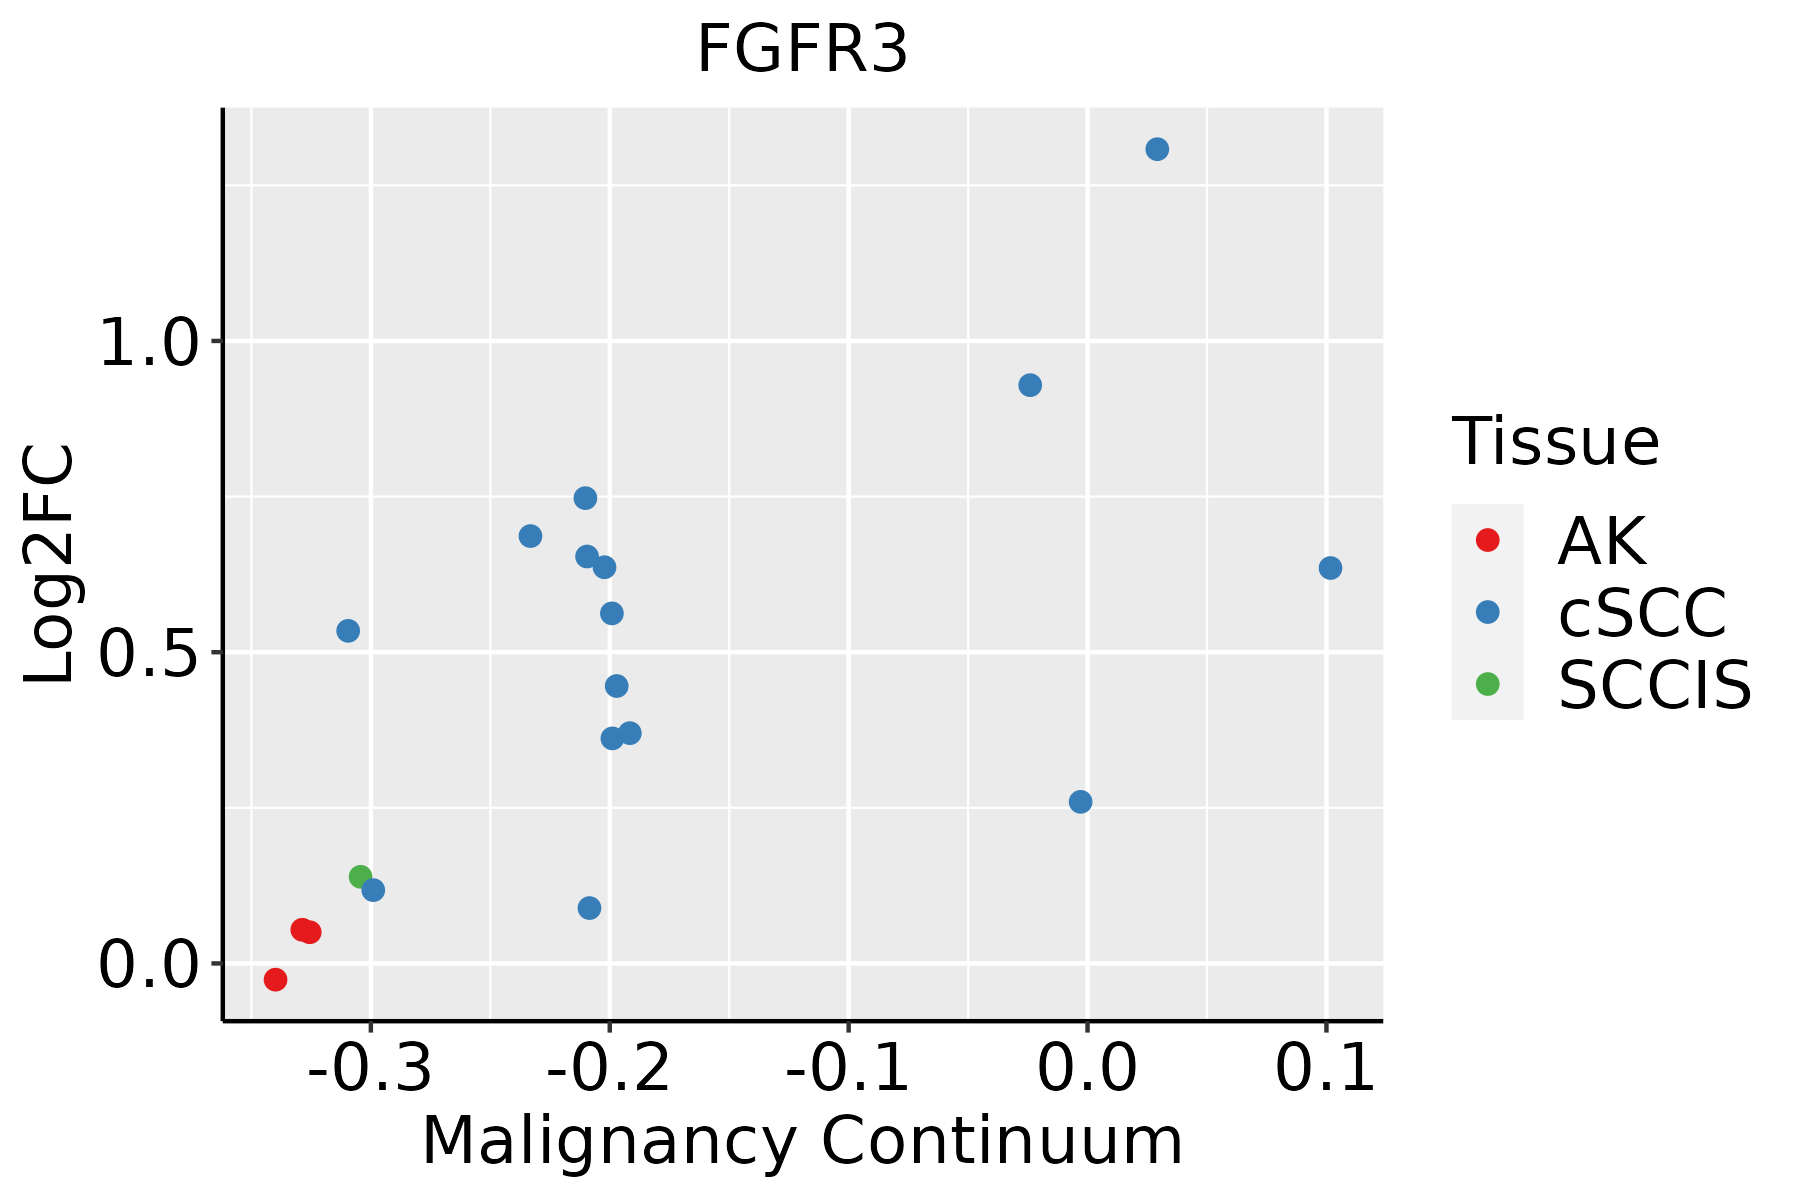 | AK: Actinic keratosis |
| cSCC: Cutaneous squamous cell carcinoma | ||
| SCCIS:squamous cell carcinoma in situ |
| ∗log2FC in expression of this searched gene in stem-like cells from each diseased tissue sample relative to stem-like cells in normal samples in each tissue plotted against the malignancy continuum. Samples are colored based on if they are from different disease stage. |
Top |
Malignant transformation related pathway analysis |
| Find out the enriched GO biological processes and KEGG pathways involved in transition from healthy to precancer to cancer |
| Tissue | Disease Stage | Enriched GO biological Processes |
| Colorectum | AD |  |
| Colorectum | SER |  |
| Colorectum | MSS |  |
| Colorectum | MSI-H |  |
| Colorectum | FAP |  |
| ∗Top 15 enriched GO BP terms are showed in the bar plot of each disease state in each tissue. Each row represents a significant GO biological process which is colored according to the -log10(p.adjust). |
| Page: 1 2 3 4 5 6 7 8 9 |
| GO ID | Tissue | Disease Stage | Description | Gene Ratio | Bg Ratio | pvalue | p.adjust | Count |
| GO:0097191111 | Esophagus | ESCC | extrinsic apoptotic signaling pathway | 159/8552 | 219/18723 | 4.12e-16 | 2.94e-14 | 159 |
| GO:004677710 | Esophagus | ESCC | protein autophosphorylation | 138/8552 | 227/18723 | 2.98e-06 | 3.38e-05 | 138 |
| GO:000150317 | Esophagus | ESCC | ossification | 232/8552 | 408/18723 | 3.00e-06 | 3.40e-05 | 232 |
| GO:003367420 | Esophagus | ESCC | positive regulation of kinase activity | 260/8552 | 467/18723 | 7.26e-06 | 7.22e-05 | 260 |
| GO:00459267 | Esophagus | ESCC | negative regulation of growth | 148/8552 | 249/18723 | 7.88e-06 | 7.73e-05 | 148 |
| GO:00182124 | Esophagus | ESCC | peptidyl-tyrosine modification | 202/8552 | 378/18723 | 1.34e-03 | 6.39e-03 | 202 |
| GO:00181084 | Esophagus | ESCC | peptidyl-tyrosine phosphorylation | 200/8552 | 375/18723 | 1.60e-03 | 7.45e-03 | 200 |
| GO:00603485 | Esophagus | ESCC | bone development | 115/8552 | 205/18723 | 1.67e-03 | 7.72e-03 | 115 |
| GO:00507303 | Esophagus | ESCC | regulation of peptidyl-tyrosine phosphorylation | 144/8552 | 264/18723 | 2.22e-03 | 9.78e-03 | 144 |
| GO:0003416 | Esophagus | ESCC | endochondral bone growth | 19/8552 | 26/18723 | 4.31e-03 | 1.71e-02 | 19 |
| GO:00487052 | Esophagus | ESCC | skeletal system morphogenesis | 120/8552 | 220/18723 | 4.90e-03 | 1.89e-02 | 120 |
| GO:00512161 | Esophagus | ESCC | cartilage development | 103/8552 | 190/18723 | 1.08e-02 | 3.67e-02 | 103 |
| GO:00192168 | Esophagus | ESCC | regulation of lipid metabolic process | 172/8552 | 331/18723 | 1.20e-02 | 4.02e-02 | 172 |
| GO:00020623 | Esophagus | ESCC | chondrocyte differentiation | 60/8552 | 106/18723 | 1.53e-02 | 4.94e-02 | 60 |
| GO:009719112 | Liver | Cirrhotic | extrinsic apoptotic signaling pathway | 97/4634 | 219/18723 | 1.82e-10 | 9.11e-09 | 97 |
| GO:001921611 | Liver | Cirrhotic | regulation of lipid metabolic process | 119/4634 | 331/18723 | 3.05e-06 | 5.39e-05 | 119 |
| GO:00015035 | Liver | Cirrhotic | ossification | 127/4634 | 408/18723 | 1.89e-03 | 1.19e-02 | 127 |
| GO:0060191 | Liver | Cirrhotic | regulation of lipase activity | 33/4634 | 91/18723 | 9.39e-03 | 4.29e-02 | 33 |
| GO:009719122 | Liver | HCC | extrinsic apoptotic signaling pathway | 143/7958 | 219/18723 | 6.99e-12 | 2.97e-10 | 143 |
| GO:00192162 | Liver | HCC | regulation of lipid metabolic process | 181/7958 | 331/18723 | 4.58e-06 | 5.79e-05 | 181 |
| Page: 1 2 3 |
| Pathway ID | Tissue | Disease Stage | Description | Gene Ratio | Bg Ratio | pvalue | p.adjust | qvalue | Count |
| hsa04144210 | Esophagus | ESCC | Endocytosis | 186/4205 | 251/8465 | 9.74e-16 | 4.66e-14 | 2.39e-14 | 186 |
| hsa0521910 | Esophagus | ESCC | Bladder cancer | 35/4205 | 41/8465 | 1.91e-06 | 1.15e-05 | 5.87e-06 | 35 |
| hsa0523018 | Esophagus | ESCC | Central carbon metabolism in cancer | 50/4205 | 70/8465 | 1.70e-04 | 6.62e-04 | 3.39e-04 | 50 |
| hsa0152110 | Esophagus | ESCC | EGFR tyrosine kinase inhibitor resistance | 55/4205 | 79/8465 | 2.44e-04 | 8.78e-04 | 4.50e-04 | 55 |
| hsa0481028 | Esophagus | ESCC | Regulation of actin cytoskeleton | 133/4205 | 229/8465 | 5.94e-03 | 1.48e-02 | 7.56e-03 | 133 |
| hsa041517 | Esophagus | ESCC | PI3K-Akt signaling pathway | 197/4205 | 354/8465 | 1.24e-02 | 2.83e-02 | 1.45e-02 | 197 |
| hsa0414437 | Esophagus | ESCC | Endocytosis | 186/4205 | 251/8465 | 9.74e-16 | 4.66e-14 | 2.39e-14 | 186 |
| hsa0521917 | Esophagus | ESCC | Bladder cancer | 35/4205 | 41/8465 | 1.91e-06 | 1.15e-05 | 5.87e-06 | 35 |
| hsa0523019 | Esophagus | ESCC | Central carbon metabolism in cancer | 50/4205 | 70/8465 | 1.70e-04 | 6.62e-04 | 3.39e-04 | 50 |
| hsa0152115 | Esophagus | ESCC | EGFR tyrosine kinase inhibitor resistance | 55/4205 | 79/8465 | 2.44e-04 | 8.78e-04 | 4.50e-04 | 55 |
| hsa04810112 | Esophagus | ESCC | Regulation of actin cytoskeleton | 133/4205 | 229/8465 | 5.94e-03 | 1.48e-02 | 7.56e-03 | 133 |
| hsa0415114 | Esophagus | ESCC | PI3K-Akt signaling pathway | 197/4205 | 354/8465 | 1.24e-02 | 2.83e-02 | 1.45e-02 | 197 |
| hsa0414412 | Liver | Cirrhotic | Endocytosis | 119/2530 | 251/8465 | 2.33e-09 | 4.56e-08 | 2.81e-08 | 119 |
| hsa0481021 | Liver | Cirrhotic | Regulation of actin cytoskeleton | 100/2530 | 229/8465 | 5.28e-06 | 5.50e-05 | 3.39e-05 | 100 |
| hsa052194 | Liver | Cirrhotic | Bladder cancer | 25/2530 | 41/8465 | 3.48e-05 | 2.57e-04 | 1.59e-04 | 25 |
| hsa015216 | Liver | Cirrhotic | EGFR tyrosine kinase inhibitor resistance | 35/2530 | 79/8465 | 4.50e-03 | 1.70e-02 | 1.05e-02 | 35 |
| hsa052308 | Liver | Cirrhotic | Central carbon metabolism in cancer | 30/2530 | 70/8465 | 1.41e-02 | 4.35e-02 | 2.68e-02 | 30 |
| hsa0414413 | Liver | Cirrhotic | Endocytosis | 119/2530 | 251/8465 | 2.33e-09 | 4.56e-08 | 2.81e-08 | 119 |
| hsa0481031 | Liver | Cirrhotic | Regulation of actin cytoskeleton | 100/2530 | 229/8465 | 5.28e-06 | 5.50e-05 | 3.39e-05 | 100 |
| hsa0521911 | Liver | Cirrhotic | Bladder cancer | 25/2530 | 41/8465 | 3.48e-05 | 2.57e-04 | 1.59e-04 | 25 |
| Page: 1 2 3 4 |
Top |
Cell-cell communication analysis |
| Identification of potential cell-cell interactions between two cell types and their ligand-receptor pairs for different disease states |
| Ligand | Receptor | LRpair | Pathway | Tissue | Disease Stage |
| FGF1 | FGFR3 | FGF1_FGFR3 | FGF | Cervix | CC |
| FGF1 | FGFR3 | FGF1_FGFR3 | FGF | Esophagus | ESCC |
| FGF18 | FGFR3 | FGF18_FGFR3 | FGF | Esophagus | ESCC |
| FGF19 | FGFR3 | FGF15_FGFR3 | FGF | Esophagus | ESCC |
| FGF1 | FGFR3 | FGF1_FGFR3 | FGF | HNSCC | OSCC |
| FGF2 | FGFR3 | FGF2_FGFR3 | FGF | HNSCC | OSCC |
| FGF18 | FGFR3 | FGF18_FGFR3 | FGF | HNSCC | OSCC |
| FGF2 | FGFR3 | FGF2_FGFR3 | FGF | HNSCC | Precancer |
| Page: 1 |
Top |
Single-cell gene regulatory network inference analysis |
| Find out the significant the regulons (TFs) and the target genes of each regulon across cell types for different disease states |
| TF | Cell Type | Tissue | Disease Stage | Target Gene | RSS | Regulon Activity |
| ∗The dot plots of a searched regulon are shown for all cell subpopulations in each disease state of each tissue based on the regulon specific score inferred using pySCENIC and by calculating the average expression. |
| Page: 1 |
Top |
Somatic mutation of malignant transformation related genes |
| Annotation of somatic variants for genes involved in malignant transformation |
| Hugo Symbol | Variant Class | Variant Classification | dbSNP RS | HGVSc | HGVSp | HGVSp Short | SWISSPROT | BIOTYPE | SIFT | PolyPhen | Tumor Sample Barcode | Tissue | Histology | Sex | Age | Stage | Therapy Types | Drugs | Outcome |
| FGFR3 | deletion | Frame_Shift_Del | novel | c.1262delN | p.Leu421ProfsTer13 | p.L421Pfs*13 | P22607 | protein_coding | TCGA-D8-A27V-01 | Breast | breast invasive carcinoma | Female | <65 | I/II | Hormone Therapy | tamoxiphen | SD | ||
| FGFR3 | SNV | Missense_Mutation | rs746415876 | c.1003G>A | p.Glu335Lys | p.E335K | P22607 | protein_coding | tolerated(0.09) | benign(0.343) | TCGA-A6-4107-01 | Colorectum | colon adenocarcinoma | Female | <65 | III/IV | Chemotherapy | 5 | SD |
| FGFR3 | SNV | Missense_Mutation | rs370064407 | c.1201N>T | p.Arg401Cys | p.R401C | P22607 | protein_coding | tolerated(0.07) | possibly_damaging(0.888) | TCGA-AA-3939-01 | Colorectum | colon adenocarcinoma | Male | >=65 | I/II | Unknown | Unknown | SD |
| FGFR3 | SNV | Missense_Mutation | novel | c.626N>G | p.Gln209Arg | p.Q209R | P22607 | protein_coding | tolerated(0.12) | benign(0.17) | TCGA-AA-A010-01 | Colorectum | colon adenocarcinoma | Female | <65 | I/II | Chemotherapy | folinic | CR |
| FGFR3 | SNV | Missense_Mutation | c.2035N>A | p.Val679Ile | p.V679I | P22607 | protein_coding | deleterious(0.01) | possibly_damaging(0.84) | TCGA-AA-A01R-01 | Colorectum | colon adenocarcinoma | Male | <65 | III/IV | Chemotherapy | 5-fluorouracil | PD | |
| FGFR3 | SNV | Missense_Mutation | c.1412G>A | p.Arg471Gln | p.R471Q | P22607 | protein_coding | deleterious(0) | probably_damaging(0.96) | TCGA-AD-6889-01 | Colorectum | colon adenocarcinoma | Male | >=65 | I/II | Chemotherapy | xeloda | PD | |
| FGFR3 | SNV | Missense_Mutation | c.1942N>A | p.Asp648Asn | p.D648N | P22607 | protein_coding | deleterious(0.02) | probably_damaging(1) | TCGA-AD-6895-01 | Colorectum | colon adenocarcinoma | Male | >=65 | III/IV | Unknown | Unknown | SD | |
| FGFR3 | SNV | Missense_Mutation | c.106N>A | p.Ala36Thr | p.A36T | P22607 | protein_coding | tolerated_low_confidence(0.43) | benign(0.001) | TCGA-AD-6964-01 | Colorectum | colon adenocarcinoma | Male | <65 | III/IV | Chemotherapy | folfox | PD | |
| FGFR3 | SNV | Missense_Mutation | c.1937N>T | p.Asn646Ile | p.N646I | P22607 | protein_coding | deleterious(0) | probably_damaging(0.997) | TCGA-AZ-4308-01 | Colorectum | colon adenocarcinoma | Female | <65 | III/IV | Targeted Molecular therapy | avastin | CR | |
| FGFR3 | SNV | Missense_Mutation | c.580N>A | p.Glu194Lys | p.E194K | P22607 | protein_coding | tolerated(0.09) | benign(0.347) | TCGA-AZ-4315-01 | Colorectum | colon adenocarcinoma | Male | <65 | I/II | Unknown | Unknown | SD |
| Page: 1 2 3 4 5 6 7 8 |
Top |
Related drugs of malignant transformation related genes |
| Identification of chemicals and drugs interact with genes involved in malignant transfromation |
| (DGIdb 4.0) |
| Entrez ID | Symbol | Category | Interaction Types | Drug Claim Name | Drug Name | PMIDs |
| 2261 | FGFR3 | CELL SURFACE, TYROSINE KINASE, KINASE, DRUG RESISTANCE, CLINICALLY ACTIONABLE, DRUGGABLE GENOME | FF-284 | 25169980,28034880,25589496 | ||
| 2261 | FGFR3 | CELL SURFACE, TYROSINE KINASE, KINASE, DRUG RESISTANCE, CLINICALLY ACTIONABLE, DRUGGABLE GENOME | inhibitor | ENMD-2076 | ENMD-2076 | |
| 2261 | FGFR3 | CELL SURFACE, TYROSINE KINASE, KINASE, DRUG RESISTANCE, CLINICALLY ACTIONABLE, DRUGGABLE GENOME | inhibitor | CHEMBL3039504 | NINTEDANIB ESYLATE | |
| 2261 | FGFR3 | CELL SURFACE, TYROSINE KINASE, KINASE, DRUG RESISTANCE, CLINICALLY ACTIONABLE, DRUGGABLE GENOME | CISPLATIN | CISPLATIN | 31316618,29941343 | |
| 2261 | FGFR3 | CELL SURFACE, TYROSINE KINASE, KINASE, DRUG RESISTANCE, CLINICALLY ACTIONABLE, DRUGGABLE GENOME | INCB054828 | PEMIGATINIB | ||
| 2261 | FGFR3 | CELL SURFACE, TYROSINE KINASE, KINASE, DRUG RESISTANCE, CLINICALLY ACTIONABLE, DRUGGABLE GENOME | GNF-PF-2301 | CHEMBL578061 | ||
| 2261 | FGFR3 | CELL SURFACE, TYROSINE KINASE, KINASE, DRUG RESISTANCE, CLINICALLY ACTIONABLE, DRUGGABLE GENOME | BKM120 | BUPARLISIB | 28108151 | |
| 2261 | FGFR3 | CELL SURFACE, TYROSINE KINASE, KINASE, DRUG RESISTANCE, CLINICALLY ACTIONABLE, DRUGGABLE GENOME | inhibitor | 178102559 | NINTEDANIB | |
| 2261 | FGFR3 | CELL SURFACE, TYROSINE KINASE, KINASE, DRUG RESISTANCE, CLINICALLY ACTIONABLE, DRUGGABLE GENOME | inhibitor | CHEMBL3545285 | XL-999 | |
| 2261 | FGFR3 | CELL SURFACE, TYROSINE KINASE, KINASE, DRUG RESISTANCE, CLINICALLY ACTIONABLE, DRUGGABLE GENOME | Erdafitinib | ERDAFITINIB |
| Page: 1 2 3 4 5 6 7 8 9 10 11 12 13 14 15 16 |

Copyright 2023-Present -The University of Texas Health Science Center at Houston |