
|
|||||
|
 | |
| |
| |
| |
| |
| |
|
Gene: PPARA |
Gene summary for PPARA |
| Gene information | Species | Human | Gene symbol | PPARA | Gene ID | 5465 |
| Gene name | peroxisome proliferator activated receptor alpha | |
| Gene Alias | NR1C1 | |
| Cytomap | 22q13.31 | |
| Gene Type | protein-coding | GO ID | GO:0000122 | UniProtAcc | F1D8S4 |
Top |
Malignant transformation analysis |
| Identification of the aberrant gene expression in precancerous and cancerous lesions by comparing the gene expression of stem-like cells in diseased tissues with normal stem cells |
| Entrez ID | Symbol | Replicates | Species | Organ | Tissue | Adj P-value | Log2FC | Malignancy |
| 5465 | PPARA | HTA11_1938_2000001011 | Human | Colorectum | AD | 1.28e-02 | 5.09e-01 | -0.0811 |
| 5465 | PPARA | HTA11_347_2000001011 | Human | Colorectum | AD | 5.60e-08 | 6.08e-01 | -0.1954 |
| 5465 | PPARA | HTA11_411_2000001011 | Human | Colorectum | SER | 1.47e-05 | 8.07e-01 | -0.2602 |
| 5465 | PPARA | HTA11_83_2000001011 | Human | Colorectum | SER | 5.28e-04 | 5.73e-01 | -0.1526 |
| 5465 | PPARA | HTA11_696_2000001011 | Human | Colorectum | AD | 8.21e-06 | 5.75e-01 | -0.1464 |
| 5465 | PPARA | HTA11_1391_2000001011 | Human | Colorectum | AD | 1.55e-07 | 7.61e-01 | -0.059 |
| 5465 | PPARA | F007 | Human | Colorectum | FAP | 1.20e-08 | -5.08e-01 | 0.1176 |
| 5465 | PPARA | A002-C-010 | Human | Colorectum | FAP | 1.32e-04 | -2.43e-01 | 0.242 |
| 5465 | PPARA | A001-C-207 | Human | Colorectum | FAP | 2.92e-04 | -1.40e-01 | 0.1278 |
| 5465 | PPARA | A015-C-203 | Human | Colorectum | FAP | 2.22e-36 | -5.06e-01 | -0.1294 |
| 5465 | PPARA | A015-C-204 | Human | Colorectum | FAP | 1.00e-06 | -3.08e-01 | -0.0228 |
| 5465 | PPARA | A014-C-040 | Human | Colorectum | FAP | 4.60e-07 | -5.02e-01 | -0.1184 |
| 5465 | PPARA | A002-C-201 | Human | Colorectum | FAP | 2.19e-16 | -3.40e-01 | 0.0324 |
| 5465 | PPARA | A002-C-203 | Human | Colorectum | FAP | 1.38e-02 | -7.67e-02 | 0.2786 |
| 5465 | PPARA | A001-C-119 | Human | Colorectum | FAP | 1.83e-09 | -4.23e-01 | -0.1557 |
| 5465 | PPARA | A001-C-108 | Human | Colorectum | FAP | 5.05e-16 | -1.35e-01 | -0.0272 |
| 5465 | PPARA | A002-C-205 | Human | Colorectum | FAP | 1.26e-28 | -4.30e-01 | -0.1236 |
| 5465 | PPARA | A001-C-104 | Human | Colorectum | FAP | 9.29e-03 | 8.15e-03 | 0.0184 |
| 5465 | PPARA | A015-C-005 | Human | Colorectum | FAP | 1.51e-04 | -2.53e-01 | -0.0336 |
| 5465 | PPARA | A015-C-006 | Human | Colorectum | FAP | 4.37e-19 | -5.16e-01 | -0.0994 |
| Page: 1 2 3 |
| Tissue | Expression Dynamics | Abbreviation |
| Colorectum (GSE201348) |  | FAP: Familial adenomatous polyposis |
| CRC: Colorectal cancer | ||
| Colorectum (HTA11) |  | AD: Adenomas |
| SER: Sessile serrated lesions | ||
| MSI-H: Microsatellite-high colorectal cancer | ||
| MSS: Microsatellite stable colorectal cancer | ||
| Liver | 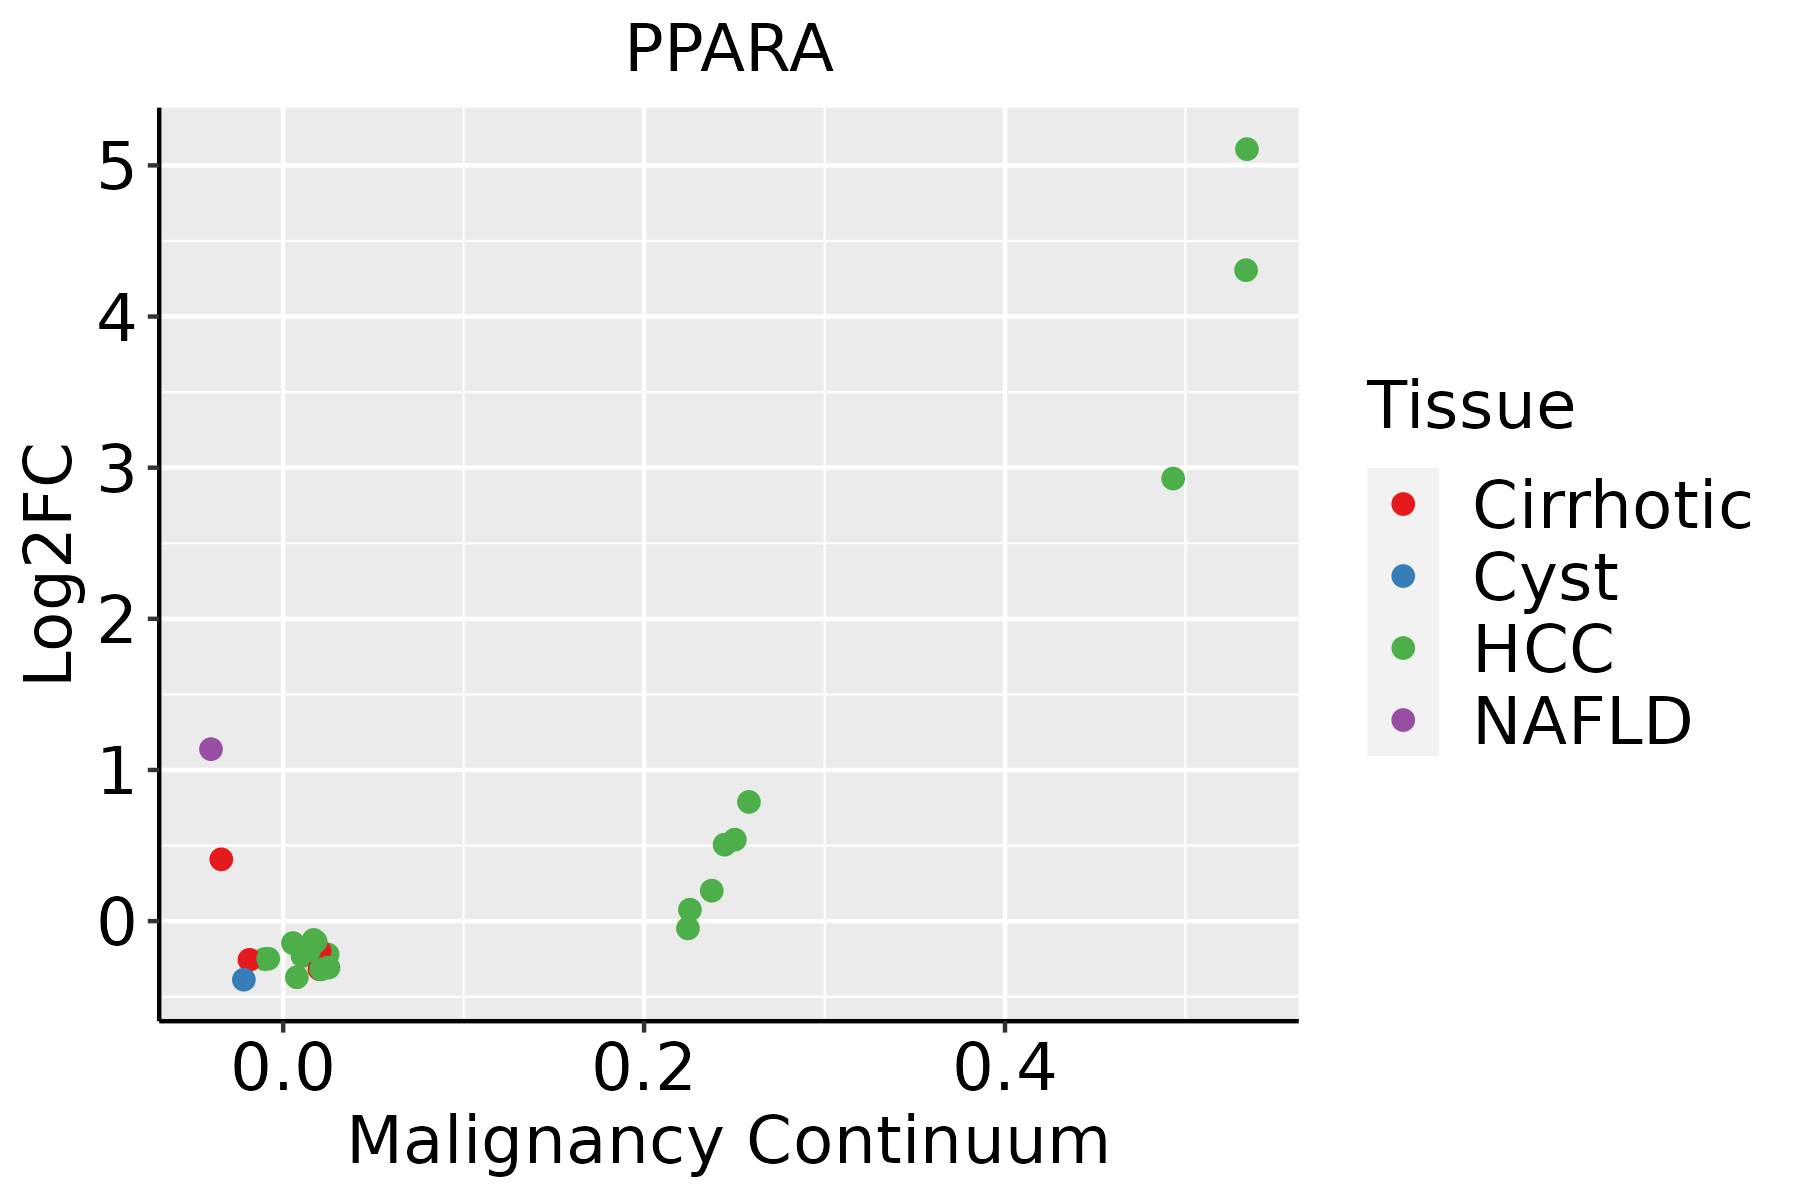 | HCC: Hepatocellular carcinoma |
| NAFLD: Non-alcoholic fatty liver disease | ||
| Oral Cavity | 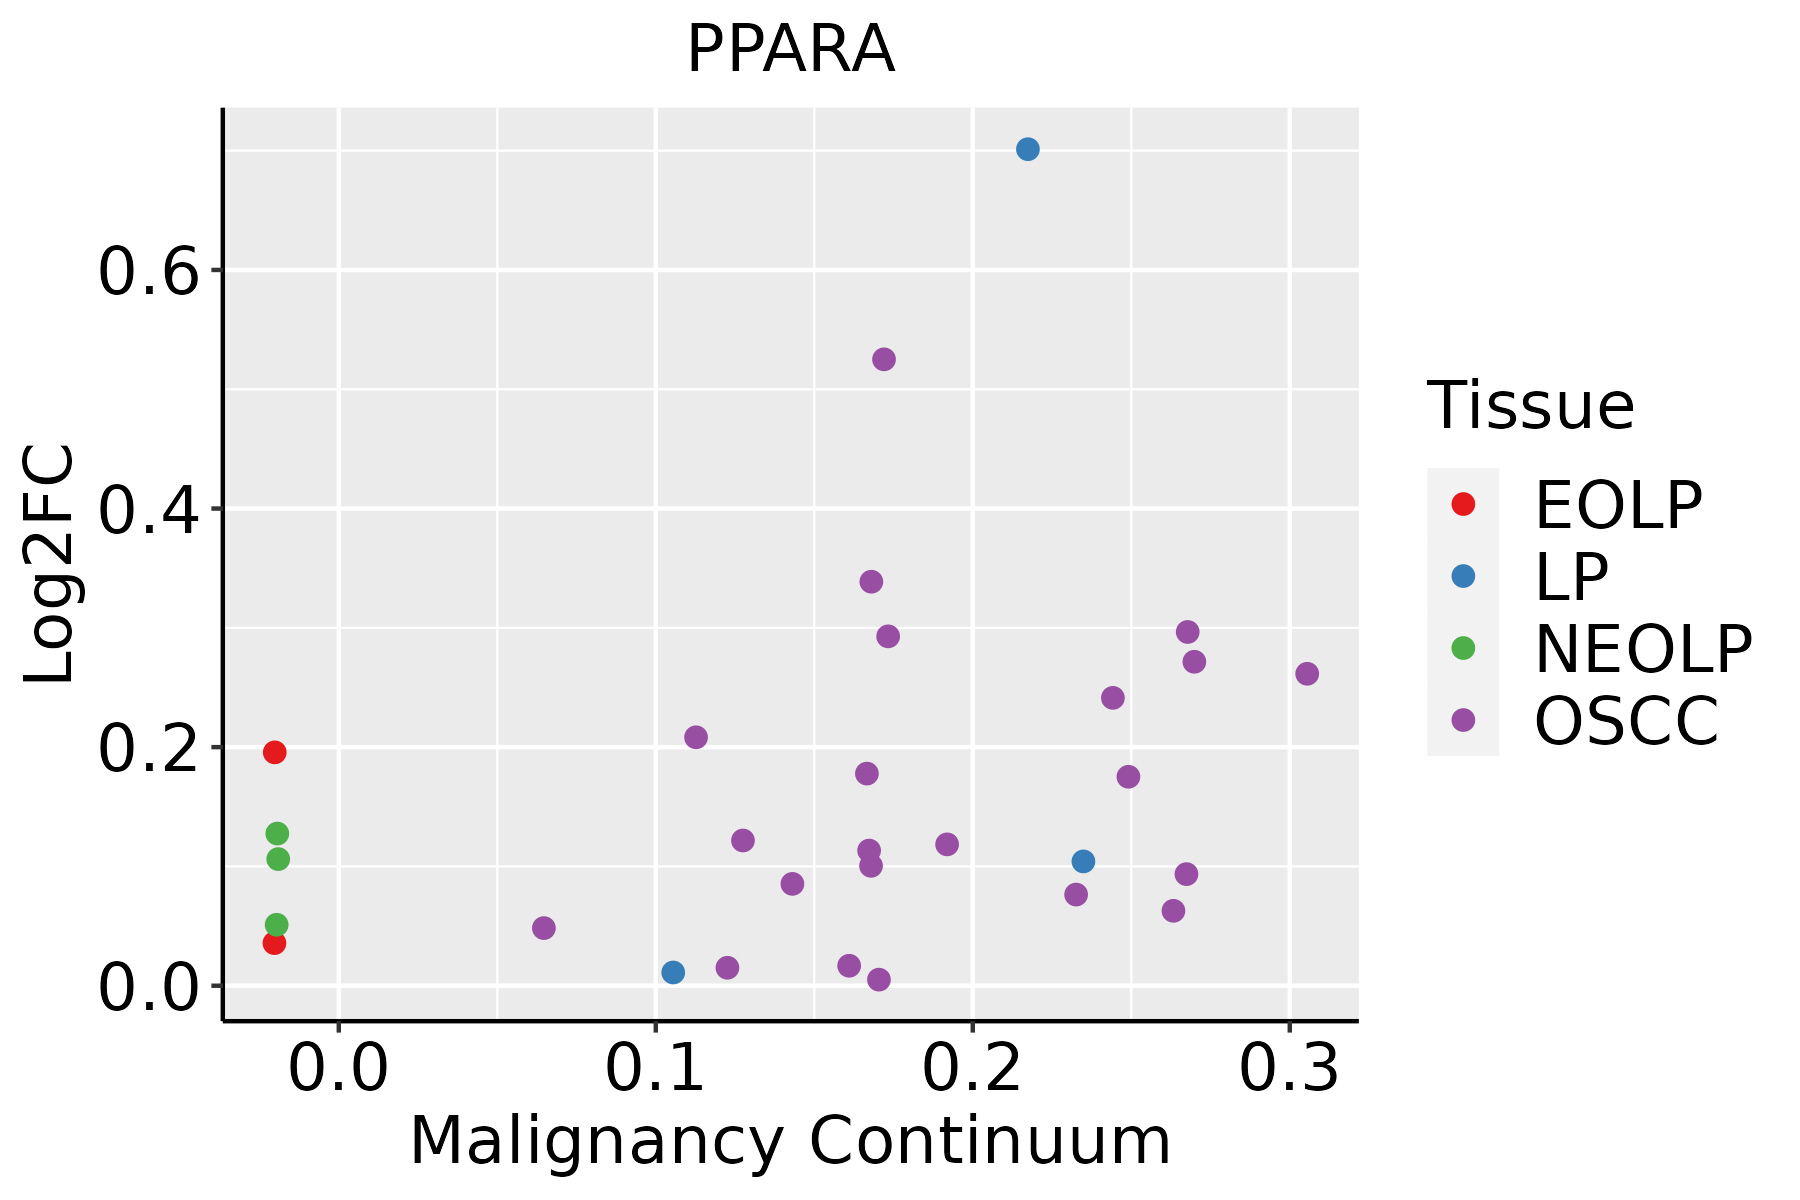 | EOLP: Erosive Oral lichen planus |
| LP: leukoplakia | ||
| NEOLP: Non-erosive oral lichen planus | ||
| OSCC: Oral squamous cell carcinoma |
| ∗log2FC in expression of this searched gene in stem-like cells from each diseased tissue sample relative to stem-like cells in normal samples in each tissue plotted against the malignancy continuum. Samples are colored based on if they are from different disease stage. |
Top |
Malignant transformation related pathway analysis |
| Find out the enriched GO biological processes and KEGG pathways involved in transition from healthy to precancer to cancer |
| Tissue | Disease Stage | Enriched GO biological Processes |
| Colorectum | AD |  |
| Colorectum | SER |  |
| Colorectum | MSS |  |
| Colorectum | MSI-H |  |
| Colorectum | FAP |  |
| ∗Top 15 enriched GO BP terms are showed in the bar plot of each disease state in each tissue. Each row represents a significant GO biological process which is colored according to the -log10(p.adjust). |
| Page: 1 2 3 4 5 6 7 8 9 |
| GO ID | Tissue | Disease Stage | Description | Gene Ratio | Bg Ratio | pvalue | p.adjust | Count |
| GO:0046034 | Colorectum | AD | ATP metabolic process | 142/3918 | 277/18723 | 2.64e-29 | 8.26e-26 | 142 |
| GO:0006091 | Colorectum | AD | generation of precursor metabolites and energy | 209/3918 | 490/18723 | 3.17e-28 | 6.61e-25 | 209 |
| GO:0016032 | Colorectum | AD | viral process | 168/3918 | 415/18723 | 4.67e-20 | 3.66e-17 | 168 |
| GO:0009896 | Colorectum | AD | positive regulation of catabolic process | 180/3918 | 492/18723 | 4.33e-16 | 1.94e-13 | 180 |
| GO:0009150 | Colorectum | AD | purine ribonucleotide metabolic process | 142/3918 | 368/18723 | 4.29e-15 | 1.17e-12 | 142 |
| GO:0006163 | Colorectum | AD | purine nucleotide metabolic process | 149/3918 | 396/18723 | 1.08e-14 | 2.80e-12 | 149 |
| GO:0072521 | Colorectum | AD | purine-containing compound metabolic process | 153/3918 | 416/18723 | 4.34e-14 | 1.01e-11 | 153 |
| GO:0031331 | Colorectum | AD | positive regulation of cellular catabolic process | 156/3918 | 427/18723 | 4.68e-14 | 1.05e-11 | 156 |
| GO:0009259 | Colorectum | AD | ribonucleotide metabolic process | 144/3918 | 385/18723 | 5.25e-14 | 1.13e-11 | 144 |
| GO:0009895 | Colorectum | AD | negative regulation of catabolic process | 124/3918 | 320/18723 | 1.66e-13 | 3.35e-11 | 124 |
| GO:0019693 | Colorectum | AD | ribose phosphate metabolic process | 145/3918 | 396/18723 | 3.01e-13 | 5.71e-11 | 145 |
| GO:0009117 | Colorectum | AD | nucleotide metabolic process | 168/3918 | 489/18723 | 2.20e-12 | 3.36e-10 | 168 |
| GO:0006753 | Colorectum | AD | nucleoside phosphate metabolic process | 169/3918 | 497/18723 | 4.99e-12 | 6.98e-10 | 169 |
| GO:0019058 | Colorectum | AD | viral life cycle | 119/3918 | 317/18723 | 6.18e-12 | 8.23e-10 | 119 |
| GO:0051098 | Colorectum | AD | regulation of binding | 126/3918 | 363/18723 | 6.01e-10 | 4.88e-08 | 126 |
| GO:0009144 | Colorectum | AD | purine nucleoside triphosphate metabolic process | 43/3918 | 88/18723 | 5.05e-09 | 3.19e-07 | 43 |
| GO:0009135 | Colorectum | AD | purine nucleoside diphosphate metabolic process | 47/3918 | 103/18723 | 1.61e-08 | 9.22e-07 | 47 |
| GO:0009179 | Colorectum | AD | purine ribonucleoside diphosphate metabolic process | 47/3918 | 103/18723 | 1.61e-08 | 9.22e-07 | 47 |
| GO:0006090 | Colorectum | AD | pyruvate metabolic process | 47/3918 | 106/18723 | 4.85e-08 | 2.55e-06 | 47 |
| GO:0009185 | Colorectum | AD | ribonucleoside diphosphate metabolic process | 47/3918 | 106/18723 | 4.85e-08 | 2.55e-06 | 47 |
| Page: 1 2 3 4 5 6 7 8 9 10 11 12 13 14 15 16 17 18 19 20 21 22 23 24 25 26 27 28 29 30 31 32 33 34 35 36 37 38 39 40 41 42 43 44 45 46 47 48 49 50 51 52 53 54 55 56 57 58 59 60 |
| Pathway ID | Tissue | Disease Stage | Description | Gene Ratio | Bg Ratio | pvalue | p.adjust | qvalue | Count |
| hsa05415 | Colorectum | AD | Diabetic cardiomyopathy | 114/2092 | 203/8465 | 3.65e-22 | 3.06e-20 | 1.95e-20 | 114 |
| hsa04932 | Colorectum | AD | Non-alcoholic fatty liver disease | 90/2092 | 155/8465 | 4.83e-19 | 1.80e-17 | 1.15e-17 | 90 |
| hsa04922 | Colorectum | AD | Glucagon signaling pathway | 41/2092 | 107/8465 | 1.18e-03 | 7.75e-03 | 4.94e-03 | 41 |
| hsa05160 | Colorectum | AD | Hepatitis C | 54/2092 | 157/8465 | 3.87e-03 | 1.96e-02 | 1.25e-02 | 54 |
| hsa054151 | Colorectum | AD | Diabetic cardiomyopathy | 114/2092 | 203/8465 | 3.65e-22 | 3.06e-20 | 1.95e-20 | 114 |
| hsa049321 | Colorectum | AD | Non-alcoholic fatty liver disease | 90/2092 | 155/8465 | 4.83e-19 | 1.80e-17 | 1.15e-17 | 90 |
| hsa049221 | Colorectum | AD | Glucagon signaling pathway | 41/2092 | 107/8465 | 1.18e-03 | 7.75e-03 | 4.94e-03 | 41 |
| hsa051601 | Colorectum | AD | Hepatitis C | 54/2092 | 157/8465 | 3.87e-03 | 1.96e-02 | 1.25e-02 | 54 |
| hsa054152 | Colorectum | SER | Diabetic cardiomyopathy | 103/1580 | 203/8465 | 1.45e-25 | 1.61e-23 | 1.17e-23 | 103 |
| hsa049322 | Colorectum | SER | Non-alcoholic fatty liver disease | 75/1580 | 155/8465 | 2.16e-17 | 5.99e-16 | 4.35e-16 | 75 |
| hsa049222 | Colorectum | SER | Glucagon signaling pathway | 38/1580 | 107/8465 | 2.57e-05 | 3.28e-04 | 2.38e-04 | 38 |
| hsa054153 | Colorectum | SER | Diabetic cardiomyopathy | 103/1580 | 203/8465 | 1.45e-25 | 1.61e-23 | 1.17e-23 | 103 |
| hsa049323 | Colorectum | SER | Non-alcoholic fatty liver disease | 75/1580 | 155/8465 | 2.16e-17 | 5.99e-16 | 4.35e-16 | 75 |
| hsa049223 | Colorectum | SER | Glucagon signaling pathway | 38/1580 | 107/8465 | 2.57e-05 | 3.28e-04 | 2.38e-04 | 38 |
| hsa054158 | Colorectum | FAP | Diabetic cardiomyopathy | 70/1404 | 203/8465 | 2.62e-10 | 2.18e-08 | 1.33e-08 | 70 |
| hsa049328 | Colorectum | FAP | Non-alcoholic fatty liver disease | 54/1404 | 155/8465 | 1.98e-08 | 6.20e-07 | 3.77e-07 | 54 |
| hsa049226 | Colorectum | FAP | Glucagon signaling pathway | 32/1404 | 107/8465 | 4.08e-04 | 3.10e-03 | 1.89e-03 | 32 |
| hsa049312 | Colorectum | FAP | Insulin resistance | 32/1404 | 108/8465 | 4.90e-04 | 3.56e-03 | 2.16e-03 | 32 |
| hsa04024 | Colorectum | FAP | cAMP signaling pathway | 51/1404 | 225/8465 | 1.02e-02 | 3.68e-02 | 2.24e-02 | 51 |
| hsa054159 | Colorectum | FAP | Diabetic cardiomyopathy | 70/1404 | 203/8465 | 2.62e-10 | 2.18e-08 | 1.33e-08 | 70 |
| Page: 1 2 3 4 5 |
Top |
Cell-cell communication analysis |
| Identification of potential cell-cell interactions between two cell types and their ligand-receptor pairs for different disease states |
| Ligand | Receptor | LRpair | Pathway | Tissue | Disease Stage |
| Page: 1 |
Top |
Single-cell gene regulatory network inference analysis |
| Find out the significant the regulons (TFs) and the target genes of each regulon across cell types for different disease states |
| TF | Cell Type | Tissue | Disease Stage | Target Gene | RSS | Regulon Activity |
| PPARA | MVA | Breast | Healthy | TNFRSF4,SH3TC1,SLFN11, etc. | 1.51e-01 |  |
| PPARA | MVA | Breast | Precancer | TNFRSF4,SH3TC1,SLFN11, etc. | 2.91e-01 |  |
| PPARA | PVA | Breast | Precancer | TNFRSF4,SH3TC1,SLFN11, etc. | 2.39e-01 | |
| PPARA | cDC | Lung | IAC | CEP112,PIGL,AL683807.1, etc. | 1.94e-02 |  |
| PPARA | M1MAC | Prostate | Healthy | SLC18B1,PTPN9,TGFBR1, etc. | 1.52e-01 |  |
| PPARA | PTC | Thyroid | ADJ | CCDC69,SAA2,USP43, etc. | 2.14e-01 |  |
| PPARA | TFC | Thyroid | ATC | CCDC69,SAA2,USP43, etc. | 8.84e-02 |  |
| PPARA | iATC | Thyroid | ATC | CCDC69,SAA2,USP43, etc. | 1.25e-01 | |
| ∗The dot plots of a searched regulon are shown for all cell subpopulations in each disease state of each tissue based on the regulon specific score inferred using pySCENIC and by calculating the average expression. |
| Page: 1 |
Top |
Somatic mutation of malignant transformation related genes |
| Annotation of somatic variants for genes involved in malignant transformation |
| Hugo Symbol | Variant Class | Variant Classification | dbSNP RS | HGVSc | HGVSp | HGVSp Short | SWISSPROT | BIOTYPE | SIFT | PolyPhen | Tumor Sample Barcode | Tissue | Histology | Sex | Age | Stage | Therapy Types | Drugs | Outcome |
| PPARA | SNV | Missense_Mutation | c.1091N>C | p.Lys364Thr | p.K364T | Q07869 | protein_coding | deleterious(0) | probably_damaging(0.973) | TCGA-AC-A23H-01 | Breast | breast invasive carcinoma | Female | >=65 | I/II | Unknown | Unknown | PD | |
| PPARA | SNV | Missense_Mutation | novel | c.533G>T | p.Arg178Ile | p.R178I | Q07869 | protein_coding | deleterious(0) | benign(0.418) | TCGA-AN-A046-01 | Breast | breast invasive carcinoma | Female | >=65 | I/II | Unknown | Unknown | SD |
| PPARA | SNV | Missense_Mutation | c.990G>T | p.Met330Ile | p.M330I | Q07869 | protein_coding | tolerated(0.13) | benign(0.145) | TCGA-AO-A1KT-01 | Breast | breast invasive carcinoma | Female | >=65 | I/II | Chemotherapy | fluorouracil | SD | |
| PPARA | deletion | In_Frame_Del | c.1365_1367delNNN | p.Leu456del | p.L456del | Q07869 | protein_coding | TCGA-A1-A0SH-01 | Breast | breast invasive carcinoma | Female | <65 | I/II | Chemotherapy | tc | SD | |||
| PPARA | insertion | Frame_Shift_Ins | novel | c.582_583insCCCTGCATACGCTCAAGGGCAGATGGGCCCCCCACAACCA | p.Ile195ProfsTer18 | p.I195Pfs*18 | Q07869 | protein_coding | TCGA-E2-A14Y-01 | Breast | breast invasive carcinoma | Female | <65 | I/II | Chemotherapy | carboplatin | SD | ||
| PPARA | SNV | Missense_Mutation | c.1162N>T | p.Arg388Cys | p.R388C | Q07869 | protein_coding | deleterious(0.01) | possibly_damaging(0.774) | TCGA-C5-A1BQ-01 | Cervix | cervical & endocervical cancer | Female | >=65 | III/IV | Chemotherapy | cisplatin | CR | |
| PPARA | SNV | Missense_Mutation | rs561580529 | c.206N>T | p.Thr69Met | p.T69M | Q07869 | protein_coding | tolerated_low_confidence(0.13) | benign(0.428) | TCGA-A6-2672-01 | Colorectum | colon adenocarcinoma | Female | >=65 | III/IV | Unknown | Unknown | SD |
| PPARA | SNV | Missense_Mutation | rs559996245 | c.268N>A | p.Val90Met | p.V90M | Q07869 | protein_coding | tolerated(0.11) | benign(0.063) | TCGA-AA-3492-01 | Colorectum | colon adenocarcinoma | Female | >=65 | I/II | Unknown | Unknown | SD |
| PPARA | SNV | Missense_Mutation | novel | c.850N>A | p.Val284Ile | p.V284I | Q07869 | protein_coding | tolerated(0.23) | probably_damaging(0.972) | TCGA-AA-3877-01 | Colorectum | colon adenocarcinoma | Female | >=65 | I/II | Unknown | Unknown | SD |
| PPARA | SNV | Missense_Mutation | c.383N>A | p.Arg128Gln | p.R128Q | Q07869 | protein_coding | deleterious(0) | probably_damaging(0.996) | TCGA-AZ-6601-01 | Colorectum | colon adenocarcinoma | Male | >=65 | I/II | Unknown | Unknown | PD |
| Page: 1 2 3 4 5 6 |
Top |
Related drugs of malignant transformation related genes |
| Identification of chemicals and drugs interact with genes involved in malignant transfromation |
| (DGIdb 4.0) |
| Entrez ID | Symbol | Category | Interaction Types | Drug Claim Name | Drug Name | PMIDs |
| 5465 | PPARA | TRANSCRIPTION FACTOR, ENZYME, DRUGGABLE GENOME, NUCLEAR HORMONE RECEPTOR | agonist | CHEMBL186179 | MURAGLITAZAR | |
| 5465 | PPARA | TRANSCRIPTION FACTOR, ENZYME, DRUGGABLE GENOME, NUCLEAR HORMONE RECEPTOR | CIGLITAZONE | CIGLITAZONE | 23566516 | |
| 5465 | PPARA | TRANSCRIPTION FACTOR, ENZYME, DRUGGABLE GENOME, NUCLEAR HORMONE RECEPTOR | agonist | CHEMBL424133 | LY-518674 | |
| 5465 | PPARA | TRANSCRIPTION FACTOR, ENZYME, DRUGGABLE GENOME, NUCLEAR HORMONE RECEPTOR | DRF 10945 | |||
| 5465 | PPARA | TRANSCRIPTION FACTOR, ENZYME, DRUGGABLE GENOME, NUCLEAR HORMONE RECEPTOR | 2,4,6-TRIBROMOPHENOL | CHEMBL220087 | ||
| 5465 | PPARA | TRANSCRIPTION FACTOR, ENZYME, DRUGGABLE GENOME, NUCLEAR HORMONE RECEPTOR | CDT-fenofibrate | |||
| 5465 | PPARA | TRANSCRIPTION FACTOR, ENZYME, DRUGGABLE GENOME, NUCLEAR HORMONE RECEPTOR | phenprocoumon | PHENPROCOUMON | 25461249 |
| Page: 1 2 3 4 5 6 7 8 9 10 11 12 13 |

Copyright 2023-Present -The University of Texas Health Science Center at Houston |