
|
|||||
|
 | |
| |
| |
| |
| |
| |
|
Gene: WISP1 |
Gene summary for WISP1 |
| Gene information | Species | Human | Gene symbol | WISP1 | Gene ID | 8840 |
| Gene name | cellular communication network factor 4 | |
| Gene Alias | WISP1 | |
| Cytomap | 8q24.22 | |
| Gene Type | protein-coding | GO ID | GO:0001501 | UniProtAcc | O95388 |
Top |
Malignant transformation analysis |
| Identification of the aberrant gene expression in precancerous and cancerous lesions by comparing the gene expression of stem-like cells in diseased tissues with normal stem cells |
| Entrez ID | Symbol | Replicates | Species | Organ | Tissue | Adj P-value | Log2FC | Malignancy |
| 8840 | WISP1 | C38 | Human | Oral cavity | OSCC | 3.77e-20 | 1.23e+00 | 0.172 |
| 8840 | WISP1 | C46 | Human | Oral cavity | OSCC | 1.19e-04 | 1.49e-01 | 0.1673 |
| 8840 | WISP1 | LN38 | Human | Oral cavity | OSCC | 4.47e-05 | 6.74e-01 | 0.168 |
| 8840 | WISP1 | LN46 | Human | Oral cavity | OSCC | 9.20e-04 | 2.05e-01 | 0.1666 |
| 8840 | WISP1 | ATC12 | Human | Thyroid | ATC | 4.82e-02 | 1.00e-01 | 0.34 |
| 8840 | WISP1 | ATC13 | Human | Thyroid | ATC | 4.82e-02 | 7.86e-02 | 0.34 |
| 8840 | WISP1 | ATC2 | Human | Thyroid | ATC | 1.60e-07 | 5.69e-01 | 0.34 |
| 8840 | WISP1 | ATC4 | Human | Thyroid | ATC | 6.21e-03 | 1.20e-01 | 0.34 |
| Page: 1 |
| Tissue | Expression Dynamics | Abbreviation |
| Oral Cavity | 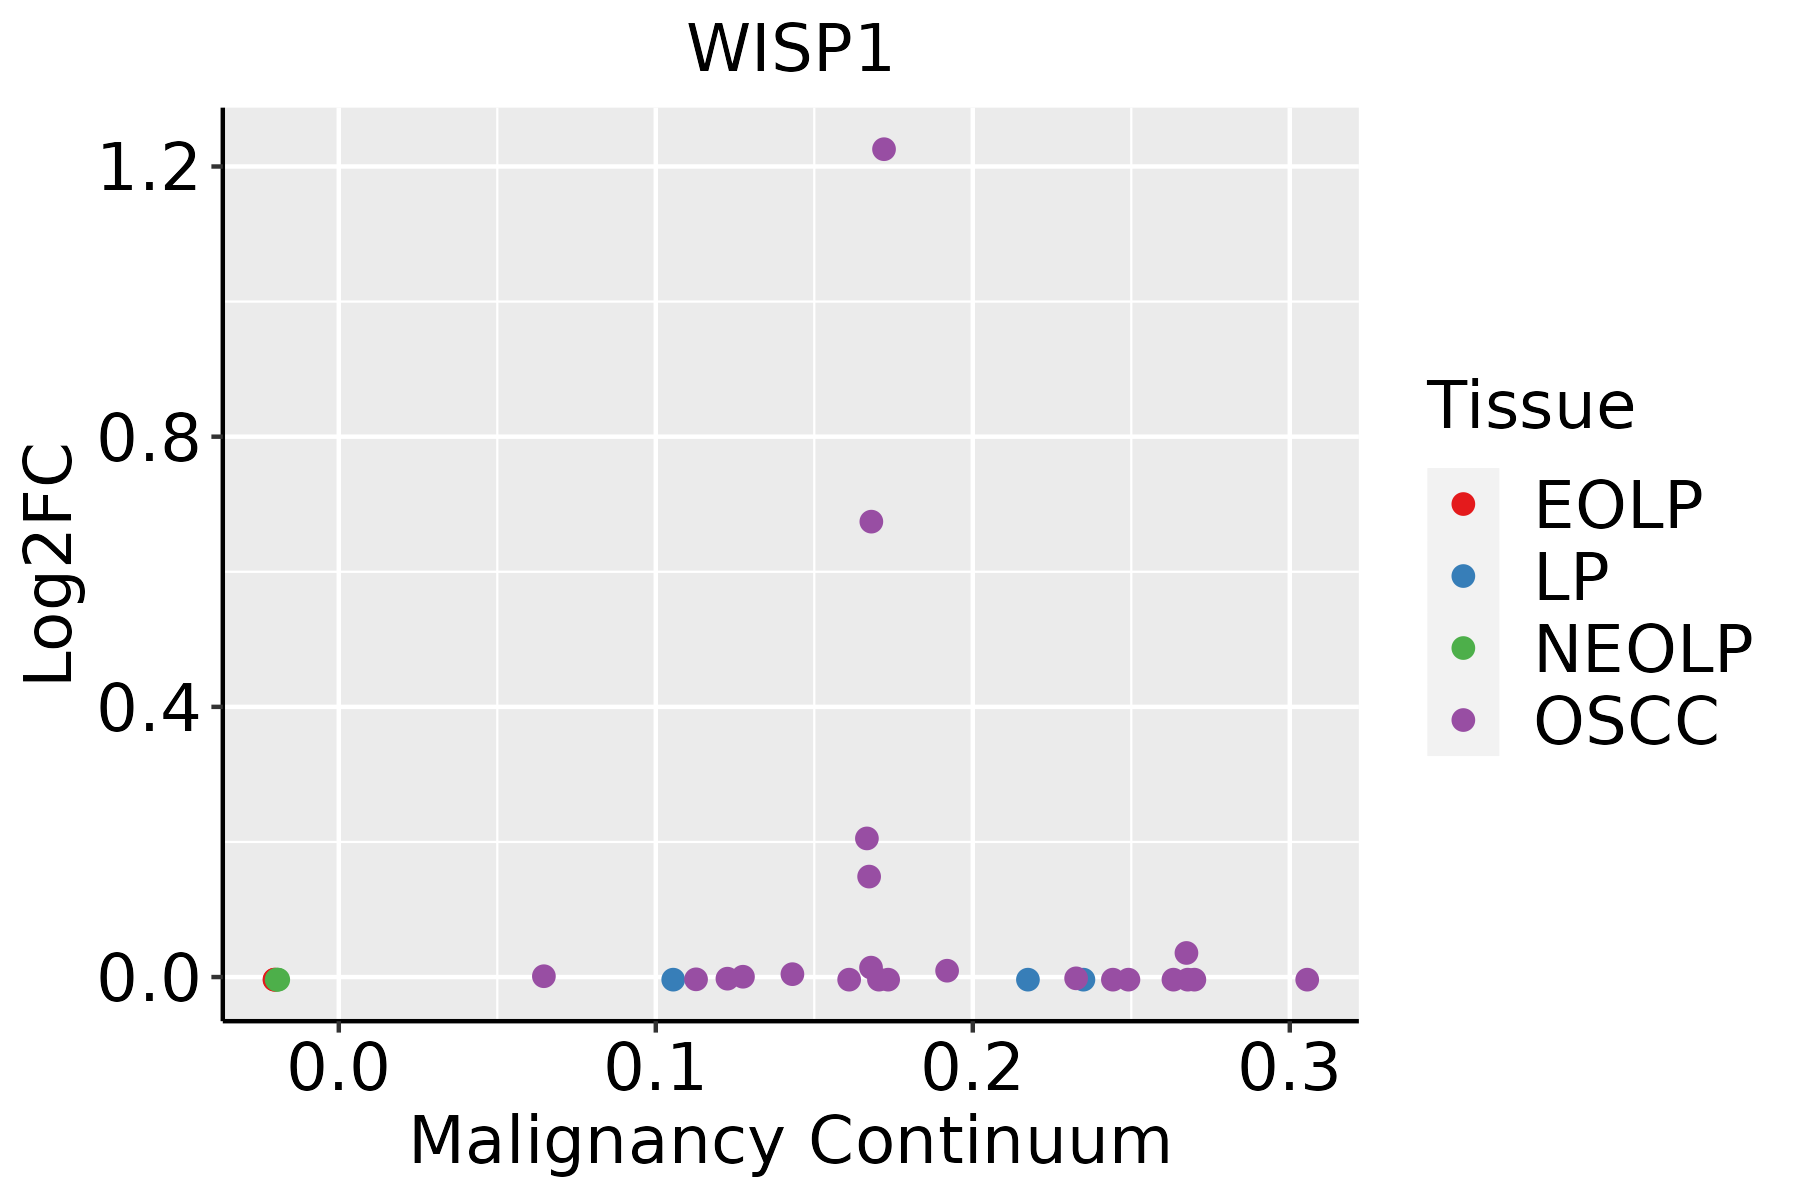 | EOLP: Erosive Oral lichen planus |
| LP: leukoplakia | ||
| NEOLP: Non-erosive oral lichen planus | ||
| OSCC: Oral squamous cell carcinoma | ||
| Thyroid |  | ATC: Anaplastic thyroid cancer |
| HT: Hashimoto's thyroiditis | ||
| PTC: Papillary thyroid cancer |
| ∗log2FC in expression of this searched gene in stem-like cells from each diseased tissue sample relative to stem-like cells in normal samples in each tissue plotted against the malignancy continuum. Samples are colored based on if they are from different disease stage. |
Top |
Malignant transformation related pathway analysis |
| Find out the enriched GO biological processes and KEGG pathways involved in transition from healthy to precancer to cancer |
| Tissue | Disease Stage | Enriched GO biological Processes |
| Colorectum | AD |  |
| Colorectum | SER |  |
| Colorectum | MSS |  |
| Colorectum | MSI-H |  |
| Colorectum | FAP |  |
| ∗Top 15 enriched GO BP terms are showed in the bar plot of each disease state in each tissue. Each row represents a significant GO biological process which is colored according to the -log10(p.adjust). |
| Page: 1 2 3 4 5 6 7 8 9 |
| GO ID | Tissue | Disease Stage | Description | Gene Ratio | Bg Ratio | pvalue | p.adjust | Count |
| Page: 1 |
| Pathway ID | Tissue | Disease Stage | Description | Gene Ratio | Bg Ratio | pvalue | p.adjust | qvalue | Count |
| Page: 1 |
Top |
Cell-cell communication analysis |
| Identification of potential cell-cell interactions between two cell types and their ligand-receptor pairs for different disease states |
| Ligand | Receptor | LRpair | Pathway | Tissue | Disease Stage |
| Page: 1 |
Top |
Single-cell gene regulatory network inference analysis |
| Find out the significant the regulons (TFs) and the target genes of each regulon across cell types for different disease states |
| TF | Cell Type | Tissue | Disease Stage | Target Gene | RSS | Regulon Activity |
| ∗The dot plots of a searched regulon are shown for all cell subpopulations in each disease state of each tissue based on the regulon specific score inferred using pySCENIC and by calculating the average expression. |
| Page: 1 |
Top |
Somatic mutation of malignant transformation related genes |
| Annotation of somatic variants for genes involved in malignant transformation |
| Hugo Symbol | Variant Class | Variant Classification | dbSNP RS | HGVSc | HGVSp | HGVSp Short | SWISSPROT | BIOTYPE | SIFT | PolyPhen | Tumor Sample Barcode | Tissue | Histology | Sex | Age | Stage | Therapy Types | Drugs | Outcome |
| WISP1 | insertion | Frame_Shift_Ins | rs773550125 | c.482_483insC | p.Arg164AlafsTer18 | p.R164Afs*18 | O95388 | protein_coding | TCGA-BR-8078-01 | Stomach | stomach adenocarcinoma | Female | >=65 | I/II | Unknown | Unknown | SD | ||
| WISP1 | deletion | Frame_Shift_Del | c.488delC | p.Pro163ArgfsTer11 | p.P163Rfs*11 | O95388 | protein_coding | TCGA-VQ-A8PP-01 | Stomach | stomach adenocarcinoma | Male | >=65 | III/IV | Chemotherapy | fluorouracil | PD | |||
| WISP1 | deletion | Frame_Shift_Del | c.488delC | p.Pro163ArgfsTer11 | p.P163Rfs*11 | O95388 | protein_coding | TCGA-VQ-A91D-01 | Stomach | stomach adenocarcinoma | Male | >=65 | III/IV | Chemotherapy | fluorouracil | PD |
| Page: 1 2 3 4 5 6 7 8 9 |
Top |
Related drugs of malignant transformation related genes |
| Identification of chemicals and drugs interact with genes involved in malignant transfromation |
| (DGIdb 4.0) |
| Entrez ID | Symbol | Category | Interaction Types | Drug Claim Name | Drug Name | PMIDs |
| Page: 1 |

Copyright 2023-Present -The University of Texas Health Science Center at Houston |