
|
|||||
|
 | |
| |
| |
| |
| |
| |
|
Gene: TGM1 |
Gene summary for TGM1 |
| Gene information | Species | Human | Gene symbol | TGM1 | Gene ID | 7051 |
| Gene name | transglutaminase 1 | |
| Gene Alias | ARCI1 | |
| Cytomap | 14q12 | |
| Gene Type | protein-coding | GO ID | GO:0006464 | UniProtAcc | P22735 |
Top |
Malignant transformation analysis |
| Identification of the aberrant gene expression in precancerous and cancerous lesions by comparing the gene expression of stem-like cells in diseased tissues with normal stem cells |
| Entrez ID | Symbol | Replicates | Species | Organ | Tissue | Adj P-value | Log2FC | Malignancy |
| 7051 | TGM1 | P8T-E | Human | Esophagus | ESCC | 2.51e-10 | 2.78e-01 | 0.0889 |
| 7051 | TGM1 | P52T-E | Human | Esophagus | ESCC | 2.19e-03 | 1.36e-01 | 0.1555 |
| 7051 | TGM1 | P54T-E | Human | Esophagus | ESCC | 4.52e-14 | 4.27e-01 | 0.0975 |
| 7051 | TGM1 | P74T-E | Human | Esophagus | ESCC | 7.44e-27 | 8.71e-01 | 0.1479 |
| 7051 | TGM1 | P75T-E | Human | Esophagus | ESCC | 2.96e-02 | 5.15e-02 | 0.1125 |
| 7051 | TGM1 | P89T-E | Human | Esophagus | ESCC | 8.41e-06 | 5.75e-01 | 0.1752 |
| 7051 | TGM1 | P91T-E | Human | Esophagus | ESCC | 3.04e-03 | 4.11e-01 | 0.1828 |
| 7051 | TGM1 | P107T-E | Human | Esophagus | ESCC | 1.31e-03 | 1.64e-01 | 0.171 |
| 7051 | TGM1 | P130T-E | Human | Esophagus | ESCC | 1.30e-03 | 1.74e-01 | 0.1676 |
| 7051 | TGM1 | C04 | Human | Oral cavity | OSCC | 8.77e-08 | 4.56e-01 | 0.2633 |
| 7051 | TGM1 | C21 | Human | Oral cavity | OSCC | 2.02e-06 | 3.07e-01 | 0.2678 |
| 7051 | TGM1 | C57 | Human | Oral cavity | OSCC | 4.87e-22 | 1.34e+00 | 0.1679 |
| 7051 | TGM1 | C06 | Human | Oral cavity | OSCC | 3.92e-03 | 5.30e-01 | 0.2699 |
| 7051 | TGM1 | SYSMH2 | Human | Oral cavity | OSCC | 2.99e-02 | 1.69e-01 | 0.2326 |
| 7051 | TGM1 | SYSMH3 | Human | Oral cavity | OSCC | 2.48e-03 | 2.49e-01 | 0.2442 |
| Page: 1 |
| Tissue | Expression Dynamics | Abbreviation |
| Esophagus |  | ESCC: Esophageal squamous cell carcinoma |
| HGIN: High-grade intraepithelial neoplasias | ||
| LGIN: Low-grade intraepithelial neoplasias | ||
| Oral Cavity | 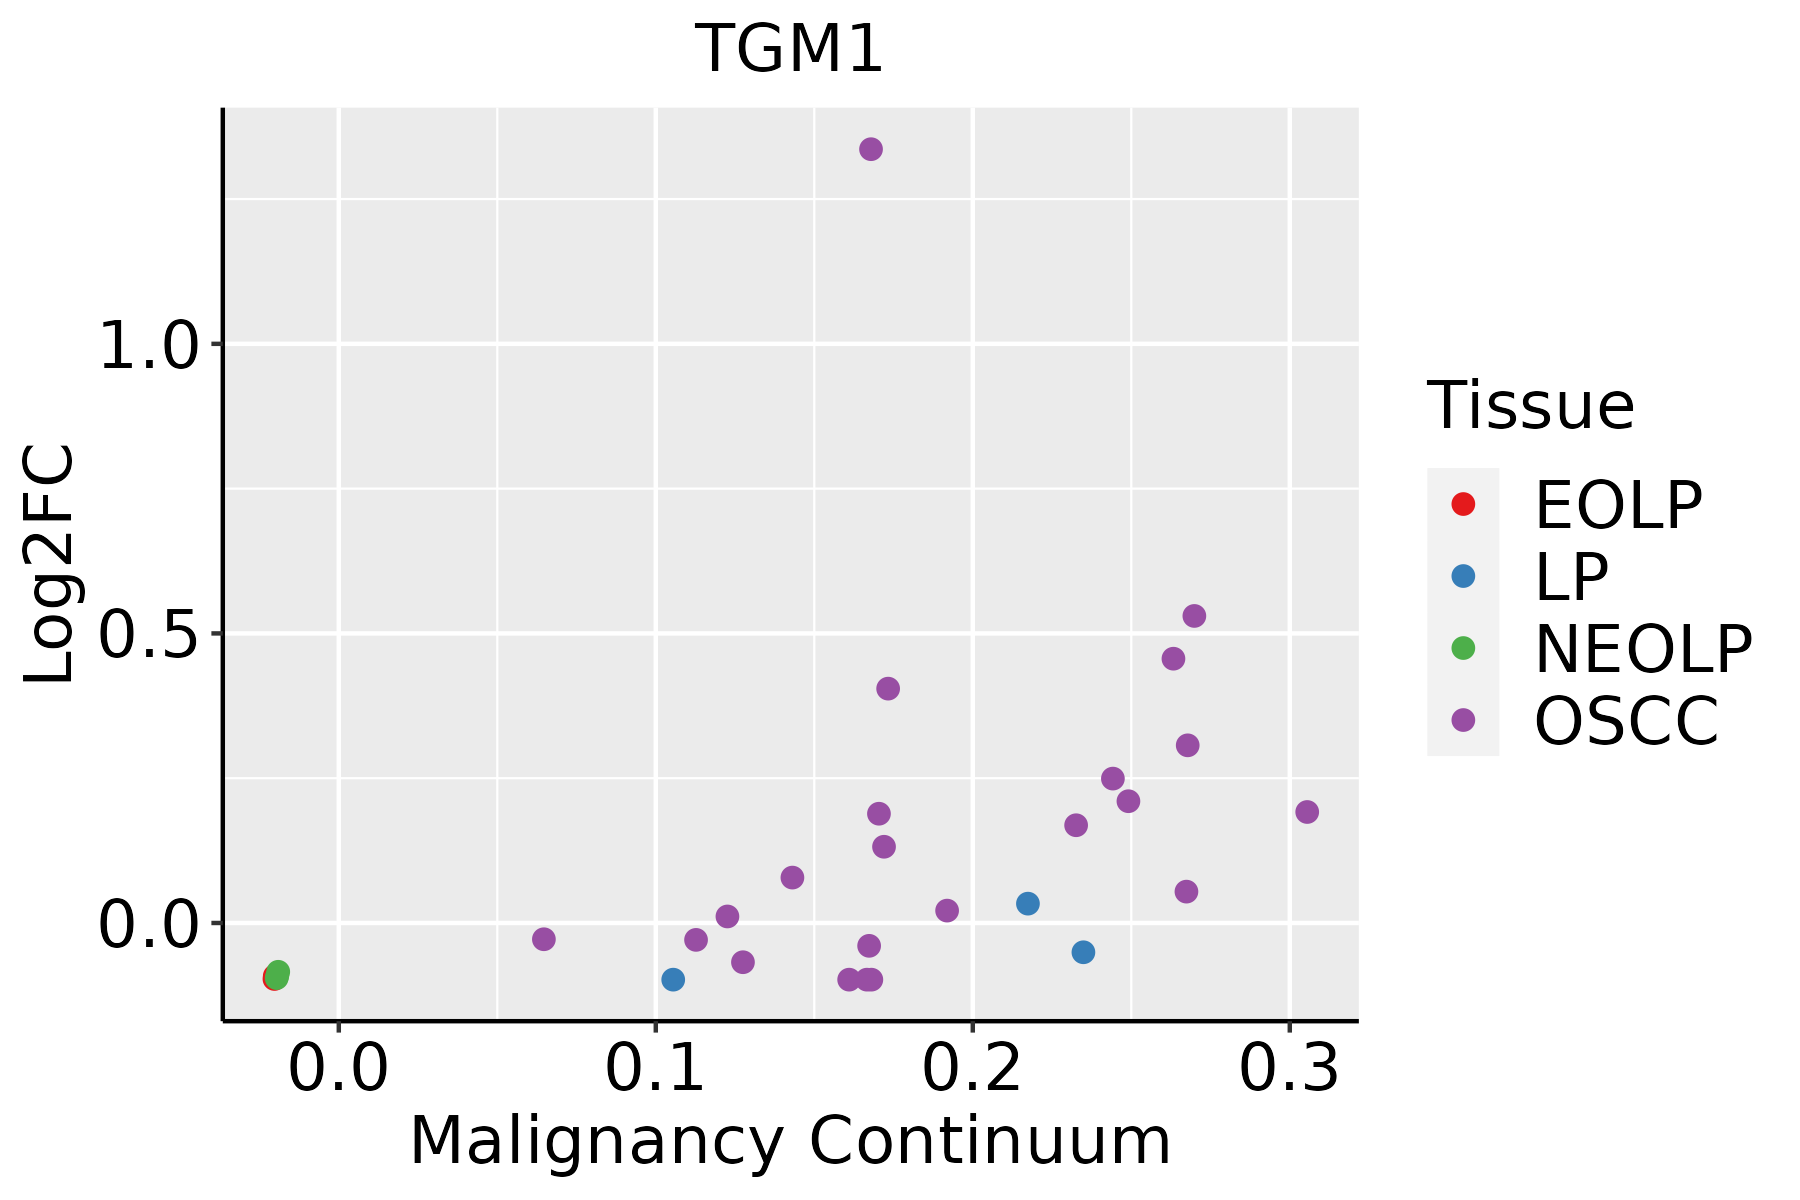 | EOLP: Erosive Oral lichen planus |
| LP: leukoplakia | ||
| NEOLP: Non-erosive oral lichen planus | ||
| OSCC: Oral squamous cell carcinoma |
| ∗log2FC in expression of this searched gene in stem-like cells from each diseased tissue sample relative to stem-like cells in normal samples in each tissue plotted against the malignancy continuum. Samples are colored based on if they are from different disease stage. |
Top |
Malignant transformation related pathway analysis |
| Find out the enriched GO biological processes and KEGG pathways involved in transition from healthy to precancer to cancer |
| Tissue | Disease Stage | Enriched GO biological Processes |
| Colorectum | AD |  |
| Colorectum | SER |  |
| Colorectum | MSS |  |
| Colorectum | MSI-H |  |
| Colorectum | FAP |  |
| ∗Top 15 enriched GO BP terms are showed in the bar plot of each disease state in each tissue. Each row represents a significant GO biological process which is colored according to the -log10(p.adjust). |
| Page: 1 2 3 4 5 6 7 8 9 |
| GO ID | Tissue | Disease Stage | Description | Gene Ratio | Bg Ratio | pvalue | p.adjust | Count |
| GO:004578710 | Esophagus | ESCC | positive regulation of cell cycle | 196/8552 | 313/18723 | 9.27e-10 | 2.24e-08 | 196 |
| GO:00435888 | Esophagus | ESCC | skin development | 163/8552 | 263/18723 | 6.48e-08 | 1.14e-06 | 163 |
| GO:000854410 | Esophagus | ESCC | epidermis development | 193/8552 | 324/18723 | 2.87e-07 | 4.19e-06 | 193 |
| GO:000991310 | Esophagus | ESCC | epidermal cell differentiation | 122/8552 | 202/18723 | 1.69e-05 | 1.51e-04 | 122 |
| GO:00452294 | Esophagus | ESCC | external encapsulating structure organization | 172/8552 | 304/18723 | 7.80e-05 | 5.80e-04 | 172 |
| GO:00302167 | Esophagus | ESCC | keratinocyte differentiation | 86/8552 | 139/18723 | 8.53e-05 | 6.19e-04 | 86 |
| GO:005067318 | Esophagus | ESCC | epithelial cell proliferation | 238/8552 | 437/18723 | 1.19e-04 | 8.20e-04 | 238 |
| GO:005067817 | Esophagus | ESCC | regulation of epithelial cell proliferation | 206/8552 | 381/18723 | 5.51e-04 | 3.02e-03 | 206 |
| GO:00436167 | Esophagus | ESCC | keratinocyte proliferation | 30/8552 | 46/18723 | 5.91e-03 | 2.18e-02 | 30 |
| GO:00457879 | Oral cavity | OSCC | positive regulation of cell cycle | 173/7305 | 313/18723 | 3.28e-09 | 7.44e-08 | 173 |
| GO:00435887 | Oral cavity | OSCC | skin development | 143/7305 | 263/18723 | 2.77e-07 | 4.27e-06 | 143 |
| GO:00085449 | Oral cavity | OSCC | epidermis development | 171/7305 | 324/18723 | 2.89e-07 | 4.43e-06 | 171 |
| GO:00302166 | Oral cavity | OSCC | keratinocyte differentiation | 81/7305 | 139/18723 | 3.16e-06 | 3.81e-05 | 81 |
| GO:00099139 | Oral cavity | OSCC | epidermal cell differentiation | 109/7305 | 202/18723 | 1.08e-05 | 1.14e-04 | 109 |
| GO:005067310 | Oral cavity | OSCC | epithelial cell proliferation | 212/7305 | 437/18723 | 2.82e-05 | 2.61e-04 | 212 |
| GO:00452293 | Oral cavity | OSCC | external encapsulating structure organization | 147/7305 | 304/18723 | 5.30e-04 | 3.08e-03 | 147 |
| GO:005067810 | Oral cavity | OSCC | regulation of epithelial cell proliferation | 180/7305 | 381/18723 | 5.88e-04 | 3.35e-03 | 180 |
| GO:00436166 | Oral cavity | OSCC | keratinocyte proliferation | 28/7305 | 46/18723 | 2.19e-03 | 9.95e-03 | 28 |
| Page: 1 |
| Pathway ID | Tissue | Disease Stage | Description | Gene Ratio | Bg Ratio | pvalue | p.adjust | qvalue | Count |
| Page: 1 |
Top |
Cell-cell communication analysis |
| Identification of potential cell-cell interactions between two cell types and their ligand-receptor pairs for different disease states |
| Ligand | Receptor | LRpair | Pathway | Tissue | Disease Stage |
| Page: 1 |
Top |
Single-cell gene regulatory network inference analysis |
| Find out the significant the regulons (TFs) and the target genes of each regulon across cell types for different disease states |
| TF | Cell Type | Tissue | Disease Stage | Target Gene | RSS | Regulon Activity |
| ∗The dot plots of a searched regulon are shown for all cell subpopulations in each disease state of each tissue based on the regulon specific score inferred using pySCENIC and by calculating the average expression. |
| Page: 1 |
Top |
Somatic mutation of malignant transformation related genes |
| Annotation of somatic variants for genes involved in malignant transformation |
| Hugo Symbol | Variant Class | Variant Classification | dbSNP RS | HGVSc | HGVSp | HGVSp Short | SWISSPROT | BIOTYPE | SIFT | PolyPhen | Tumor Sample Barcode | Tissue | Histology | Sex | Age | Stage | Therapy Types | Drugs | Outcome |
| TGM1 | SNV | Missense_Mutation | rs200829531 | c.1519N>T | p.Arg507Trp | p.R507W | P22735 | protein_coding | deleterious(0) | probably_damaging(0.965) | TCGA-MX-A5UJ-01 | Stomach | stomach adenocarcinoma | Female | >=65 | III/IV | Unknown | Unknown | SD |
| TGM1 | insertion | Frame_Shift_Ins | novel | c.566_567insG | p.Ser190GlnfsTer49 | p.S190Qfs*49 | P22735 | protein_coding | TCGA-CG-5726-01 | Stomach | stomach adenocarcinoma | Male | >=65 | I/II | Unknown | Unknown | SD | ||
| TGM1 | SNV | Missense_Mutation | novel | c.1610N>T | p.Arg537Leu | p.R537L | P22735 | protein_coding | deleterious(0.03) | benign(0.38) | TCGA-DJ-A2QB-01 | Thyroid | thyroid carcinoma | Female | <65 | I/II | Unknown | Unknown | SD |
| Page: 1 2 3 4 5 6 7 8 9 |
Top |
Related drugs of malignant transformation related genes |
| Identification of chemicals and drugs interact with genes involved in malignant transfromation |
| (DGIdb 4.0) |
| Entrez ID | Symbol | Category | Interaction Types | Drug Claim Name | Drug Name | PMIDs |
| Page: 1 |

Copyright 2023-Present -The University of Texas Health Science Center at Houston |