
|
|||||
|
 | |
| |
| |
| |
| |
| |
|
Gene: SH3RF1 |
Gene summary for SH3RF1 |
| Gene information | Species | Human | Gene symbol | SH3RF1 | Gene ID | 57630 |
| Gene name | SH3 domain containing ring finger 1 | |
| Gene Alias | POSH | |
| Cytomap | 4q32.3-q33 | |
| Gene Type | protein-coding | GO ID | GO:0000165 | UniProtAcc | Q7Z6J0 |
Top |
Malignant transformation analysis |
| Identification of the aberrant gene expression in precancerous and cancerous lesions by comparing the gene expression of stem-like cells in diseased tissues with normal stem cells |
| Entrez ID | Symbol | Replicates | Species | Organ | Tissue | Adj P-value | Log2FC | Malignancy |
| 57630 | SH3RF1 | CCI_1 | Human | Cervix | CC | 8.77e-10 | 7.13e-01 | 0.528 |
| 57630 | SH3RF1 | CCI_2 | Human | Cervix | CC | 2.14e-03 | 5.27e-01 | 0.5249 |
| 57630 | SH3RF1 | CCI_3 | Human | Cervix | CC | 2.92e-07 | 6.07e-01 | 0.516 |
| 57630 | SH3RF1 | T1 | Human | Cervix | CC | 2.07e-02 | 1.85e-01 | 0.0918 |
| 57630 | SH3RF1 | HTA11_3410_2000001011 | Human | Colorectum | AD | 1.31e-31 | -9.14e-01 | 0.0155 |
| 57630 | SH3RF1 | HTA11_2487_2000001011 | Human | Colorectum | SER | 4.92e-03 | -4.63e-01 | -0.1808 |
| 57630 | SH3RF1 | HTA11_2951_2000001011 | Human | Colorectum | AD | 6.88e-06 | -9.61e-01 | 0.0216 |
| 57630 | SH3RF1 | HTA11_347_2000001011 | Human | Colorectum | AD | 2.95e-04 | 3.70e-01 | -0.1954 |
| 57630 | SH3RF1 | HTA11_3361_2000001011 | Human | Colorectum | AD | 7.56e-11 | -6.46e-01 | -0.1207 |
| 57630 | SH3RF1 | HTA11_696_2000001011 | Human | Colorectum | AD | 1.50e-10 | -4.57e-01 | -0.1464 |
| 57630 | SH3RF1 | HTA11_5216_2000001011 | Human | Colorectum | SER | 2.37e-06 | -7.54e-01 | -0.1462 |
| 57630 | SH3RF1 | HTA11_9341_2000001011 | Human | Colorectum | SER | 8.99e-05 | -7.00e-01 | -0.00410000000000005 |
| 57630 | SH3RF1 | HTA11_866_3004761011 | Human | Colorectum | AD | 1.52e-32 | -9.19e-01 | 0.096 |
| 57630 | SH3RF1 | HTA11_9408_2000001011 | Human | Colorectum | AD | 7.93e-03 | -8.64e-01 | 0.0451 |
| 57630 | SH3RF1 | HTA11_8622_2000001021 | Human | Colorectum | SER | 3.78e-09 | -1.00e+00 | 0.0528 |
| 57630 | SH3RF1 | HTA11_7663_2000001011 | Human | Colorectum | SER | 2.07e-06 | -5.26e-01 | 0.0131 |
| 57630 | SH3RF1 | HTA11_10711_2000001011 | Human | Colorectum | AD | 2.57e-12 | -6.95e-01 | 0.0338 |
| 57630 | SH3RF1 | HTA11_7696_3000711011 | Human | Colorectum | AD | 2.65e-38 | -8.33e-01 | 0.0674 |
| 57630 | SH3RF1 | HTA11_7469_2000001011 | Human | Colorectum | AD | 4.73e-02 | -5.64e-01 | -0.0124 |
| 57630 | SH3RF1 | HTA11_11156_2000001011 | Human | Colorectum | AD | 1.52e-03 | -9.57e-01 | 0.0397 |
| Page: 1 2 3 4 5 6 7 8 9 10 |
| Tissue | Expression Dynamics | Abbreviation |
| Cervix | 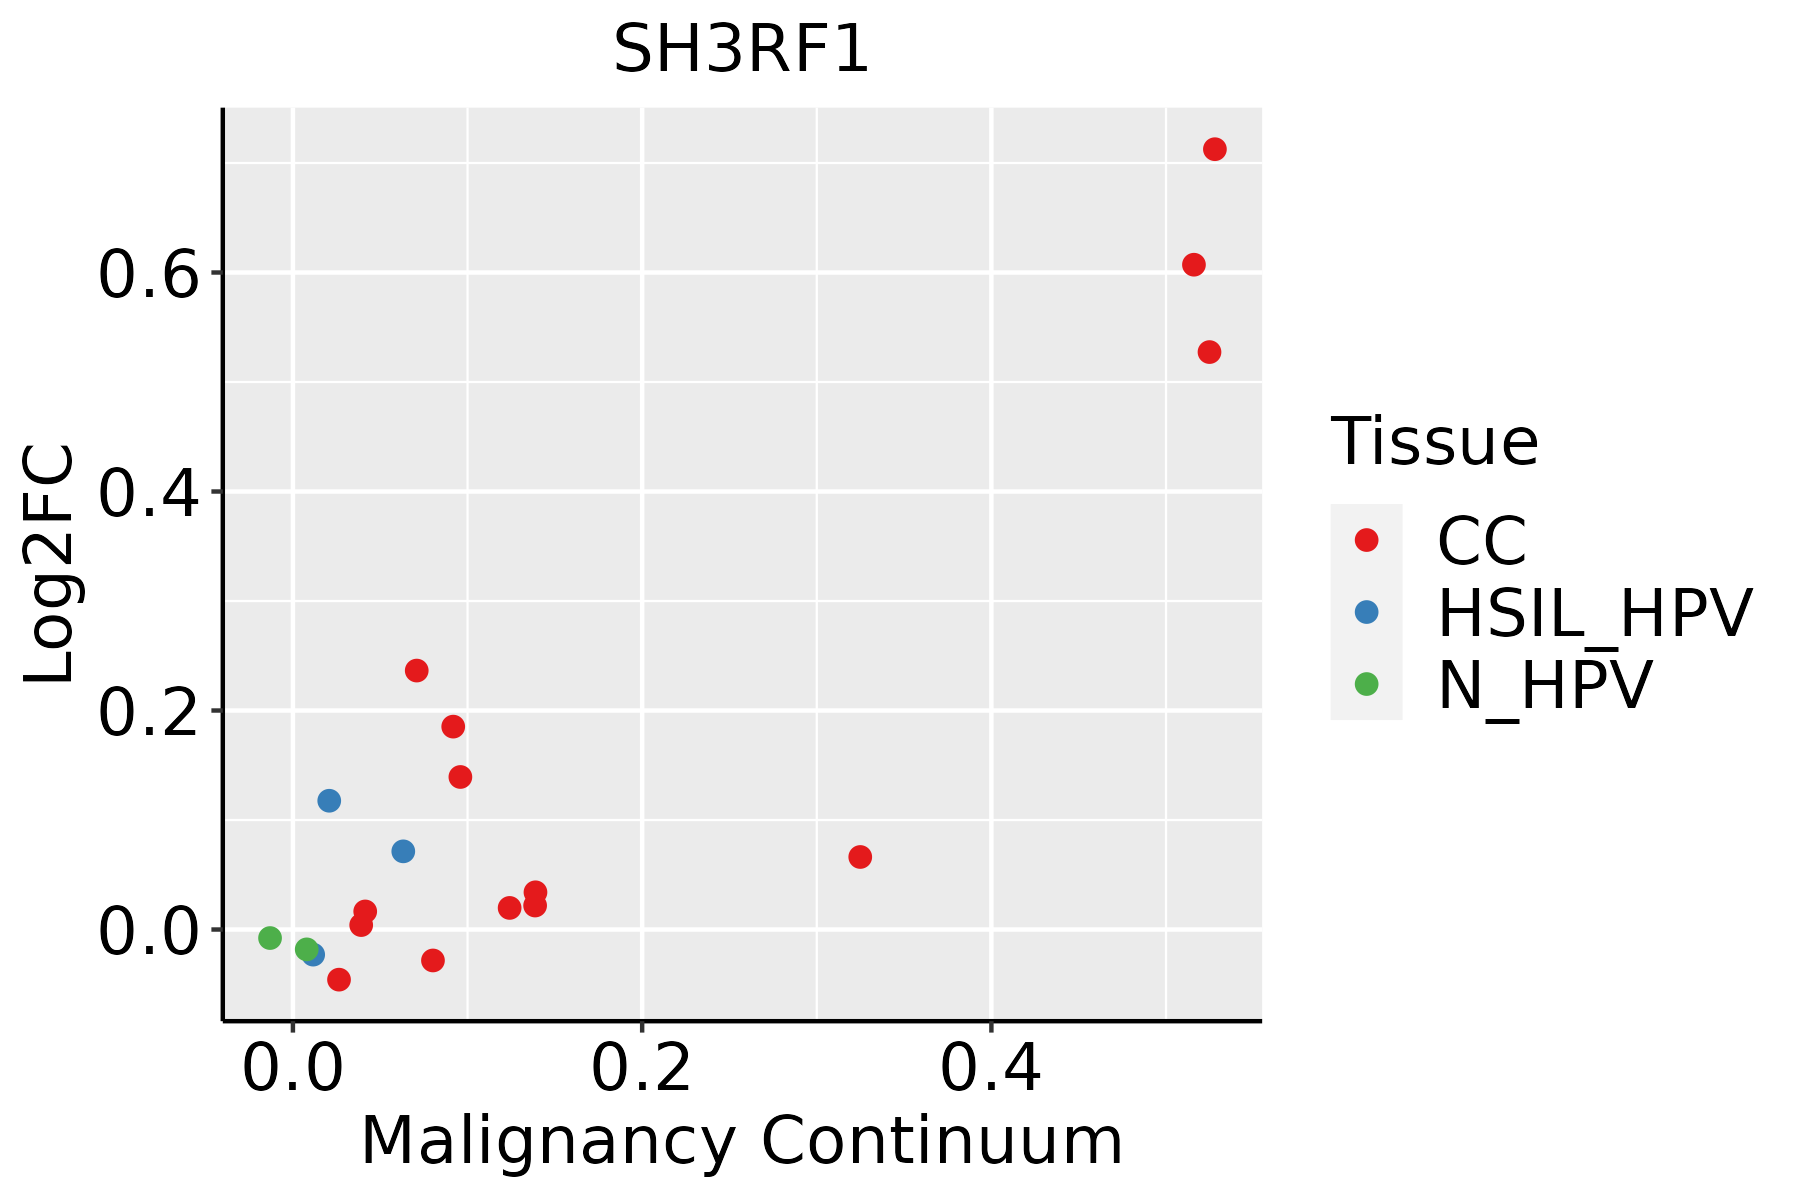 | CC: Cervix cancer |
| HSIL_HPV: HPV-infected high-grade squamous intraepithelial lesions | ||
| N_HPV: HPV-infected normal cervix | ||
| Colorectum (GSE201348) |  | FAP: Familial adenomatous polyposis |
| CRC: Colorectal cancer | ||
| Colorectum (HTA11) |  | AD: Adenomas |
| SER: Sessile serrated lesions | ||
| MSI-H: Microsatellite-high colorectal cancer | ||
| MSS: Microsatellite stable colorectal cancer | ||
| Endometrium | 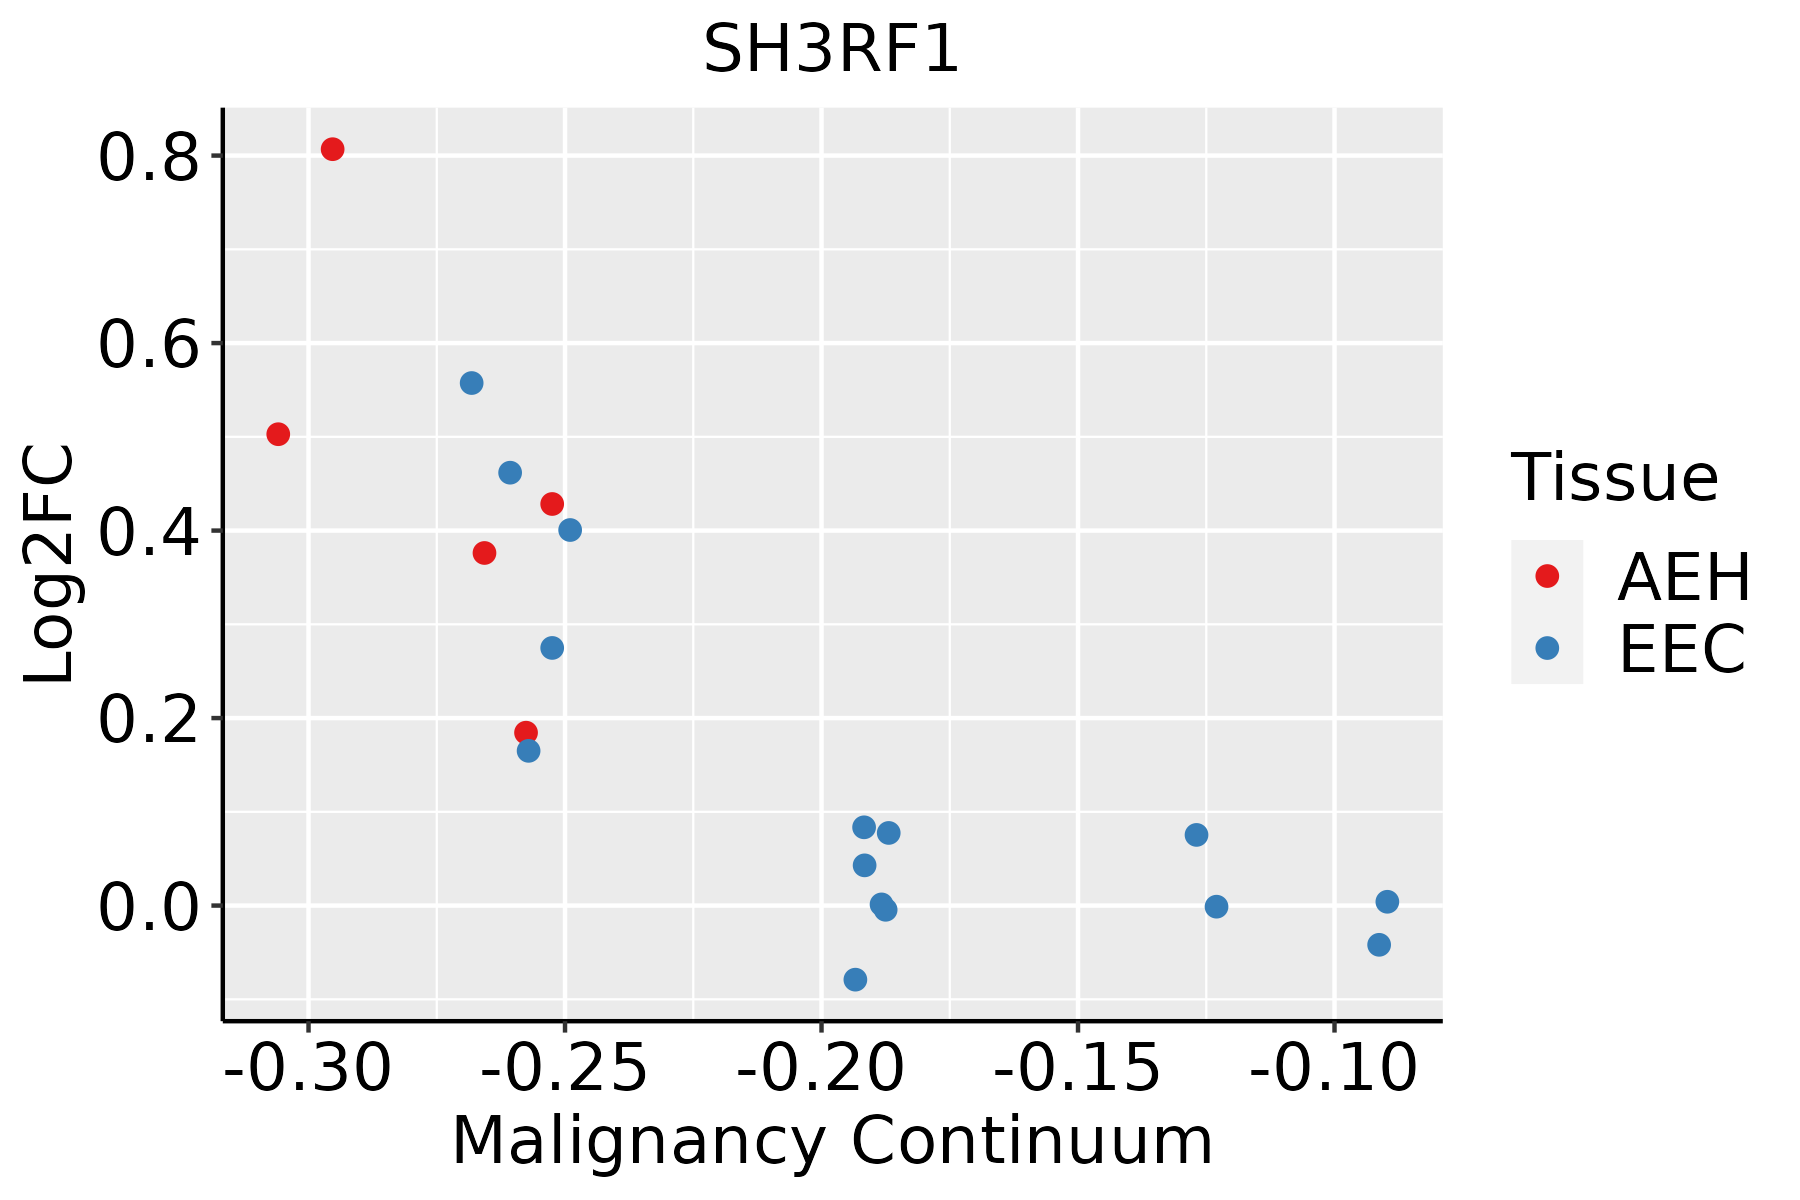 | AEH: Atypical endometrial hyperplasia |
| EEC: Endometrioid Cancer | ||
| Esophagus |  | ESCC: Esophageal squamous cell carcinoma |
| HGIN: High-grade intraepithelial neoplasias | ||
| LGIN: Low-grade intraepithelial neoplasias | ||
| Liver |  | HCC: Hepatocellular carcinoma |
| NAFLD: Non-alcoholic fatty liver disease | ||
| Lung |  | AAH: Atypical adenomatous hyperplasia |
| AIS: Adenocarcinoma in situ | ||
| IAC: Invasive lung adenocarcinoma | ||
| MIA: Minimally invasive adenocarcinoma | ||
| Prostate | 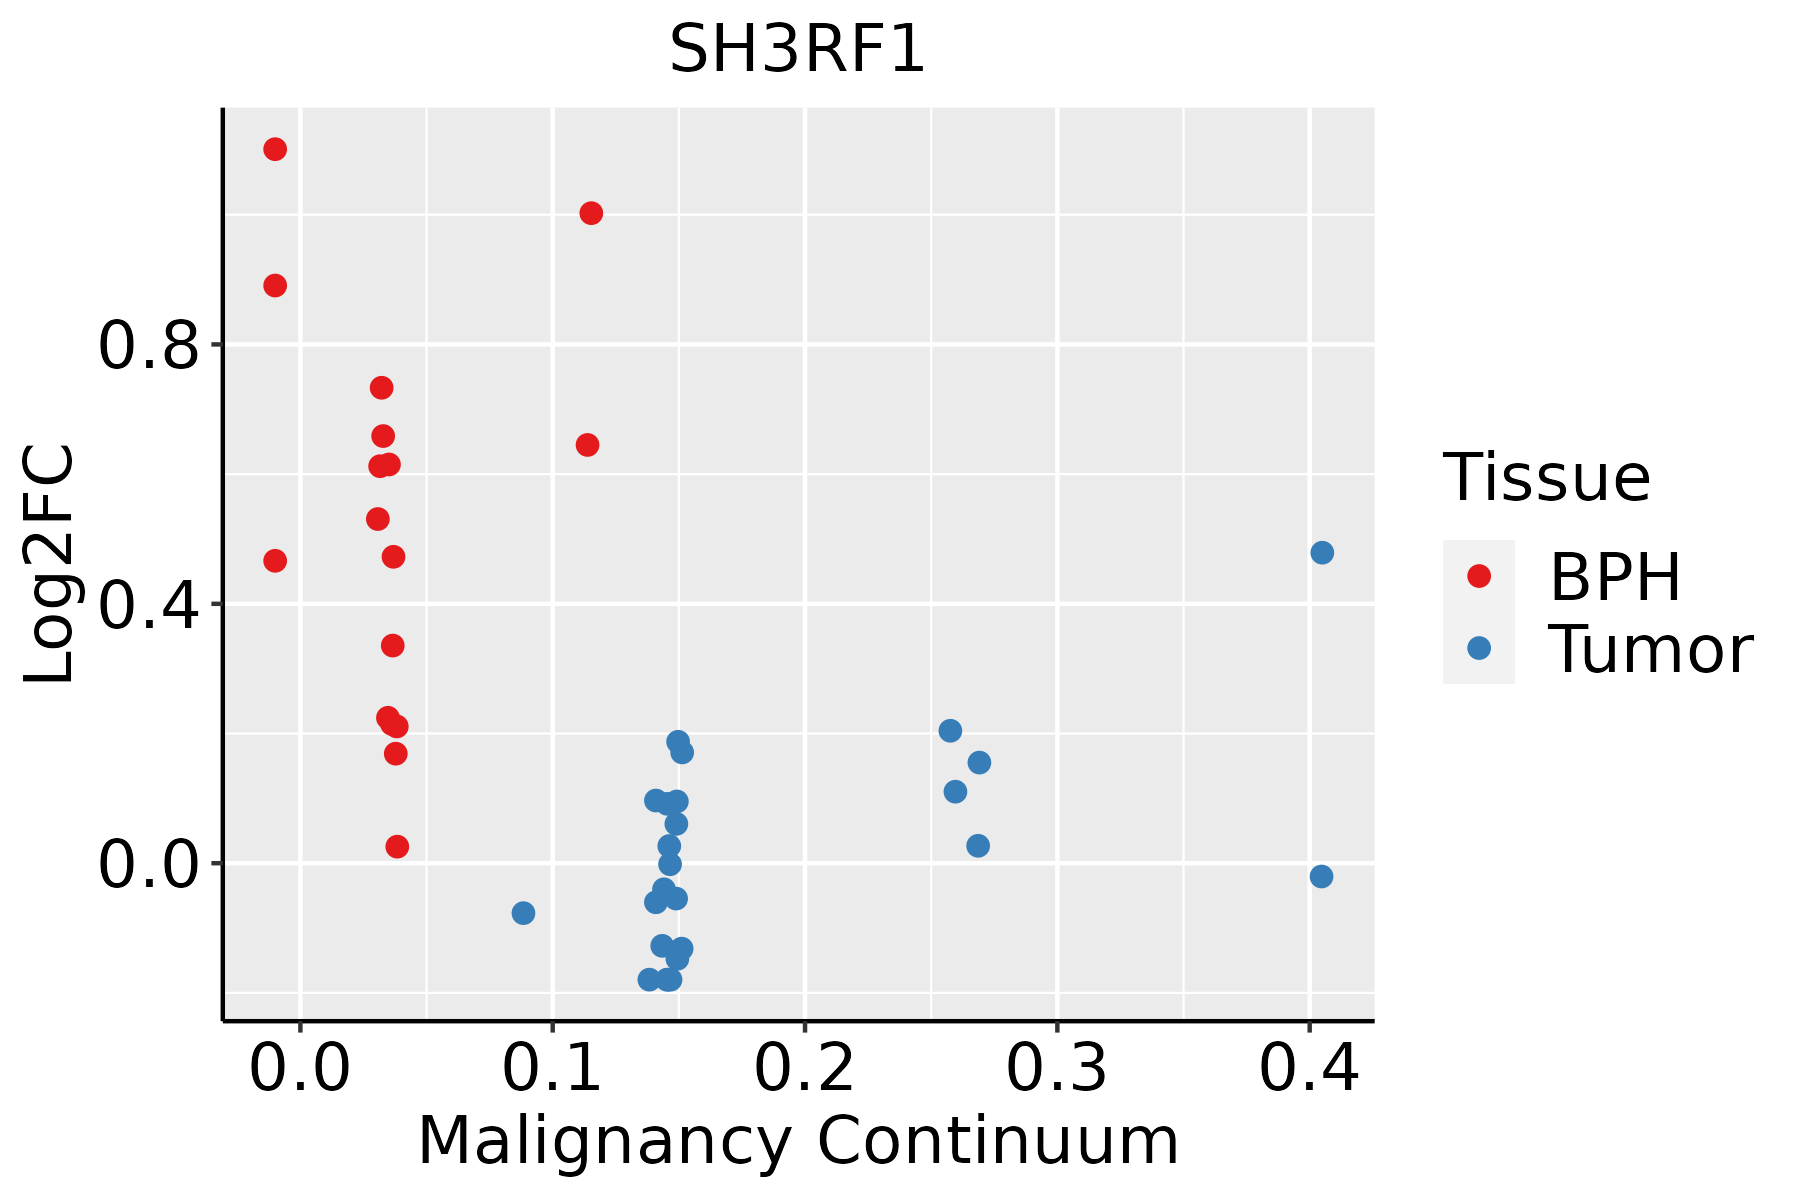 | BPH: Benign Prostatic Hyperplasia |
| Skin | 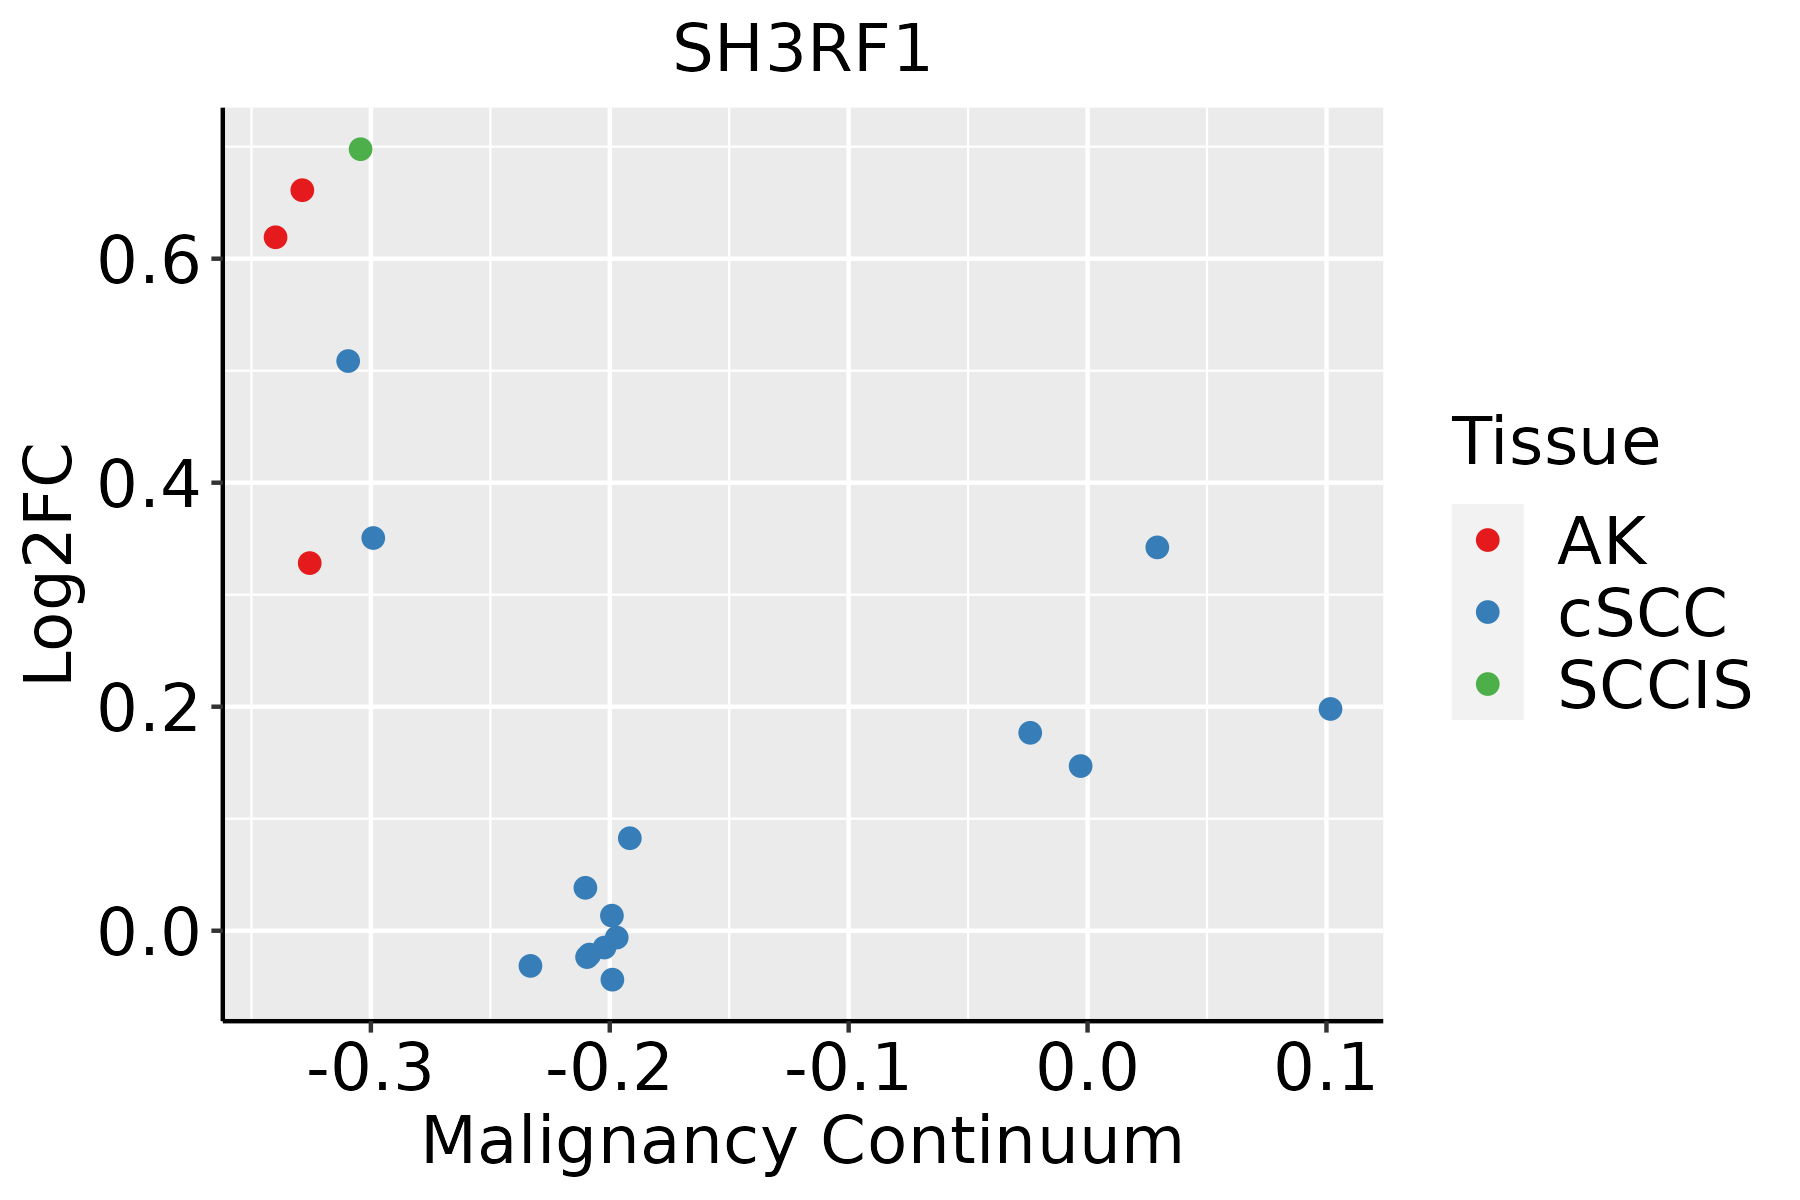 | AK: Actinic keratosis |
| cSCC: Cutaneous squamous cell carcinoma | ||
| SCCIS:squamous cell carcinoma in situ | ||
| Thyroid | 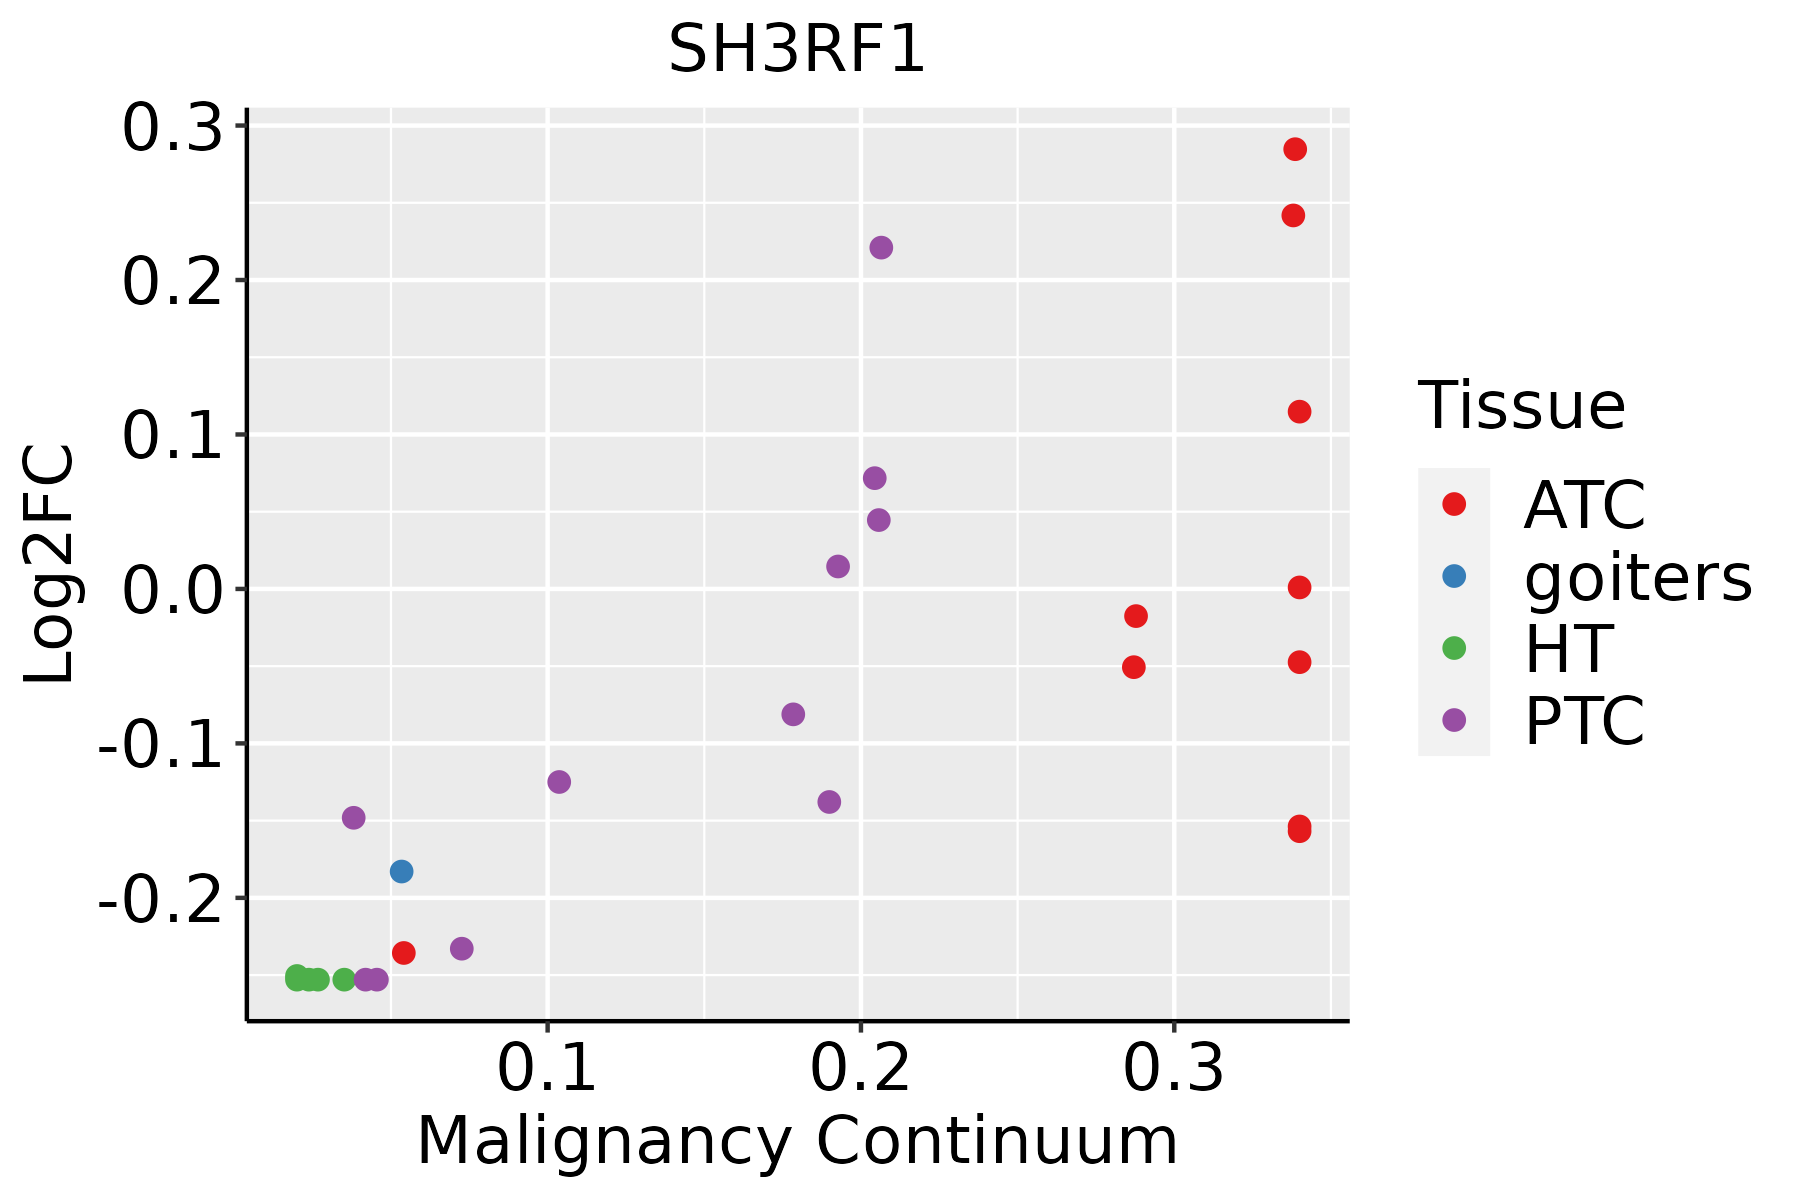 | ATC: Anaplastic thyroid cancer |
| HT: Hashimoto's thyroiditis | ||
| PTC: Papillary thyroid cancer |
| ∗log2FC in expression of this searched gene in stem-like cells from each diseased tissue sample relative to stem-like cells in normal samples in each tissue plotted against the malignancy continuum. Samples are colored based on if they are from different disease stage. |
Top |
Malignant transformation related pathway analysis |
| Find out the enriched GO biological processes and KEGG pathways involved in transition from healthy to precancer to cancer |
| Tissue | Disease Stage | Enriched GO biological Processes |
| Colorectum | AD |  |
| Colorectum | SER |  |
| Colorectum | MSS |  |
| Colorectum | MSI-H |  |
| Colorectum | FAP |  |
| ∗Top 15 enriched GO BP terms are showed in the bar plot of each disease state in each tissue. Each row represents a significant GO biological process which is colored according to the -log10(p.adjust). |
| Page: 1 2 3 4 5 6 7 8 9 |
| GO ID | Tissue | Disease Stage | Description | Gene Ratio | Bg Ratio | pvalue | p.adjust | Count |
| GO:200123310 | Cervix | CC | regulation of apoptotic signaling pathway | 96/2311 | 356/18723 | 4.08e-14 | 3.05e-11 | 96 |
| GO:005254710 | Cervix | CC | regulation of peptidase activity | 112/2311 | 461/18723 | 6.70e-13 | 3.08e-10 | 112 |
| GO:005254810 | Cervix | CC | regulation of endopeptidase activity | 103/2311 | 432/18723 | 1.89e-11 | 5.14e-09 | 103 |
| GO:00421108 | Cervix | CC | T cell activation | 107/2311 | 487/18723 | 1.24e-09 | 1.46e-07 | 107 |
| GO:00508638 | Cervix | CC | regulation of T cell activation | 80/2311 | 329/18723 | 1.28e-09 | 1.47e-07 | 80 |
| GO:200011610 | Cervix | CC | regulation of cysteine-type endopeptidase activity | 61/2311 | 235/18723 | 8.69e-09 | 7.22e-07 | 61 |
| GO:004328110 | Cervix | CC | regulation of cysteine-type endopeptidase activity involved in apoptotic process | 55/2311 | 209/18723 | 2.77e-08 | 1.95e-06 | 55 |
| GO:004586110 | Cervix | CC | negative regulation of proteolysis | 80/2311 | 351/18723 | 2.88e-08 | 1.98e-06 | 80 |
| GO:200123410 | Cervix | CC | negative regulation of apoptotic signaling pathway | 56/2311 | 224/18723 | 1.39e-07 | 6.70e-06 | 56 |
| GO:190370610 | Cervix | CC | regulation of hemopoiesis | 80/2311 | 367/18723 | 2.14e-07 | 9.55e-06 | 80 |
| GO:00513469 | Cervix | CC | negative regulation of hydrolase activity | 81/2311 | 379/18723 | 4.27e-07 | 1.67e-05 | 81 |
| GO:00310988 | Cervix | CC | stress-activated protein kinase signaling cascade | 58/2311 | 247/18723 | 8.02e-07 | 2.89e-05 | 58 |
| GO:00104669 | Cervix | CC | negative regulation of peptidase activity | 60/2311 | 262/18723 | 1.27e-06 | 4.34e-05 | 60 |
| GO:00420988 | Cervix | CC | T cell proliferation | 49/2311 | 199/18723 | 1.32e-06 | 4.49e-05 | 49 |
| GO:009719110 | Cervix | CC | extrinsic apoptotic signaling pathway | 52/2311 | 219/18723 | 2.06e-06 | 6.34e-05 | 52 |
| GO:00514038 | Cervix | CC | stress-activated MAPK cascade | 55/2311 | 239/18723 | 2.96e-06 | 8.31e-05 | 55 |
| GO:00421297 | Cervix | CC | regulation of T cell proliferation | 43/2311 | 171/18723 | 3.21e-06 | 8.77e-05 | 43 |
| GO:19021056 | Cervix | CC | regulation of leukocyte differentiation | 61/2311 | 279/18723 | 5.16e-06 | 1.29e-04 | 61 |
| GO:00706637 | Cervix | CC | regulation of leukocyte proliferation | 55/2311 | 245/18723 | 6.51e-06 | 1.56e-04 | 55 |
| GO:001095110 | Cervix | CC | negative regulation of endopeptidase activity | 56/2311 | 252/18723 | 7.43e-06 | 1.74e-04 | 56 |
| Page: 1 2 3 4 5 6 7 8 9 10 11 12 13 14 15 16 17 18 19 20 21 22 23 24 25 26 27 28 29 30 31 |
| Pathway ID | Tissue | Disease Stage | Description | Gene Ratio | Bg Ratio | pvalue | p.adjust | qvalue | Count |
| Page: 1 |
Top |
Cell-cell communication analysis |
| Identification of potential cell-cell interactions between two cell types and their ligand-receptor pairs for different disease states |
| Ligand | Receptor | LRpair | Pathway | Tissue | Disease Stage |
| Page: 1 |
Top |
Single-cell gene regulatory network inference analysis |
| Find out the significant the regulons (TFs) and the target genes of each regulon across cell types for different disease states |
| TF | Cell Type | Tissue | Disease Stage | Target Gene | RSS | Regulon Activity |
| ∗The dot plots of a searched regulon are shown for all cell subpopulations in each disease state of each tissue based on the regulon specific score inferred using pySCENIC and by calculating the average expression. |
| Page: 1 |
Top |
Somatic mutation of malignant transformation related genes |
| Annotation of somatic variants for genes involved in malignant transformation |
| Hugo Symbol | Variant Class | Variant Classification | dbSNP RS | HGVSc | HGVSp | HGVSp Short | SWISSPROT | BIOTYPE | SIFT | PolyPhen | Tumor Sample Barcode | Tissue | Histology | Sex | Age | Stage | Therapy Types | Drugs | Outcome |
| SH3RF1 | insertion | Nonsense_Mutation | novel | c.1193_1194insAGACTGATTT | p.Leu399AspfsTer2 | p.L399Dfs*2 | Q7Z6J0 | protein_coding | TCGA-FY-A40L-01 | Thyroid | thyroid carcinoma | Female | <65 | I/II | Hormone Therapy | levothyroxine | SD | ||
| SH3RF1 | insertion | Frame_Shift_Ins | novel | c.1304_1305insATGCA | p.Asp436CysfsTer31 | p.D436Cfs*31 | Q7Z6J0 | protein_coding | TCGA-FY-A4B0-01 | Thyroid | thyroid carcinoma | Male | >=65 | I/II | Hormone Therapy | synthroid | SD | ||
| SH3RF1 | insertion | Frame_Shift_Ins | novel | c.255_256insTATATCCAATCTCATTCCAA | p.Gly86TyrfsTer19 | p.G86Yfs*19 | Q7Z6J0 | protein_coding | TCGA-FY-A4B0-01 | Thyroid | thyroid carcinoma | Male | >=65 | I/II | Hormone Therapy | synthroid | SD |
| Page: 1 2 3 4 5 6 7 8 9 |
Top |
Related drugs of malignant transformation related genes |
| Identification of chemicals and drugs interact with genes involved in malignant transfromation |
| (DGIdb 4.0) |
| Entrez ID | Symbol | Category | Interaction Types | Drug Claim Name | Drug Name | PMIDs |
| Page: 1 |

Copyright 2023-Present -The University of Texas Health Science Center at Houston |