
|
|||||
|
 | |
| |
| |
| |
| |
| |
|
Gene: SEC14L5 |
Gene summary for SEC14L5 |
| Gene information | Species | Human | Gene symbol | SEC14L5 | Gene ID | 9717 |
| Gene name | SEC14 like lipid binding 5 | |
| Gene Alias | PRELID4B | |
| Cytomap | 16p13.3 | |
| Gene Type | protein-coding | GO ID | GO:0003674 | UniProtAcc | O43304 |
Top |
Malignant transformation analysis |
| Identification of the aberrant gene expression in precancerous and cancerous lesions by comparing the gene expression of stem-like cells in diseased tissues with normal stem cells |
| Entrez ID | Symbol | Replicates | Species | Organ | Tissue | Adj P-value | Log2FC | Malignancy |
| 9717 | SEC14L5 | HCC2 | Human | Liver | HCC | 2.08e-08 | 6.18e-01 | 0.5341 |
| 9717 | SEC14L5 | HCC5 | Human | Liver | HCC | 3.27e-06 | 5.17e-01 | 0.4932 |
| 9717 | SEC14L5 | S016 | Human | Liver | HCC | 8.53e-05 | 1.57e-01 | 0.2243 |
| Page: 1 |
| Tissue | Expression Dynamics | Abbreviation |
| Liver | 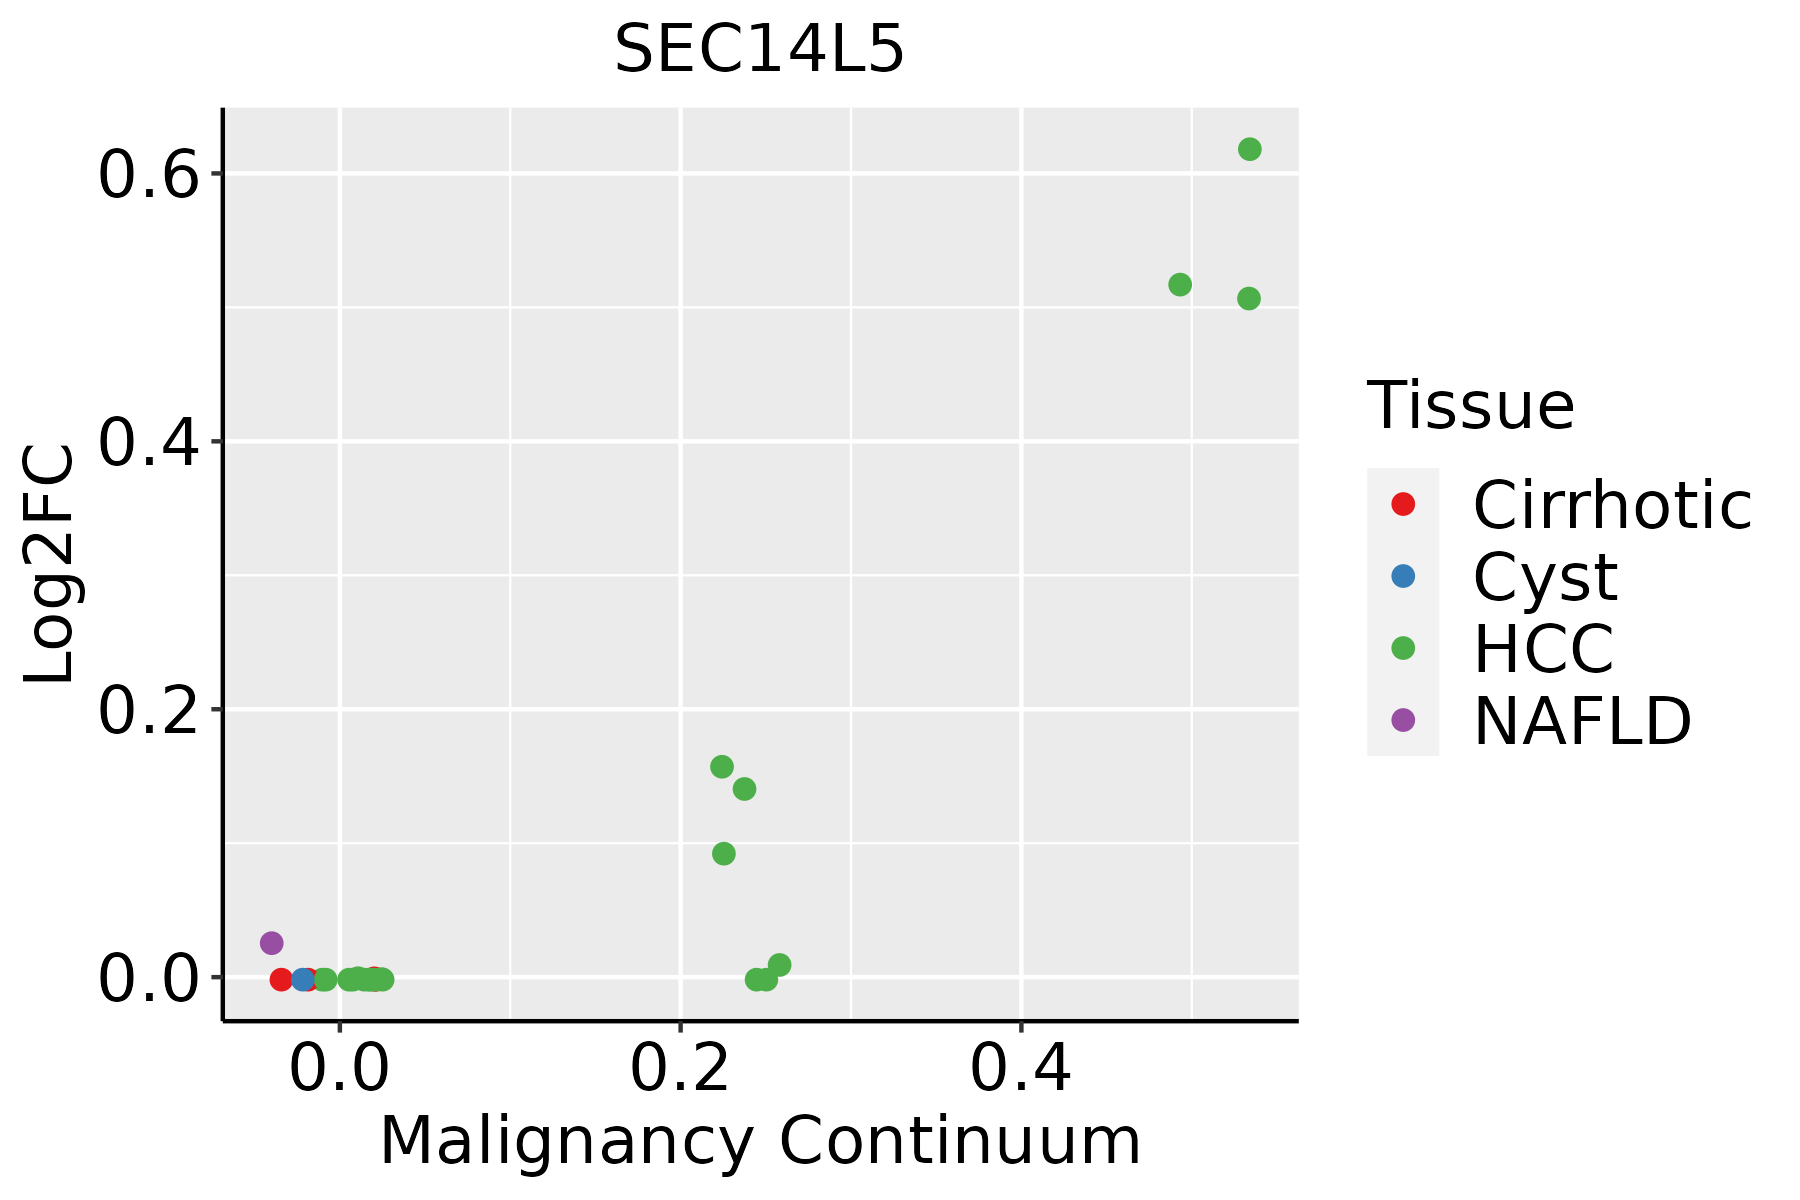 | HCC: Hepatocellular carcinoma |
| NAFLD: Non-alcoholic fatty liver disease |
| ∗log2FC in expression of this searched gene in stem-like cells from each diseased tissue sample relative to stem-like cells in normal samples in each tissue plotted against the malignancy continuum. Samples are colored based on if they are from different disease stage. |
Top |
Malignant transformation related pathway analysis |
| Find out the enriched GO biological processes and KEGG pathways involved in transition from healthy to precancer to cancer |
| Tissue | Disease Stage | Enriched GO biological Processes |
| Colorectum | AD |  |
| Colorectum | SER |  |
| Colorectum | MSS |  |
| Colorectum | MSI-H |  |
| Colorectum | FAP |  |
| ∗Top 15 enriched GO BP terms are showed in the bar plot of each disease state in each tissue. Each row represents a significant GO biological process which is colored according to the -log10(p.adjust). |
| Page: 1 2 3 4 5 6 7 8 9 |
| GO ID | Tissue | Disease Stage | Description | Gene Ratio | Bg Ratio | pvalue | p.adjust | Count |
| Page: 1 |
| Pathway ID | Tissue | Disease Stage | Description | Gene Ratio | Bg Ratio | pvalue | p.adjust | qvalue | Count |
| Page: 1 |
Top |
Cell-cell communication analysis |
| Identification of potential cell-cell interactions between two cell types and their ligand-receptor pairs for different disease states |
| Ligand | Receptor | LRpair | Pathway | Tissue | Disease Stage |
| Page: 1 |
Top |
Single-cell gene regulatory network inference analysis |
| Find out the significant the regulons (TFs) and the target genes of each regulon across cell types for different disease states |
| TF | Cell Type | Tissue | Disease Stage | Target Gene | RSS | Regulon Activity |
| ∗The dot plots of a searched regulon are shown for all cell subpopulations in each disease state of each tissue based on the regulon specific score inferred using pySCENIC and by calculating the average expression. |
| Page: 1 |
Top |
Somatic mutation of malignant transformation related genes |
| Annotation of somatic variants for genes involved in malignant transformation |
| Hugo Symbol | Variant Class | Variant Classification | dbSNP RS | HGVSc | HGVSp | HGVSp Short | SWISSPROT | BIOTYPE | SIFT | PolyPhen | Tumor Sample Barcode | Tissue | Histology | Sex | Age | Stage | Therapy Types | Drugs | Outcome |
| SEC14L5 | SNV | Missense_Mutation | rs189059128 | c.1288N>A | p.Val430Met | p.V430M | O43304 | protein_coding | deleterious(0) | probably_damaging(0.997) | TCGA-IN-AB1X-01 | Stomach | stomach adenocarcinoma | Female | >=65 | I/II | Chemotherapy | leucovorin | SD |
| SEC14L5 | SNV | Missense_Mutation | novel | c.806N>A | p.Arg269Gln | p.R269Q | O43304 | protein_coding | deleterious(0.02) | probably_damaging(0.982) | TCGA-VQ-A8P2-01 | Stomach | stomach adenocarcinoma | Male | >=65 | III/IV | Unspecific | Complete Response | |
| SEC14L5 | SNV | Missense_Mutation | novel | c.1745G>T | p.Arg582Met | p.R582M | O43304 | protein_coding | tolerated(0.11) | benign(0.163) | TCGA-EM-A2CJ-01 | Thyroid | thyroid carcinoma | Female | <65 | I/II | Unknown | Unknown | SD |
| Page: 1 2 3 4 5 6 7 8 9 |
Top |
Related drugs of malignant transformation related genes |
| Identification of chemicals and drugs interact with genes involved in malignant transfromation |
| (DGIdb 4.0) |
| Entrez ID | Symbol | Category | Interaction Types | Drug Claim Name | Drug Name | PMIDs |
| Page: 1 |

Copyright 2023-Present -The University of Texas Health Science Center at Houston |