
|
|||||
|
 | |
| |
| |
| |
| |
| |
|
Gene: RABGAP1 |
Gene summary for RABGAP1 |
| Gene information | Species | Human | Gene symbol | RABGAP1 | Gene ID | 23637 |
| Gene name | RAB GTPase activating protein 1 | |
| Gene Alias | GAPCENA | |
| Cytomap | 9q33.2-q33.3 | |
| Gene Type | protein-coding | GO ID | GO:0006810 | UniProtAcc | Q9Y3P9 |
Top |
Malignant transformation analysis |
| Identification of the aberrant gene expression in precancerous and cancerous lesions by comparing the gene expression of stem-like cells in diseased tissues with normal stem cells |
| Entrez ID | Symbol | Replicates | Species | Organ | Tissue | Adj P-value | Log2FC | Malignancy |
| 23637 | RABGAP1 | CCI_1 | Human | Cervix | CC | 9.64e-07 | 8.93e-01 | 0.528 |
| 23637 | RABGAP1 | CCI_2 | Human | Cervix | CC | 5.45e-20 | 1.93e+00 | 0.5249 |
| 23637 | RABGAP1 | CCI_3 | Human | Cervix | CC | 2.96e-22 | 1.31e+00 | 0.516 |
| 23637 | RABGAP1 | HTA11_3410_2000001011 | Human | Colorectum | AD | 5.73e-12 | -5.79e-01 | 0.0155 |
| 23637 | RABGAP1 | HTA11_2951_2000001011 | Human | Colorectum | AD | 1.60e-04 | -7.79e-01 | 0.0216 |
| 23637 | RABGAP1 | HTA11_347_2000001011 | Human | Colorectum | AD | 1.76e-12 | 6.32e-01 | -0.1954 |
| 23637 | RABGAP1 | HTA11_411_2000001011 | Human | Colorectum | SER | 2.21e-05 | 7.77e-01 | -0.2602 |
| 23637 | RABGAP1 | HTA11_7696_3000711011 | Human | Colorectum | AD | 2.07e-03 | -3.64e-01 | 0.0674 |
| 23637 | RABGAP1 | HTA11_99999965062_69753 | Human | Colorectum | MSI-H | 1.36e-14 | 1.09e+00 | 0.3487 |
| 23637 | RABGAP1 | HTA11_99999965104_69814 | Human | Colorectum | MSS | 1.33e-10 | 7.45e-01 | 0.281 |
| 23637 | RABGAP1 | HTA11_99999974143_84620 | Human | Colorectum | MSS | 5.18e-07 | -4.22e-01 | 0.3005 |
| 23637 | RABGAP1 | F007 | Human | Colorectum | FAP | 6.42e-04 | -3.98e-01 | 0.1176 |
| 23637 | RABGAP1 | A001-C-207 | Human | Colorectum | FAP | 1.90e-04 | -3.54e-01 | 0.1278 |
| 23637 | RABGAP1 | A015-C-203 | Human | Colorectum | FAP | 3.39e-35 | -5.69e-01 | -0.1294 |
| 23637 | RABGAP1 | A015-C-204 | Human | Colorectum | FAP | 1.41e-10 | -5.35e-01 | -0.0228 |
| 23637 | RABGAP1 | A014-C-040 | Human | Colorectum | FAP | 1.64e-07 | -6.45e-01 | -0.1184 |
| 23637 | RABGAP1 | A002-C-201 | Human | Colorectum | FAP | 5.07e-25 | -6.29e-01 | 0.0324 |
| 23637 | RABGAP1 | A002-C-203 | Human | Colorectum | FAP | 1.00e-05 | -2.71e-01 | 0.2786 |
| 23637 | RABGAP1 | A001-C-119 | Human | Colorectum | FAP | 8.85e-08 | -3.57e-01 | -0.1557 |
| 23637 | RABGAP1 | A001-C-108 | Human | Colorectum | FAP | 5.75e-17 | -3.39e-01 | -0.0272 |
| Page: 1 2 3 4 5 6 7 8 9 |
| Tissue | Expression Dynamics | Abbreviation |
| Cervix | 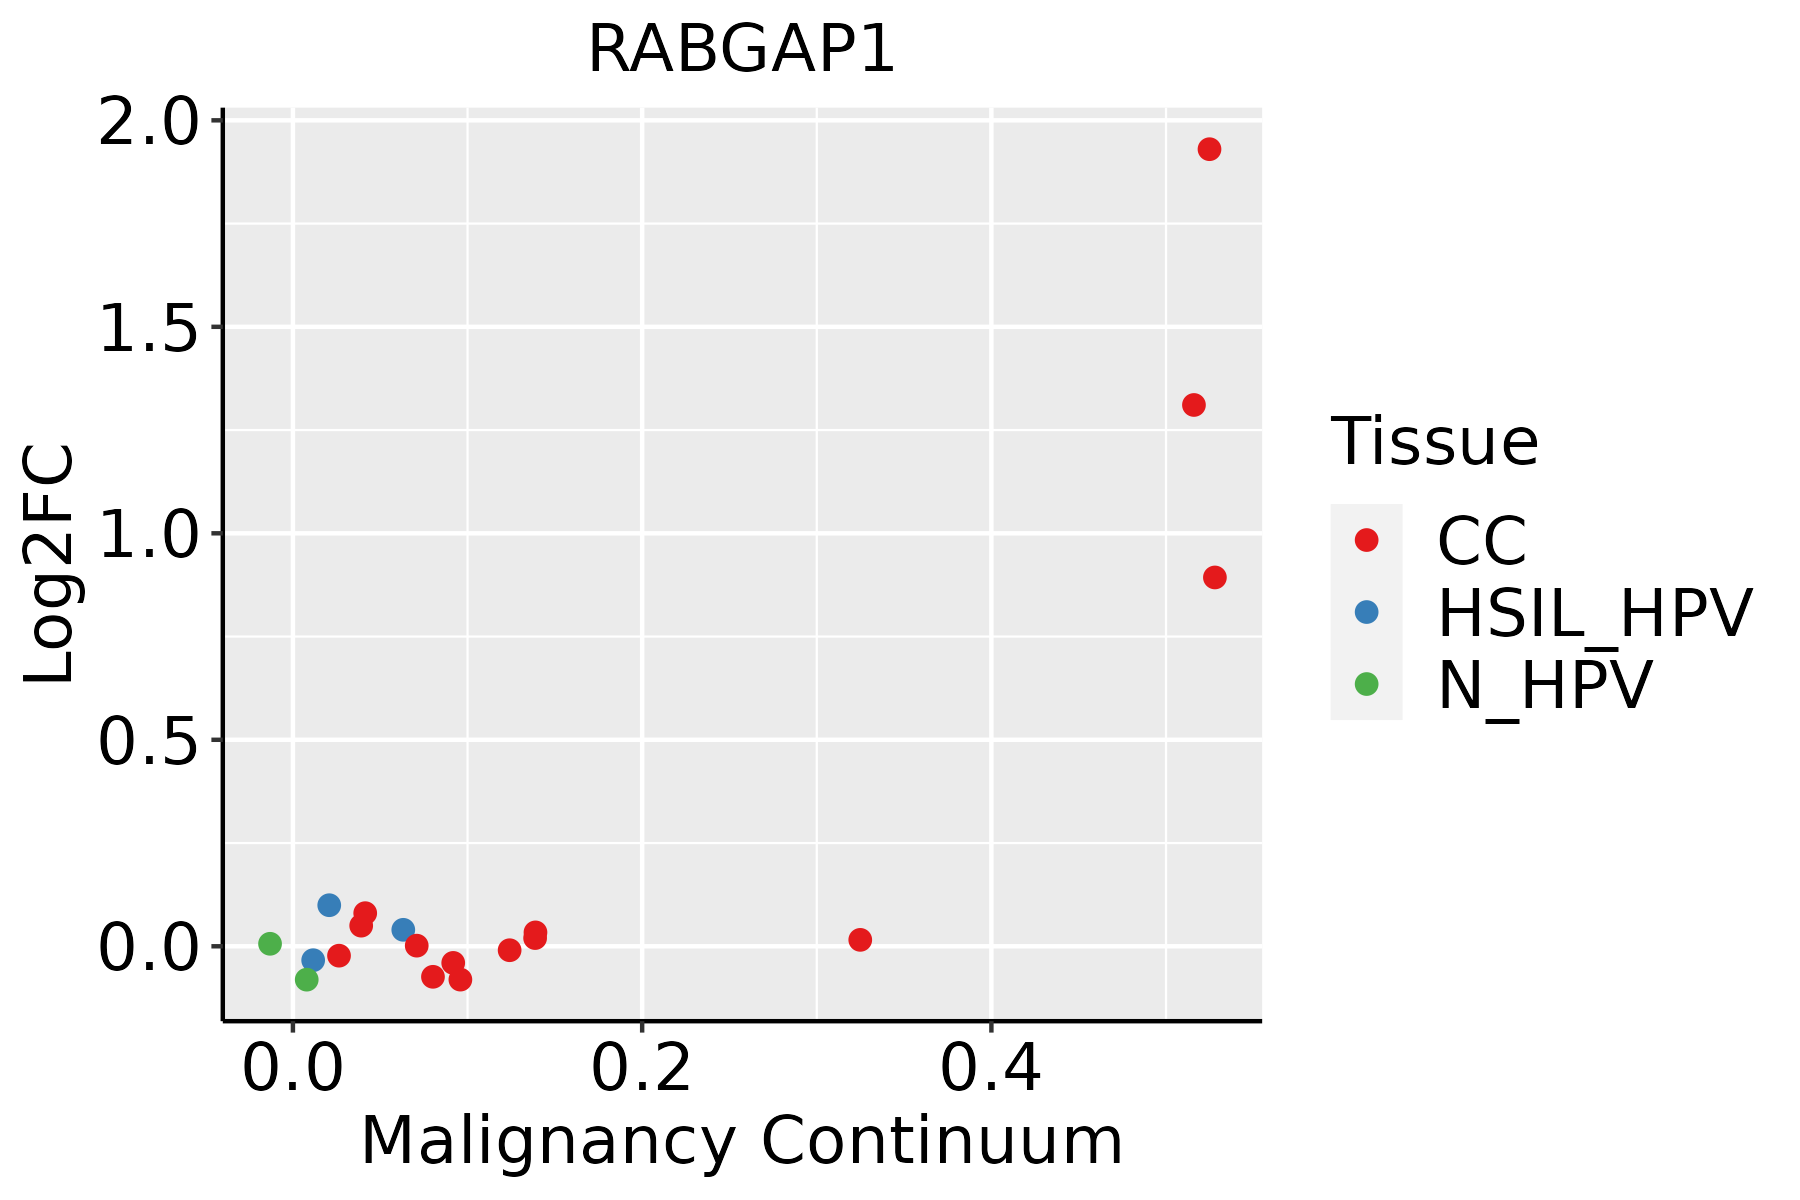 | CC: Cervix cancer |
| HSIL_HPV: HPV-infected high-grade squamous intraepithelial lesions | ||
| N_HPV: HPV-infected normal cervix | ||
| Colorectum (GSE201348) |  | FAP: Familial adenomatous polyposis |
| CRC: Colorectal cancer | ||
| Colorectum (HTA11) |  | AD: Adenomas |
| SER: Sessile serrated lesions | ||
| MSI-H: Microsatellite-high colorectal cancer | ||
| MSS: Microsatellite stable colorectal cancer | ||
| Esophagus | 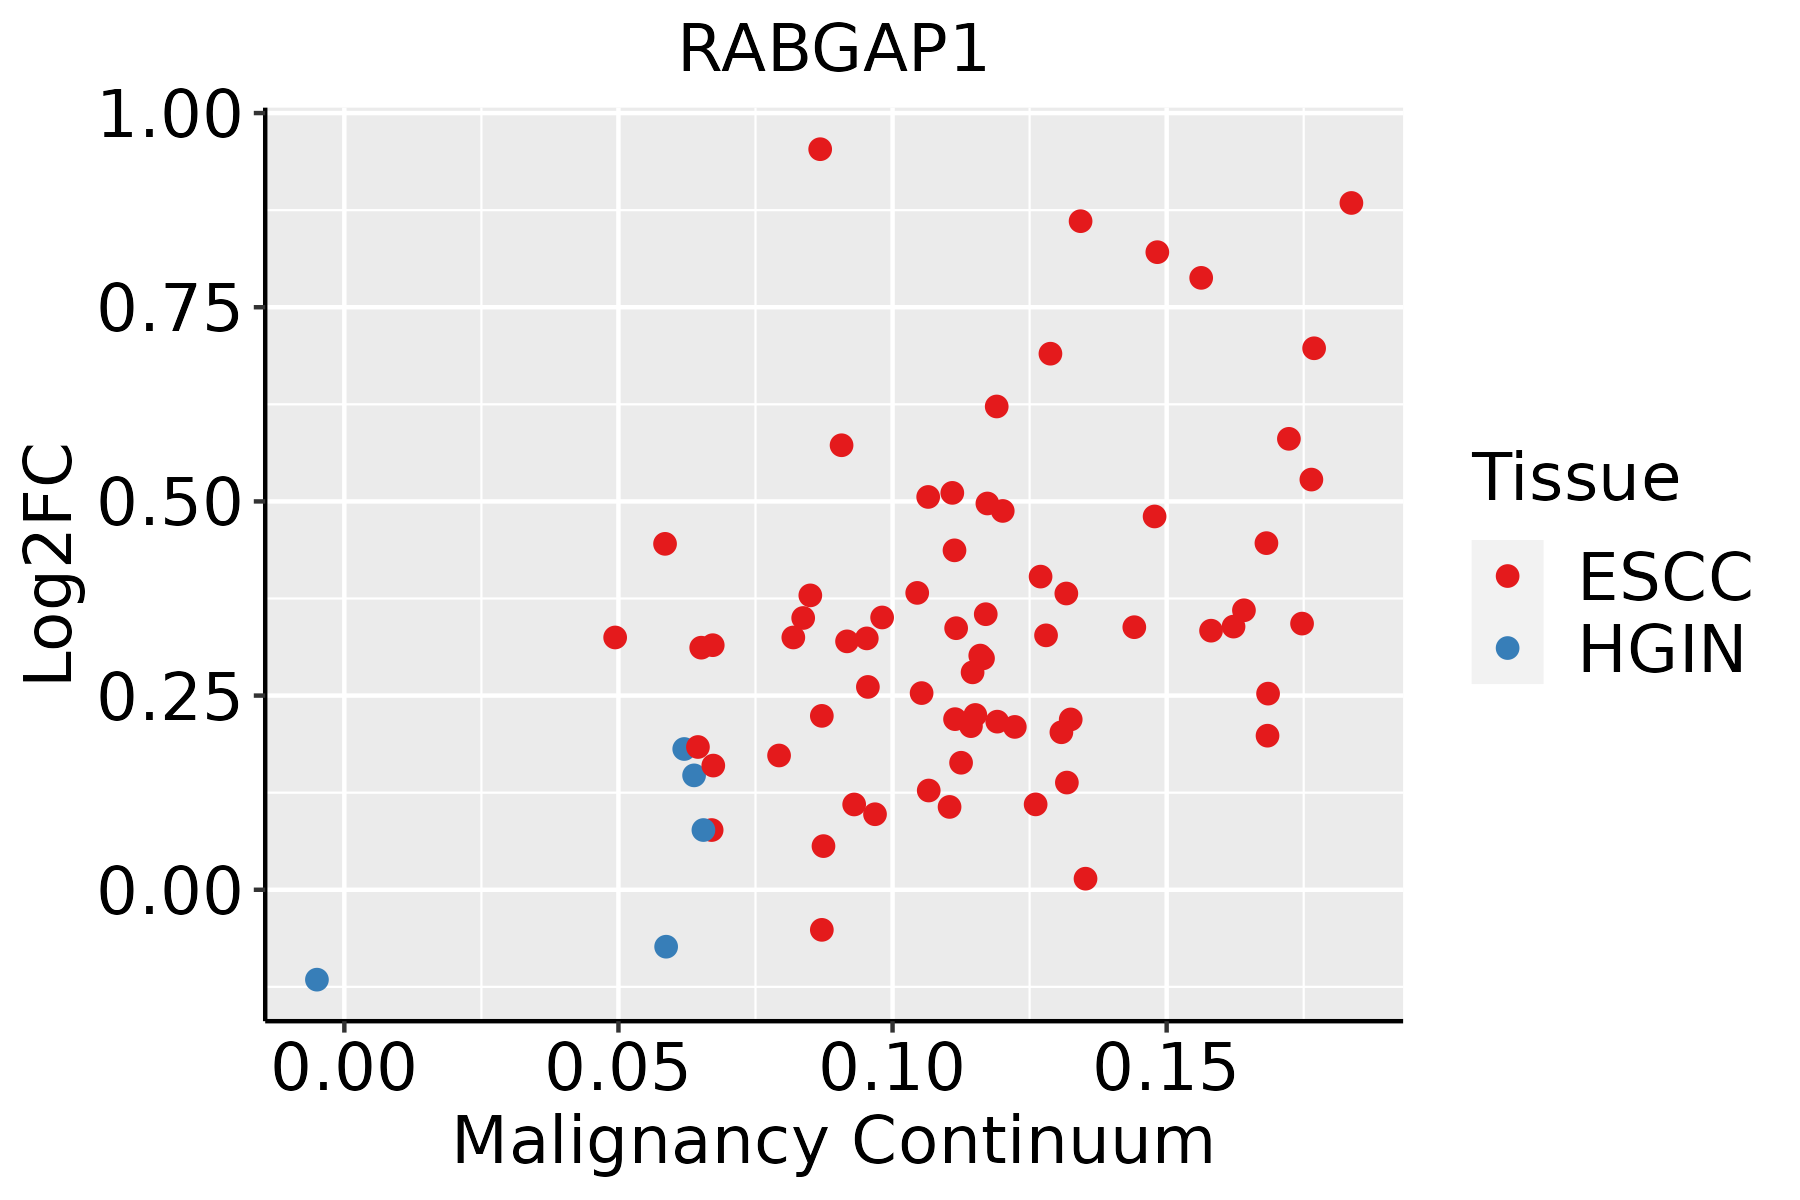 | ESCC: Esophageal squamous cell carcinoma |
| HGIN: High-grade intraepithelial neoplasias | ||
| LGIN: Low-grade intraepithelial neoplasias | ||
| Lung |  | AAH: Atypical adenomatous hyperplasia |
| AIS: Adenocarcinoma in situ | ||
| IAC: Invasive lung adenocarcinoma | ||
| MIA: Minimally invasive adenocarcinoma | ||
| Oral Cavity | 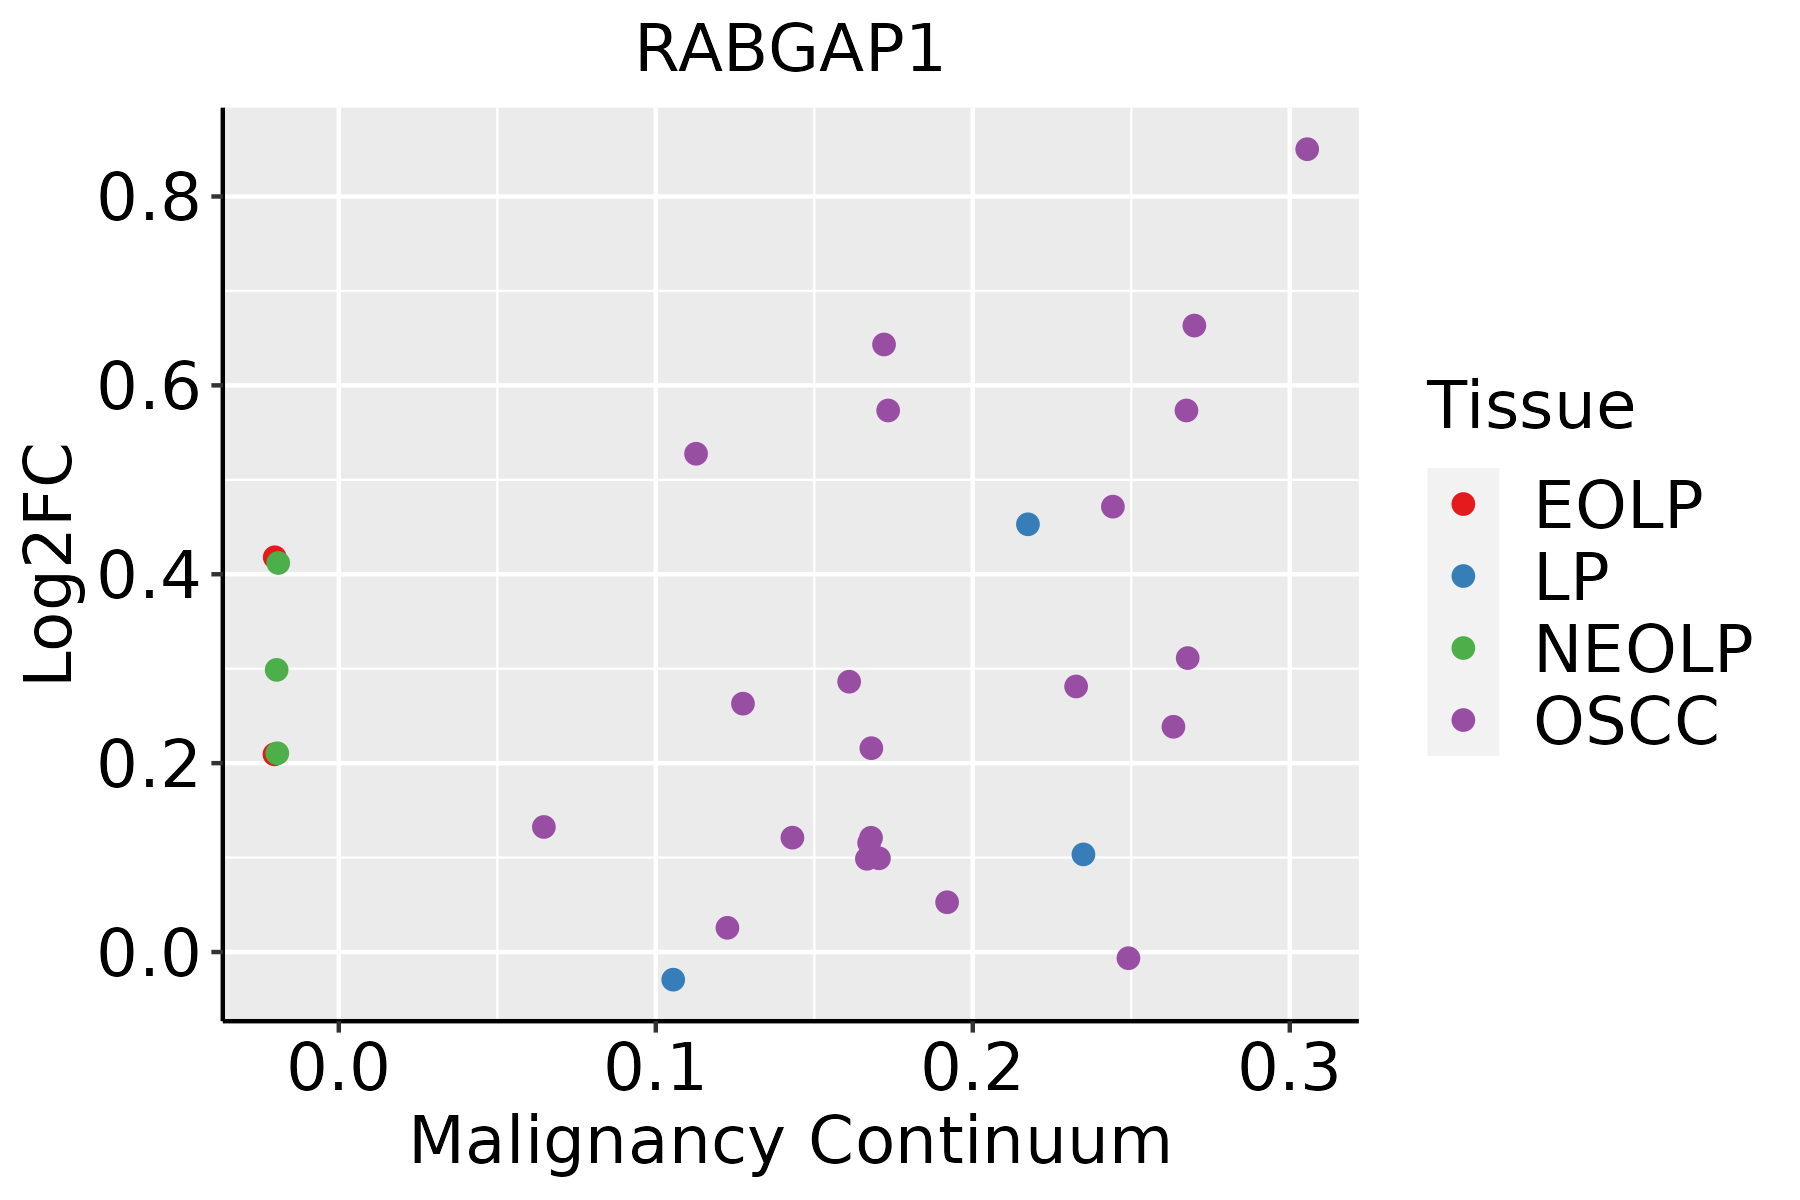 | EOLP: Erosive Oral lichen planus |
| LP: leukoplakia | ||
| NEOLP: Non-erosive oral lichen planus | ||
| OSCC: Oral squamous cell carcinoma | ||
| Prostate | 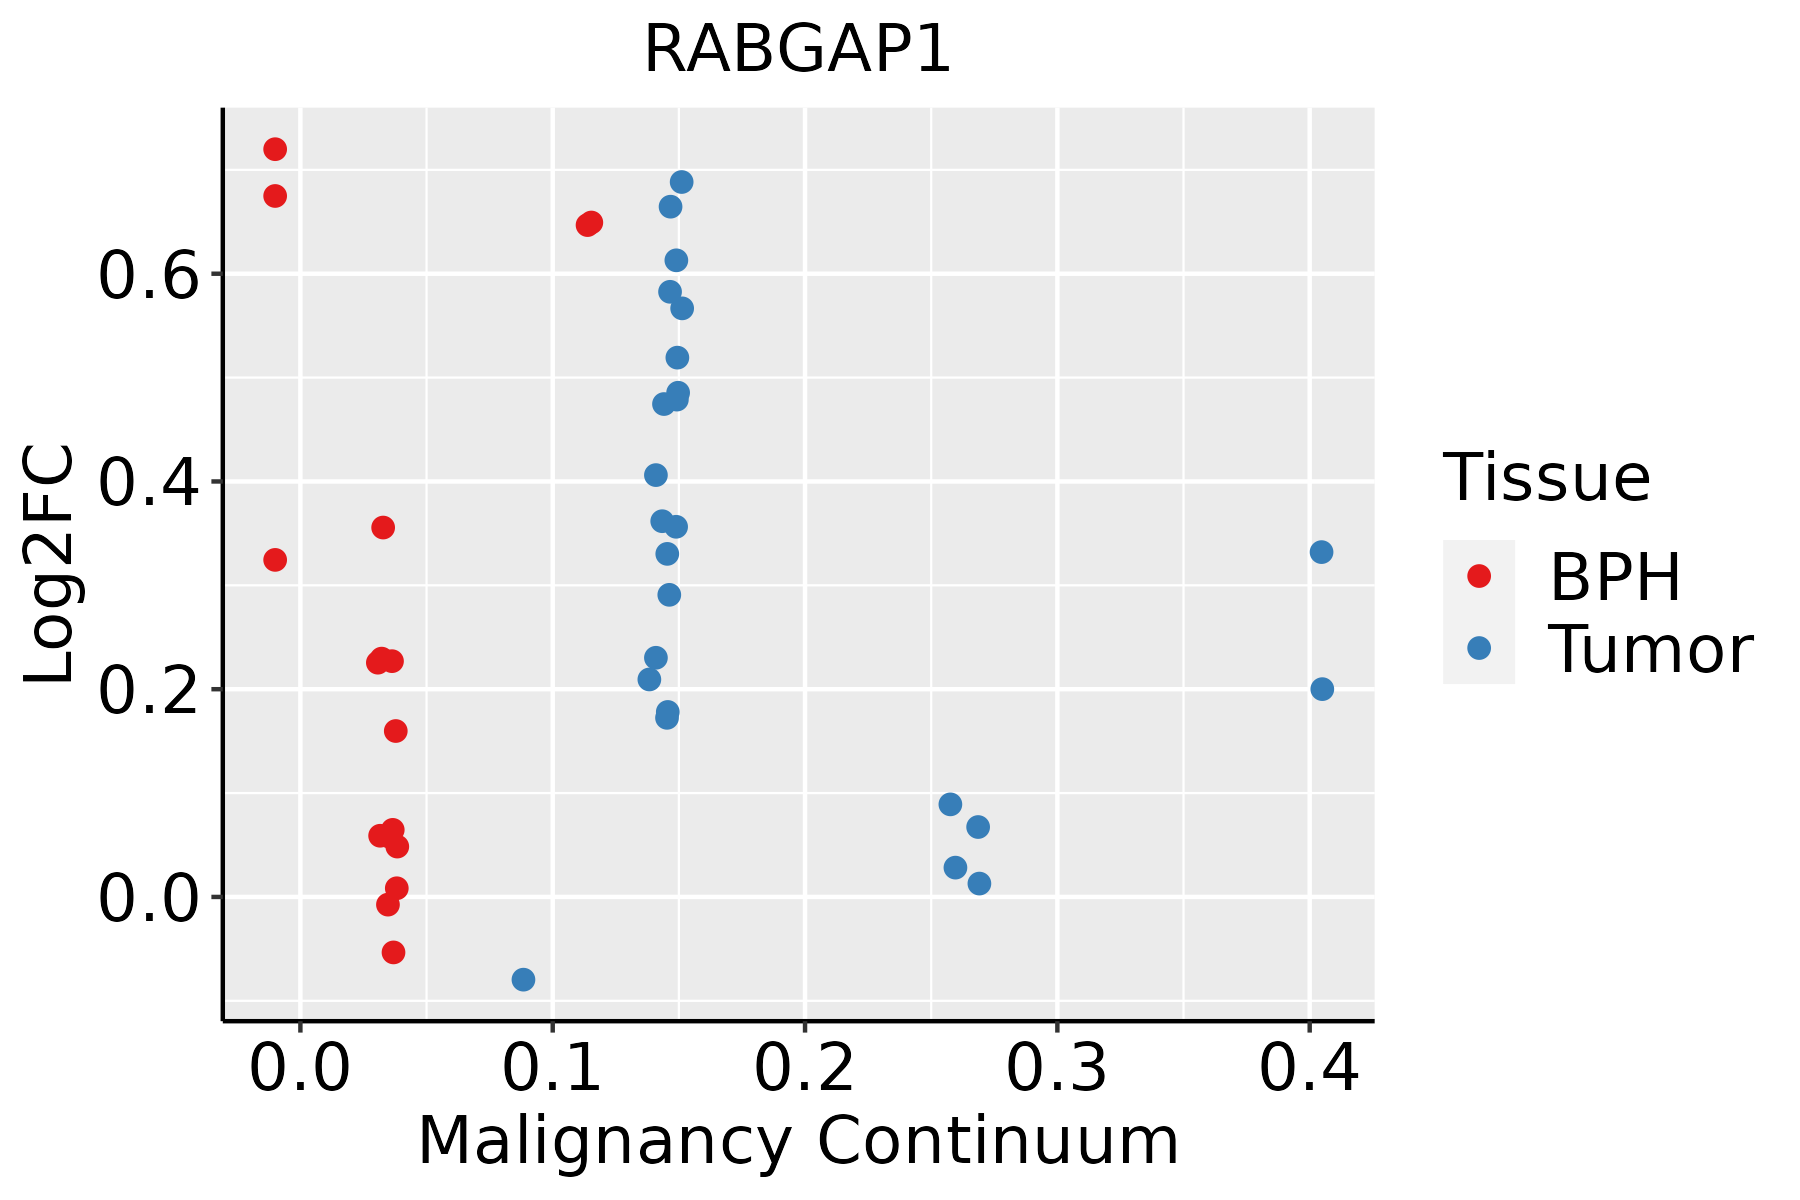 | BPH: Benign Prostatic Hyperplasia |
| Skin | 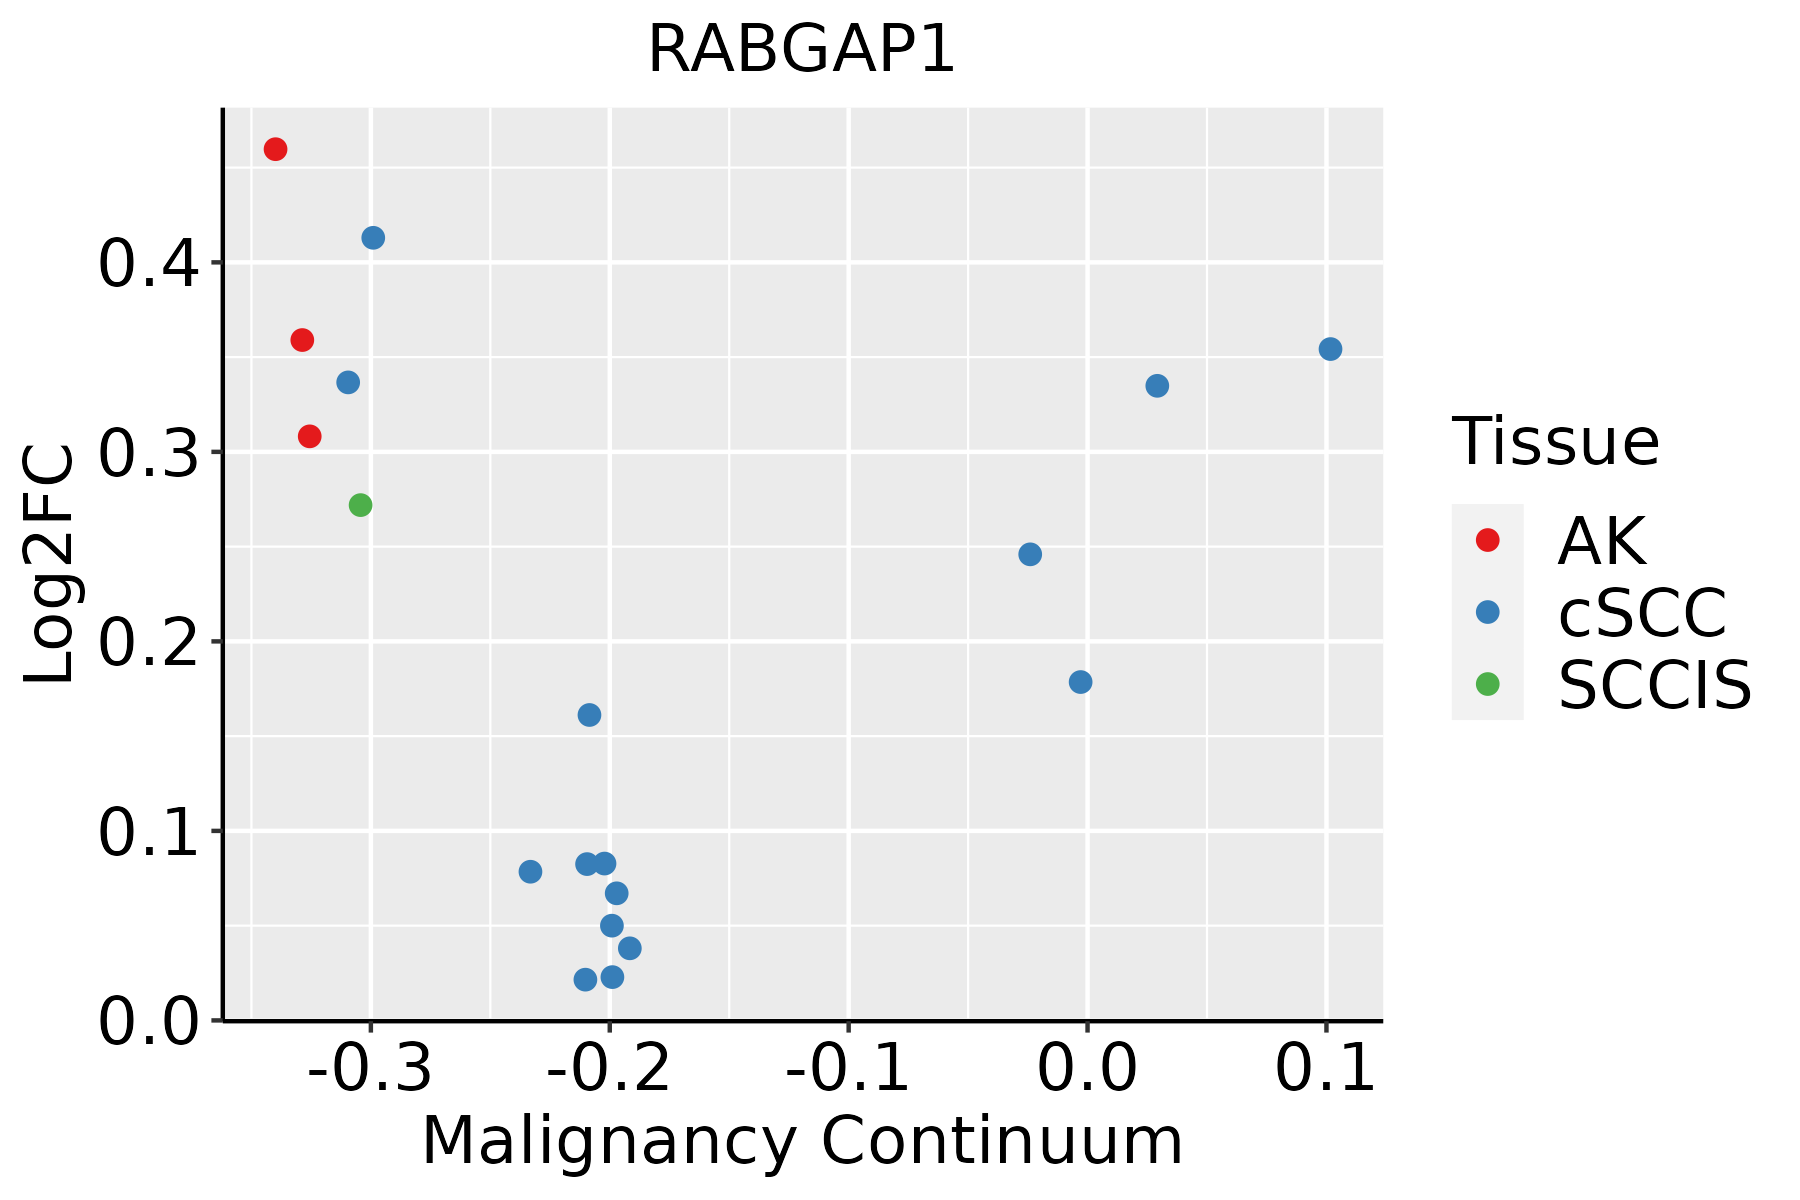 | AK: Actinic keratosis |
| cSCC: Cutaneous squamous cell carcinoma | ||
| SCCIS:squamous cell carcinoma in situ | ||
| Thyroid | 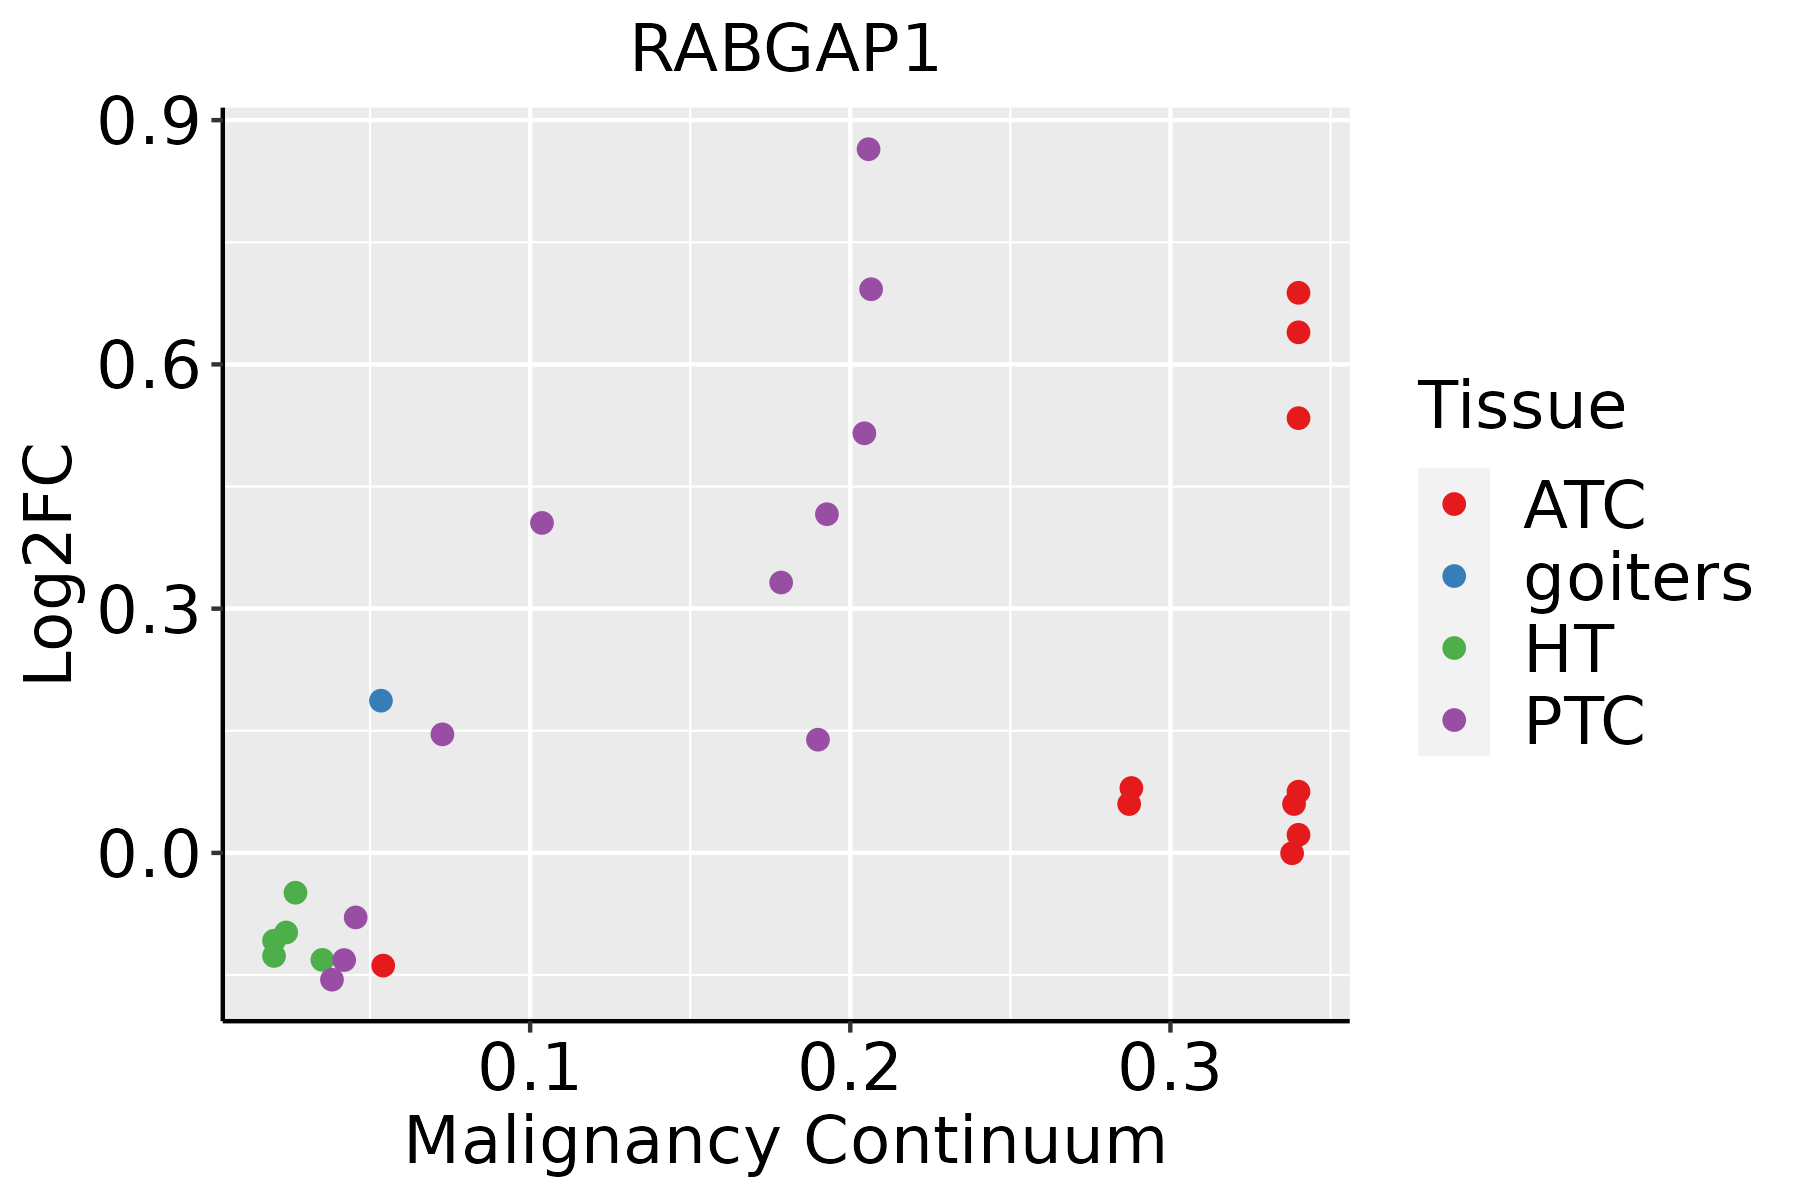 | ATC: Anaplastic thyroid cancer |
| HT: Hashimoto's thyroiditis | ||
| PTC: Papillary thyroid cancer |
| ∗log2FC in expression of this searched gene in stem-like cells from each diseased tissue sample relative to stem-like cells in normal samples in each tissue plotted against the malignancy continuum. Samples are colored based on if they are from different disease stage. |
Top |
Malignant transformation related pathway analysis |
| Find out the enriched GO biological processes and KEGG pathways involved in transition from healthy to precancer to cancer |
| Tissue | Disease Stage | Enriched GO biological Processes |
| Colorectum | AD |  |
| Colorectum | SER |  |
| Colorectum | MSS |  |
| Colorectum | MSI-H |  |
| Colorectum | FAP |  |
| ∗Top 15 enriched GO BP terms are showed in the bar plot of each disease state in each tissue. Each row represents a significant GO biological process which is colored according to the -log10(p.adjust). |
| Page: 1 2 3 4 5 6 7 8 9 |
| GO ID | Tissue | Disease Stage | Description | Gene Ratio | Bg Ratio | pvalue | p.adjust | Count |
| GO:00430877 | Cervix | CC | regulation of GTPase activity | 79/2311 | 348/18723 | 4.21e-08 | 2.60e-06 | 79 |
| GO:00435476 | Cervix | CC | positive regulation of GTPase activity | 53/2311 | 255/18723 | 8.72e-05 | 1.16e-03 | 53 |
| GO:0043087 | Colorectum | AD | regulation of GTPase activity | 110/3918 | 348/18723 | 1.64e-06 | 5.03e-05 | 110 |
| GO:0043547 | Colorectum | AD | positive regulation of GTPase activity | 75/3918 | 255/18723 | 7.95e-04 | 7.91e-03 | 75 |
| GO:00430871 | Colorectum | SER | regulation of GTPase activity | 77/2897 | 348/18723 | 5.90e-04 | 8.07e-03 | 77 |
| GO:00430872 | Colorectum | MSS | regulation of GTPase activity | 101/3467 | 348/18723 | 1.00e-06 | 3.46e-05 | 101 |
| GO:00435471 | Colorectum | MSS | positive regulation of GTPase activity | 68/3467 | 255/18723 | 7.97e-04 | 8.38e-03 | 68 |
| GO:00430873 | Colorectum | FAP | regulation of GTPase activity | 85/2622 | 348/18723 | 1.20e-07 | 7.68e-06 | 85 |
| GO:00435472 | Colorectum | FAP | positive regulation of GTPase activity | 61/2622 | 255/18723 | 1.39e-05 | 3.73e-04 | 61 |
| GO:0090630 | Colorectum | FAP | activation of GTPase activity | 27/2622 | 115/18723 | 4.23e-03 | 2.90e-02 | 27 |
| GO:00430874 | Colorectum | CRC | regulation of GTPase activity | 69/2078 | 348/18723 | 1.11e-06 | 6.69e-05 | 69 |
| GO:00435473 | Colorectum | CRC | positive regulation of GTPase activity | 49/2078 | 255/18723 | 8.67e-05 | 1.77e-03 | 49 |
| GO:00430878 | Endometrium | AEH | regulation of GTPase activity | 66/2100 | 348/18723 | 1.26e-05 | 2.77e-04 | 66 |
| GO:00435477 | Endometrium | AEH | positive regulation of GTPase activity | 48/2100 | 255/18723 | 2.18e-04 | 2.67e-03 | 48 |
| GO:00906304 | Endometrium | AEH | activation of GTPase activity | 22/2100 | 115/18723 | 8.42e-03 | 4.60e-02 | 22 |
| GO:004308712 | Endometrium | EEC | regulation of GTPase activity | 67/2168 | 348/18723 | 1.84e-05 | 3.43e-04 | 67 |
| GO:004354712 | Endometrium | EEC | positive regulation of GTPase activity | 50/2168 | 255/18723 | 1.26e-04 | 1.66e-03 | 50 |
| GO:009063012 | Endometrium | EEC | activation of GTPase activity | 23/2168 | 115/18723 | 6.04e-03 | 3.57e-02 | 23 |
| GO:004308715 | Esophagus | ESCC | regulation of GTPase activity | 183/8552 | 348/18723 | 5.34e-03 | 2.00e-02 | 183 |
| GO:00430875 | Liver | NAFLD | regulation of GTPase activity | 62/1882 | 348/18723 | 5.65e-06 | 2.03e-04 | 62 |
| Page: 1 2 3 |
| Pathway ID | Tissue | Disease Stage | Description | Gene Ratio | Bg Ratio | pvalue | p.adjust | qvalue | Count |
| Page: 1 |
Top |
Cell-cell communication analysis |
| Identification of potential cell-cell interactions between two cell types and their ligand-receptor pairs for different disease states |
| Ligand | Receptor | LRpair | Pathway | Tissue | Disease Stage |
| Page: 1 |
Top |
Single-cell gene regulatory network inference analysis |
| Find out the significant the regulons (TFs) and the target genes of each regulon across cell types for different disease states |
| TF | Cell Type | Tissue | Disease Stage | Target Gene | RSS | Regulon Activity |
| ∗The dot plots of a searched regulon are shown for all cell subpopulations in each disease state of each tissue based on the regulon specific score inferred using pySCENIC and by calculating the average expression. |
| Page: 1 |
Top |
Somatic mutation of malignant transformation related genes |
| Annotation of somatic variants for genes involved in malignant transformation |
| Hugo Symbol | Variant Class | Variant Classification | dbSNP RS | HGVSc | HGVSp | HGVSp Short | SWISSPROT | BIOTYPE | SIFT | PolyPhen | Tumor Sample Barcode | Tissue | Histology | Sex | Age | Stage | Therapy Types | Drugs | Outcome |
| RABGAP1 | deletion | Frame_Shift_Del | rs749213218 | c.2782delN | p.Asn930ThrfsTer15 | p.N930Tfs*15 | Q9Y3P9 | protein_coding | TCGA-EY-A2OP-01 | Endometrium | uterine corpus endometrioid carcinoma | Female | <65 | I/II | Unknown | Unknown | SD | ||
| RABGAP1 | SNV | Missense_Mutation | c.1444G>C | p.Glu482Gln | p.E482Q | Q9Y3P9 | protein_coding | tolerated(0.1) | benign(0.035) | TCGA-G3-A3CJ-01 | Liver | liver hepatocellular carcinoma | Male | <65 | I/II | Targeted Molecular therapy | sorafenib | PD | |
| RABGAP1 | SNV | Missense_Mutation | c.1730N>T | p.Gln577Leu | p.Q577L | Q9Y3P9 | protein_coding | tolerated(0.07) | probably_damaging(0.956) | TCGA-UB-A7MB-01 | Liver | liver hepatocellular carcinoma | Male | <65 | I/II | Targeted Molecular therapy | sorafenib | PD | |
| RABGAP1 | SNV | Missense_Mutation | novel | c.1520N>A | p.Pro507His | p.P507H | Q9Y3P9 | protein_coding | tolerated(0.48) | possibly_damaging(0.592) | TCGA-05-4417-01 | Lung | lung adenocarcinoma | Female | <65 | I/II | Unknown | Unknown | SD |
| RABGAP1 | SNV | Missense_Mutation | c.1405G>A | p.Asp469Asn | p.D469N | Q9Y3P9 | protein_coding | tolerated(0.06) | benign(0.007) | TCGA-55-7994-01 | Lung | lung adenocarcinoma | Male | >=65 | I/II | Chemotherapy | carboplatin | CR | |
| RABGAP1 | SNV | Missense_Mutation | c.2916N>G | p.Cys972Trp | p.C972W | Q9Y3P9 | protein_coding | deleterious(0) | probably_damaging(0.982) | TCGA-55-8203-01 | Lung | lung adenocarcinoma | Female | >=65 | I/II | Unknown | Unknown | SD | |
| RABGAP1 | SNV | Missense_Mutation | c.763N>C | p.Ala255Pro | p.A255P | Q9Y3P9 | protein_coding | deleterious(0) | probably_damaging(0.993) | TCGA-55-A490-01 | Lung | lung adenocarcinoma | Male | >=65 | I/II | Chemotherapy | carboplatin | SD | |
| RABGAP1 | SNV | Missense_Mutation | c.579A>T | p.Glu193Asp | p.E193D | Q9Y3P9 | protein_coding | tolerated(0.58) | benign(0.018) | TCGA-64-1678-01 | Lung | lung adenocarcinoma | Female | >=65 | I/II | Chemotherapy | carboplatin | SD | |
| RABGAP1 | SNV | Missense_Mutation | novel | c.2685N>C | p.Leu895Phe | p.L895F | Q9Y3P9 | protein_coding | deleterious(0.01) | benign(0.297) | TCGA-97-A4LX-01 | Lung | lung adenocarcinoma | Male | >=65 | I/II | Unknown | Unknown | SD |
| RABGAP1 | SNV | Missense_Mutation | c.1247C>T | p.Thr416Ile | p.T416I | Q9Y3P9 | protein_coding | tolerated(0.12) | possibly_damaging(0.834) | TCGA-22-5482-01 | Lung | lung squamous cell carcinoma | Male | >=65 | I/II | Unknown | Unknown | SD |
| Page: 1 2 3 4 5 6 7 8 9 10 11 12 13 |
Top |
Related drugs of malignant transformation related genes |
| Identification of chemicals and drugs interact with genes involved in malignant transfromation |
| (DGIdb 4.0) |
| Entrez ID | Symbol | Category | Interaction Types | Drug Claim Name | Drug Name | PMIDs |
| Page: 1 |

Copyright 2023-Present -The University of Texas Health Science Center at Houston |