
|
|||||
|
 | |
| |
| |
| |
| |
| |
|
Gene: DYRK4 |
Gene summary for DYRK4 |
| Gene information | Species | Human | Gene symbol | DYRK4 | Gene ID | 8798 |
| Gene name | dual specificity tyrosine phosphorylation regulated kinase 4 | |
| Gene Alias | DYRK4 | |
| Cytomap | 12p13.32 | |
| Gene Type | protein-coding | GO ID | GO:0006464 | UniProtAcc | D3JEN2 |
Top |
Malignant transformation analysis |
| Identification of the aberrant gene expression in precancerous and cancerous lesions by comparing the gene expression of stem-like cells in diseased tissues with normal stem cells |
| Entrez ID | Symbol | Replicates | Species | Organ | Tissue | Adj P-value | Log2FC | Malignancy |
| 8798 | DYRK4 | HTA11_3410_2000001011 | Human | Colorectum | AD | 3.66e-02 | 1.24e-01 | 0.0155 |
| 8798 | DYRK4 | HTA11_1938_2000001011 | Human | Colorectum | AD | 2.30e-02 | 1.94e-01 | -0.0811 |
| 8798 | DYRK4 | HTA11_347_2000001011 | Human | Colorectum | AD | 5.50e-03 | 1.47e-01 | -0.1954 |
| 8798 | DYRK4 | HTA11_696_2000001011 | Human | Colorectum | AD | 3.85e-04 | 1.55e-01 | -0.1464 |
| 8798 | DYRK4 | HTA11_866_2000001011 | Human | Colorectum | AD | 2.05e-06 | 1.97e-01 | -0.1001 |
| 8798 | DYRK4 | HTA11_1391_2000001011 | Human | Colorectum | AD | 2.63e-07 | 2.58e-01 | -0.059 |
| 8798 | DYRK4 | HTA11_7696_3000711011 | Human | Colorectum | AD | 2.07e-08 | 1.77e-01 | 0.0674 |
| 8798 | DYRK4 | HTA11_99999965062_69753 | Human | Colorectum | MSI-H | 9.21e-04 | 5.32e-01 | 0.3487 |
| 8798 | DYRK4 | HTA11_99999974143_84620 | Human | Colorectum | MSS | 9.04e-05 | 1.29e-01 | 0.3005 |
| 8798 | DYRK4 | LZE7T | Human | Esophagus | ESCC | 5.37e-05 | 2.78e-01 | 0.0667 |
| 8798 | DYRK4 | LZE24T | Human | Esophagus | ESCC | 1.61e-10 | 3.29e-01 | 0.0596 |
| 8798 | DYRK4 | P2T-E | Human | Esophagus | ESCC | 3.15e-55 | 9.69e-01 | 0.1177 |
| 8798 | DYRK4 | P4T-E | Human | Esophagus | ESCC | 3.05e-44 | 9.47e-01 | 0.1323 |
| 8798 | DYRK4 | P5T-E | Human | Esophagus | ESCC | 6.53e-18 | 2.43e-01 | 0.1327 |
| 8798 | DYRK4 | P8T-E | Human | Esophagus | ESCC | 1.76e-13 | 1.76e-01 | 0.0889 |
| 8798 | DYRK4 | P9T-E | Human | Esophagus | ESCC | 3.18e-12 | 2.52e-01 | 0.1131 |
| 8798 | DYRK4 | P10T-E | Human | Esophagus | ESCC | 1.47e-21 | 3.59e-01 | 0.116 |
| 8798 | DYRK4 | P11T-E | Human | Esophagus | ESCC | 5.68e-11 | 4.70e-01 | 0.1426 |
| 8798 | DYRK4 | P12T-E | Human | Esophagus | ESCC | 3.96e-53 | 8.84e-01 | 0.1122 |
| 8798 | DYRK4 | P16T-E | Human | Esophagus | ESCC | 1.75e-20 | 3.84e-01 | 0.1153 |
| Page: 1 2 3 4 5 |
| Tissue | Expression Dynamics | Abbreviation |
| Colorectum (GSE201348) |  | FAP: Familial adenomatous polyposis |
| CRC: Colorectal cancer | ||
| Colorectum (HTA11) |  | AD: Adenomas |
| SER: Sessile serrated lesions | ||
| MSI-H: Microsatellite-high colorectal cancer | ||
| MSS: Microsatellite stable colorectal cancer | ||
| Esophagus | 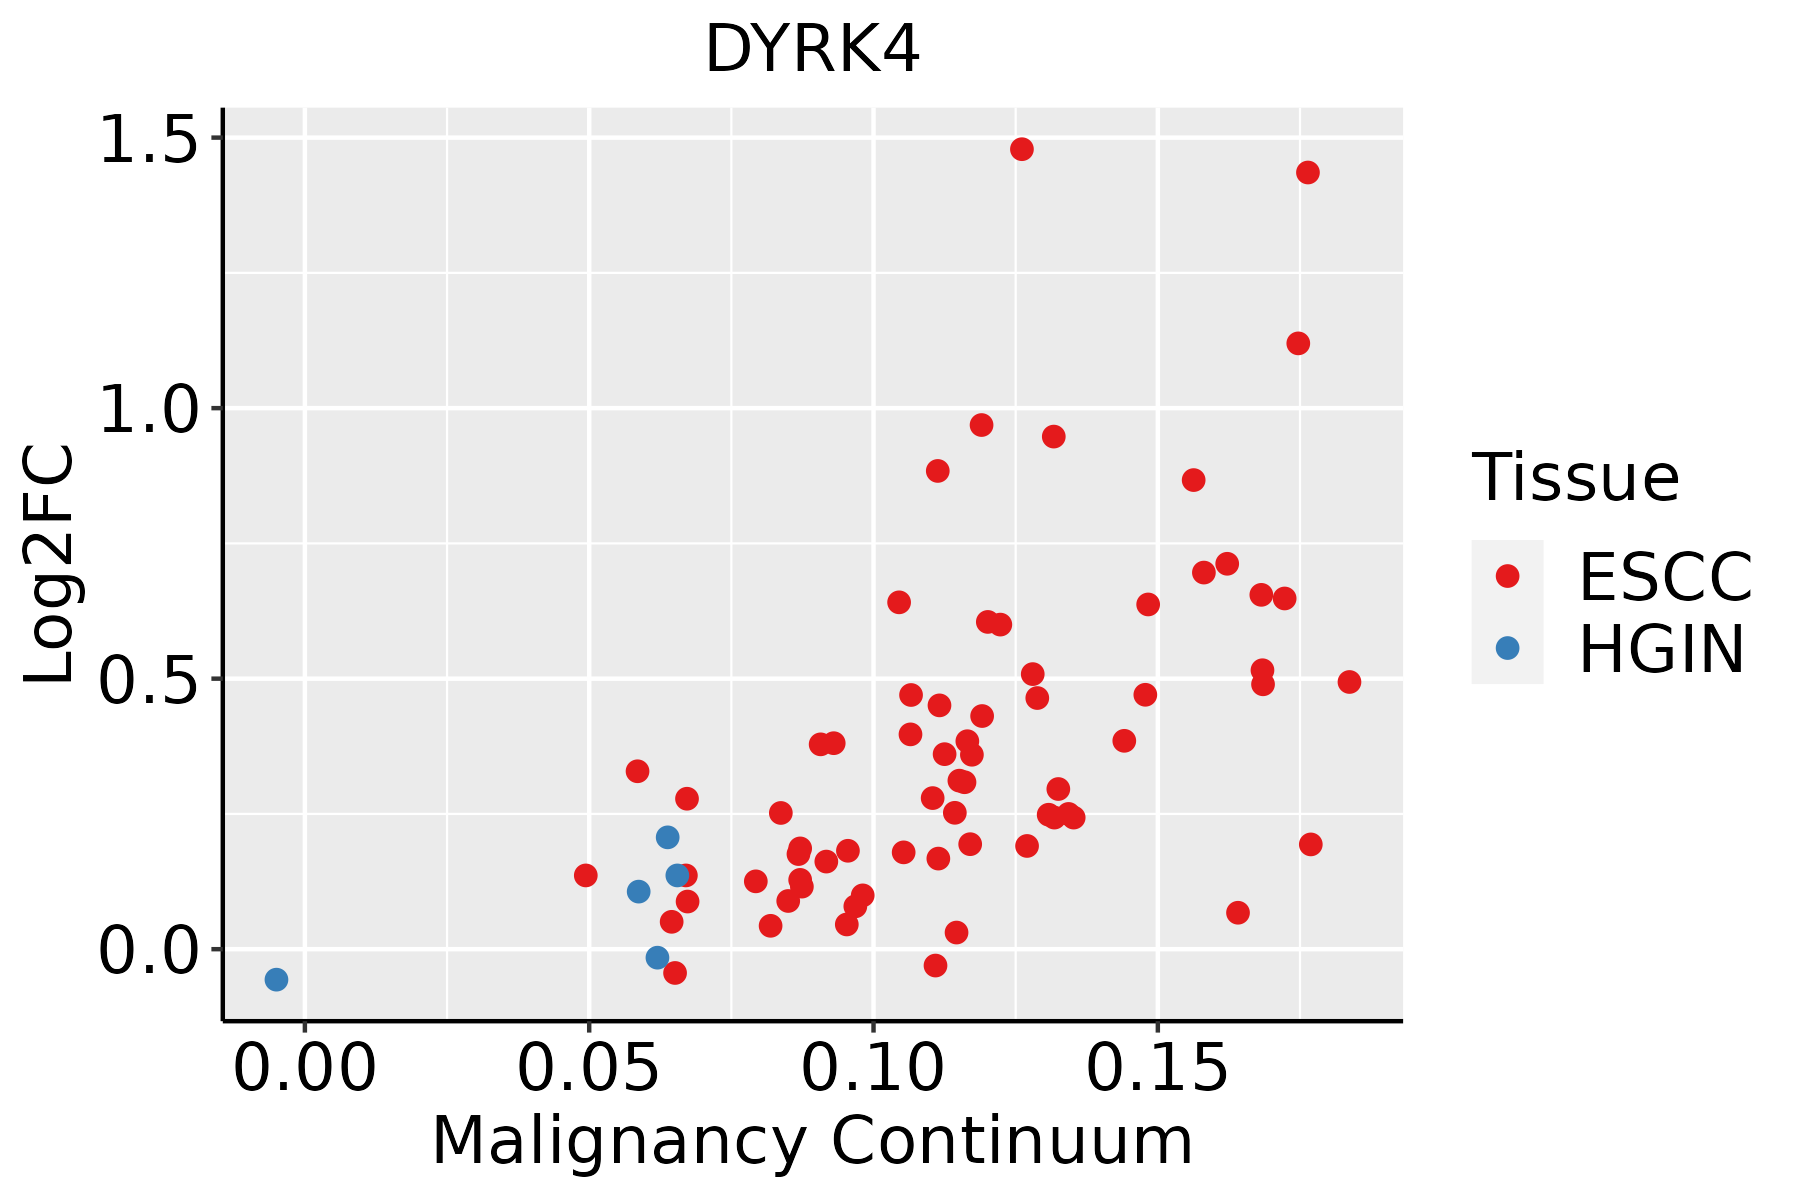 | ESCC: Esophageal squamous cell carcinoma |
| HGIN: High-grade intraepithelial neoplasias | ||
| LGIN: Low-grade intraepithelial neoplasias | ||
| Oral Cavity | 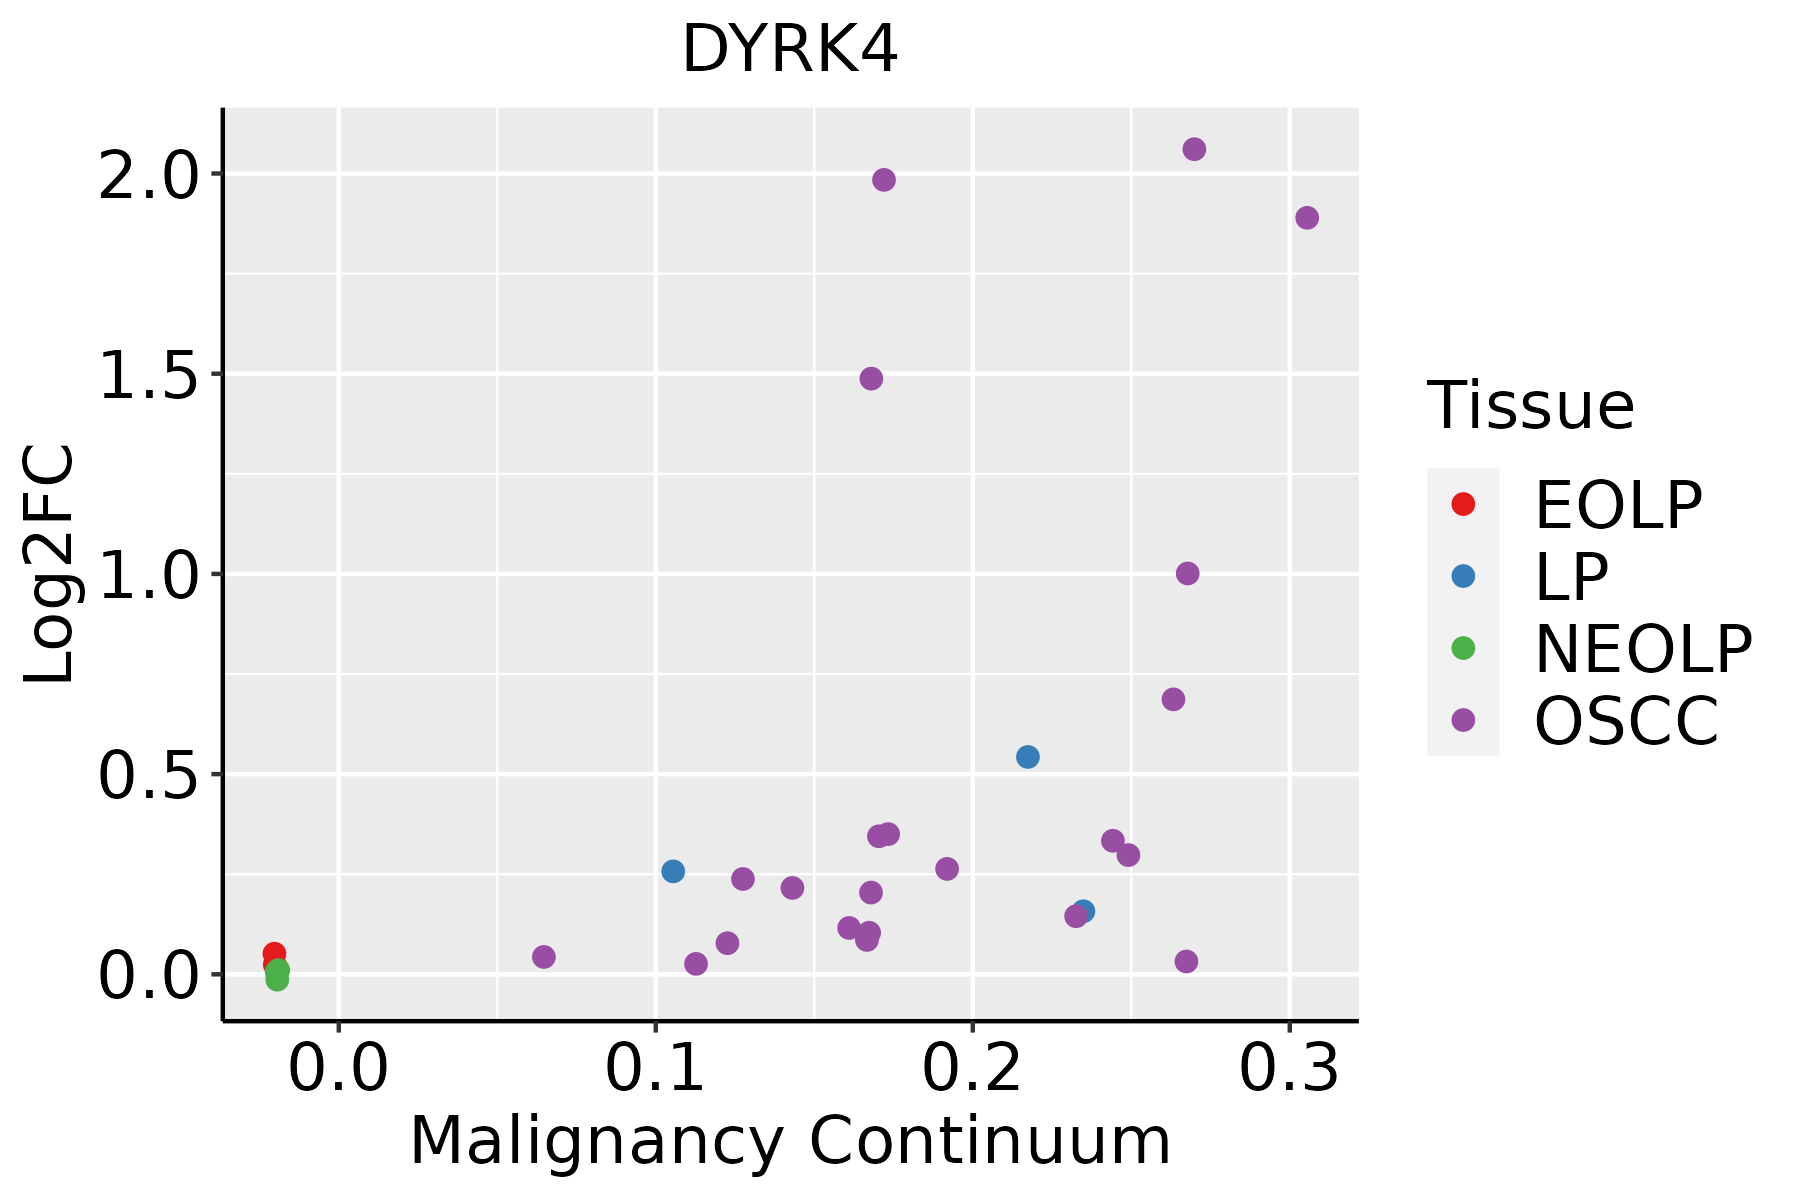 | EOLP: Erosive Oral lichen planus |
| LP: leukoplakia | ||
| NEOLP: Non-erosive oral lichen planus | ||
| OSCC: Oral squamous cell carcinoma | ||
| Thyroid | 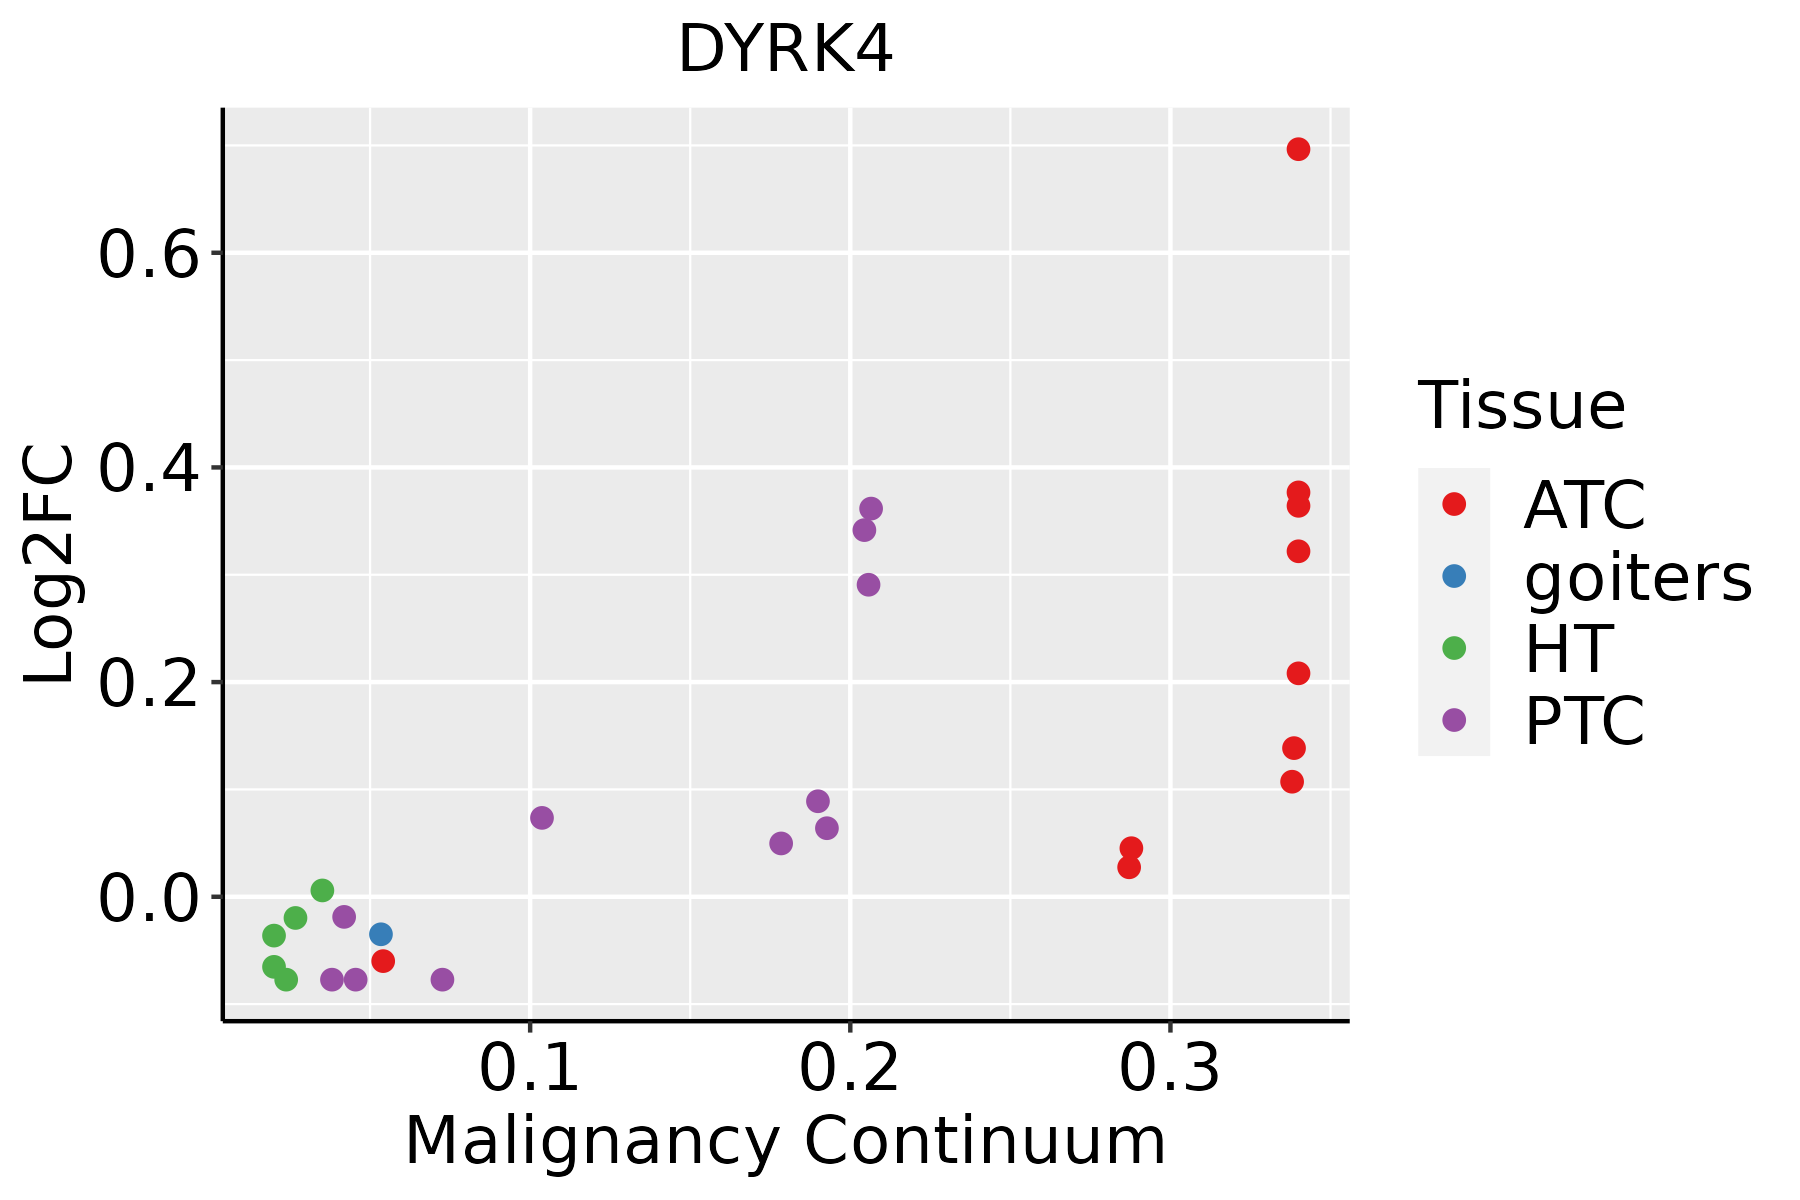 | ATC: Anaplastic thyroid cancer |
| HT: Hashimoto's thyroiditis | ||
| PTC: Papillary thyroid cancer |
| ∗log2FC in expression of this searched gene in stem-like cells from each diseased tissue sample relative to stem-like cells in normal samples in each tissue plotted against the malignancy continuum. Samples are colored based on if they are from different disease stage. |
Top |
Malignant transformation related pathway analysis |
| Find out the enriched GO biological processes and KEGG pathways involved in transition from healthy to precancer to cancer |
| Tissue | Disease Stage | Enriched GO biological Processes |
| Colorectum | AD |  |
| Colorectum | SER |  |
| Colorectum | MSS |  |
| Colorectum | MSI-H |  |
| Colorectum | FAP |  |
| ∗Top 15 enriched GO BP terms are showed in the bar plot of each disease state in each tissue. Each row represents a significant GO biological process which is colored according to the -log10(p.adjust). |
| Page: 1 2 3 4 5 6 7 8 9 |
| GO ID | Tissue | Disease Stage | Description | Gene Ratio | Bg Ratio | pvalue | p.adjust | Count |
| GO:0018105 | Colorectum | AD | peptidyl-serine phosphorylation | 88/3918 | 315/18723 | 1.73e-03 | 1.43e-02 | 88 |
| GO:0018210 | Colorectum | AD | peptidyl-threonine modification | 40/3918 | 125/18723 | 2.44e-03 | 1.88e-02 | 40 |
| GO:0018209 | Colorectum | AD | peptidyl-serine modification | 92/3918 | 338/18723 | 3.19e-03 | 2.36e-02 | 92 |
| GO:0018107 | Colorectum | AD | peptidyl-threonine phosphorylation | 37/3918 | 116/18723 | 3.68e-03 | 2.61e-02 | 37 |
| GO:00181052 | Colorectum | MSS | peptidyl-serine phosphorylation | 81/3467 | 315/18723 | 8.92e-04 | 9.12e-03 | 81 |
| GO:00182091 | Colorectum | MSS | peptidyl-serine modification | 84/3467 | 338/18723 | 2.12e-03 | 1.79e-02 | 84 |
| GO:00181071 | Colorectum | MSS | peptidyl-threonine phosphorylation | 34/3467 | 116/18723 | 3.08e-03 | 2.34e-02 | 34 |
| GO:00182101 | Colorectum | MSS | peptidyl-threonine modification | 36/3467 | 125/18723 | 3.28e-03 | 2.49e-02 | 36 |
| GO:00182099 | Esophagus | ESCC | peptidyl-serine modification | 196/8552 | 338/18723 | 3.07e-06 | 3.47e-05 | 196 |
| GO:001810515 | Esophagus | ESCC | peptidyl-serine phosphorylation | 184/8552 | 315/18723 | 3.22e-06 | 3.61e-05 | 184 |
| GO:00182124 | Esophagus | ESCC | peptidyl-tyrosine modification | 202/8552 | 378/18723 | 1.34e-03 | 6.39e-03 | 202 |
| GO:00181084 | Esophagus | ESCC | peptidyl-tyrosine phosphorylation | 200/8552 | 375/18723 | 1.60e-03 | 7.45e-03 | 200 |
| GO:001810710 | Esophagus | ESCC | peptidyl-threonine phosphorylation | 66/8552 | 116/18723 | 9.76e-03 | 3.37e-02 | 66 |
| GO:001821010 | Esophagus | ESCC | peptidyl-threonine modification | 70/8552 | 125/18723 | 1.29e-02 | 4.25e-02 | 70 |
| GO:00182098 | Oral cavity | OSCC | peptidyl-serine modification | 175/7305 | 338/18723 | 1.09e-06 | 1.46e-05 | 175 |
| GO:001810510 | Oral cavity | OSCC | peptidyl-serine phosphorylation | 164/7305 | 315/18723 | 1.51e-06 | 1.99e-05 | 164 |
| GO:00182123 | Oral cavity | OSCC | peptidyl-tyrosine modification | 180/7305 | 378/18723 | 3.63e-04 | 2.22e-03 | 180 |
| GO:00181083 | Oral cavity | OSCC | peptidyl-tyrosine phosphorylation | 177/7305 | 375/18723 | 6.86e-04 | 3.83e-03 | 177 |
| GO:00181079 | Oral cavity | OSCC | peptidyl-threonine phosphorylation | 60/7305 | 116/18723 | 3.59e-03 | 1.50e-02 | 60 |
| GO:00182109 | Oral cavity | OSCC | peptidyl-threonine modification | 64/7305 | 125/18723 | 3.68e-03 | 1.52e-02 | 64 |
| Page: 1 2 |
| Pathway ID | Tissue | Disease Stage | Description | Gene Ratio | Bg Ratio | pvalue | p.adjust | qvalue | Count |
| Page: 1 |
Top |
Cell-cell communication analysis |
| Identification of potential cell-cell interactions between two cell types and their ligand-receptor pairs for different disease states |
| Ligand | Receptor | LRpair | Pathway | Tissue | Disease Stage |
| Page: 1 |
Top |
Single-cell gene regulatory network inference analysis |
| Find out the significant the regulons (TFs) and the target genes of each regulon across cell types for different disease states |
| TF | Cell Type | Tissue | Disease Stage | Target Gene | RSS | Regulon Activity |
| ∗The dot plots of a searched regulon are shown for all cell subpopulations in each disease state of each tissue based on the regulon specific score inferred using pySCENIC and by calculating the average expression. |
| Page: 1 |
Top |
Somatic mutation of malignant transformation related genes |
| Annotation of somatic variants for genes involved in malignant transformation |
| Hugo Symbol | Variant Class | Variant Classification | dbSNP RS | HGVSc | HGVSp | HGVSp Short | SWISSPROT | BIOTYPE | SIFT | PolyPhen | Tumor Sample Barcode | Tissue | Histology | Sex | Age | Stage | Therapy Types | Drugs | Outcome |
| DYRK4 | SNV | Missense_Mutation | c.461N>G | p.Ala154Gly | p.A154G | Q9NR20 | protein_coding | tolerated(0.4) | benign(0.21) | TCGA-EL-A3GS-01 | Thyroid | thyroid carcinoma | Female | <65 | I/II | Unknown | Unknown | SD |
| Page: 1 2 3 4 5 6 7 8 9 |
Top |
Related drugs of malignant transformation related genes |
| Identification of chemicals and drugs interact with genes involved in malignant transfromation |
| (DGIdb 4.0) |
| Entrez ID | Symbol | Category | Interaction Types | Drug Claim Name | Drug Name | PMIDs |
| 8798 | DYRK4 | ENZYME, KINASE, DRUGGABLE GENOME, TYROSINE KINASE, SERINE THREONINE KINASE | inhibitor | 249565847 | ||
| 8798 | DYRK4 | ENZYME, KINASE, DRUGGABLE GENOME, TYROSINE KINASE, SERINE THREONINE KINASE | TAMATINIB | R-406 | ||
| 8798 | DYRK4 | ENZYME, KINASE, DRUGGABLE GENOME, TYROSINE KINASE, SERINE THREONINE KINASE | PHA-767491 | CHEMBL225519 |
| Page: 1 |

Copyright 2023-Present -The University of Texas Health Science Center at Houston |