
|
|||||
|
 | |
| |
| |
| |
| |
| |
|
Gene: CAPN5 |
Gene summary for CAPN5 |
| Gene information | Species | Human | Gene symbol | CAPN5 | Gene ID | 726 |
| Gene name | calpain 5 | |
| Gene Alias | ADNIV | |
| Cytomap | 11q13.5 | |
| Gene Type | protein-coding | GO ID | GO:0006508 | UniProtAcc | A0A140VKH4 |
Top |
Malignant transformation analysis |
| Identification of the aberrant gene expression in precancerous and cancerous lesions by comparing the gene expression of stem-like cells in diseased tissues with normal stem cells |
| Entrez ID | Symbol | Replicates | Species | Organ | Tissue | Adj P-value | Log2FC | Malignancy |
| 726 | CAPN5 | HTA11_2487_2000001011 | Human | Colorectum | SER | 1.16e-05 | 5.63e-01 | -0.1808 |
| 726 | CAPN5 | HTA11_1938_2000001011 | Human | Colorectum | AD | 3.48e-02 | 2.60e-01 | -0.0811 |
| 726 | CAPN5 | HTA11_347_2000001011 | Human | Colorectum | AD | 6.80e-32 | 8.31e-01 | -0.1954 |
| 726 | CAPN5 | HTA11_411_2000001011 | Human | Colorectum | SER | 6.71e-12 | 1.35e+00 | -0.2602 |
| 726 | CAPN5 | HTA11_2112_2000001011 | Human | Colorectum | SER | 3.31e-04 | 8.14e-01 | -0.2196 |
| 726 | CAPN5 | HTA11_83_2000001011 | Human | Colorectum | SER | 3.57e-04 | 4.61e-01 | -0.1526 |
| 726 | CAPN5 | HTA11_696_2000001011 | Human | Colorectum | AD | 6.84e-11 | 5.93e-01 | -0.1464 |
| 726 | CAPN5 | HTA11_866_2000001011 | Human | Colorectum | AD | 5.13e-04 | 4.27e-01 | -0.1001 |
| 726 | CAPN5 | HTA11_1391_2000001011 | Human | Colorectum | AD | 5.13e-08 | 5.20e-01 | -0.059 |
| 726 | CAPN5 | HTA11_99999970781_79442 | Human | Colorectum | MSS | 2.23e-03 | -2.40e-01 | 0.294 |
| 726 | CAPN5 | A002-C-010 | Human | Colorectum | FAP | 2.47e-04 | -1.78e-01 | 0.242 |
| 726 | CAPN5 | A015-C-203 | Human | Colorectum | FAP | 2.45e-12 | -2.12e-01 | -0.1294 |
| 726 | CAPN5 | A002-C-201 | Human | Colorectum | FAP | 2.31e-02 | -1.78e-01 | 0.0324 |
| 726 | CAPN5 | A001-C-108 | Human | Colorectum | FAP | 2.95e-06 | -2.45e-01 | -0.0272 |
| 726 | CAPN5 | A002-C-205 | Human | Colorectum | FAP | 4.11e-07 | -3.00e-01 | -0.1236 |
| 726 | CAPN5 | A001-C-104 | Human | Colorectum | FAP | 4.17e-02 | -1.53e-01 | 0.0184 |
| 726 | CAPN5 | A015-C-006 | Human | Colorectum | FAP | 2.49e-04 | -2.51e-01 | -0.0994 |
| 726 | CAPN5 | A015-C-106 | Human | Colorectum | FAP | 3.15e-07 | -1.82e-01 | -0.0511 |
| 726 | CAPN5 | A002-C-114 | Human | Colorectum | FAP | 2.42e-04 | -2.33e-01 | -0.1561 |
| 726 | CAPN5 | A015-C-104 | Human | Colorectum | FAP | 7.70e-13 | -2.68e-01 | -0.1899 |
| Page: 1 2 3 |
| Tissue | Expression Dynamics | Abbreviation |
| Colorectum (GSE201348) | 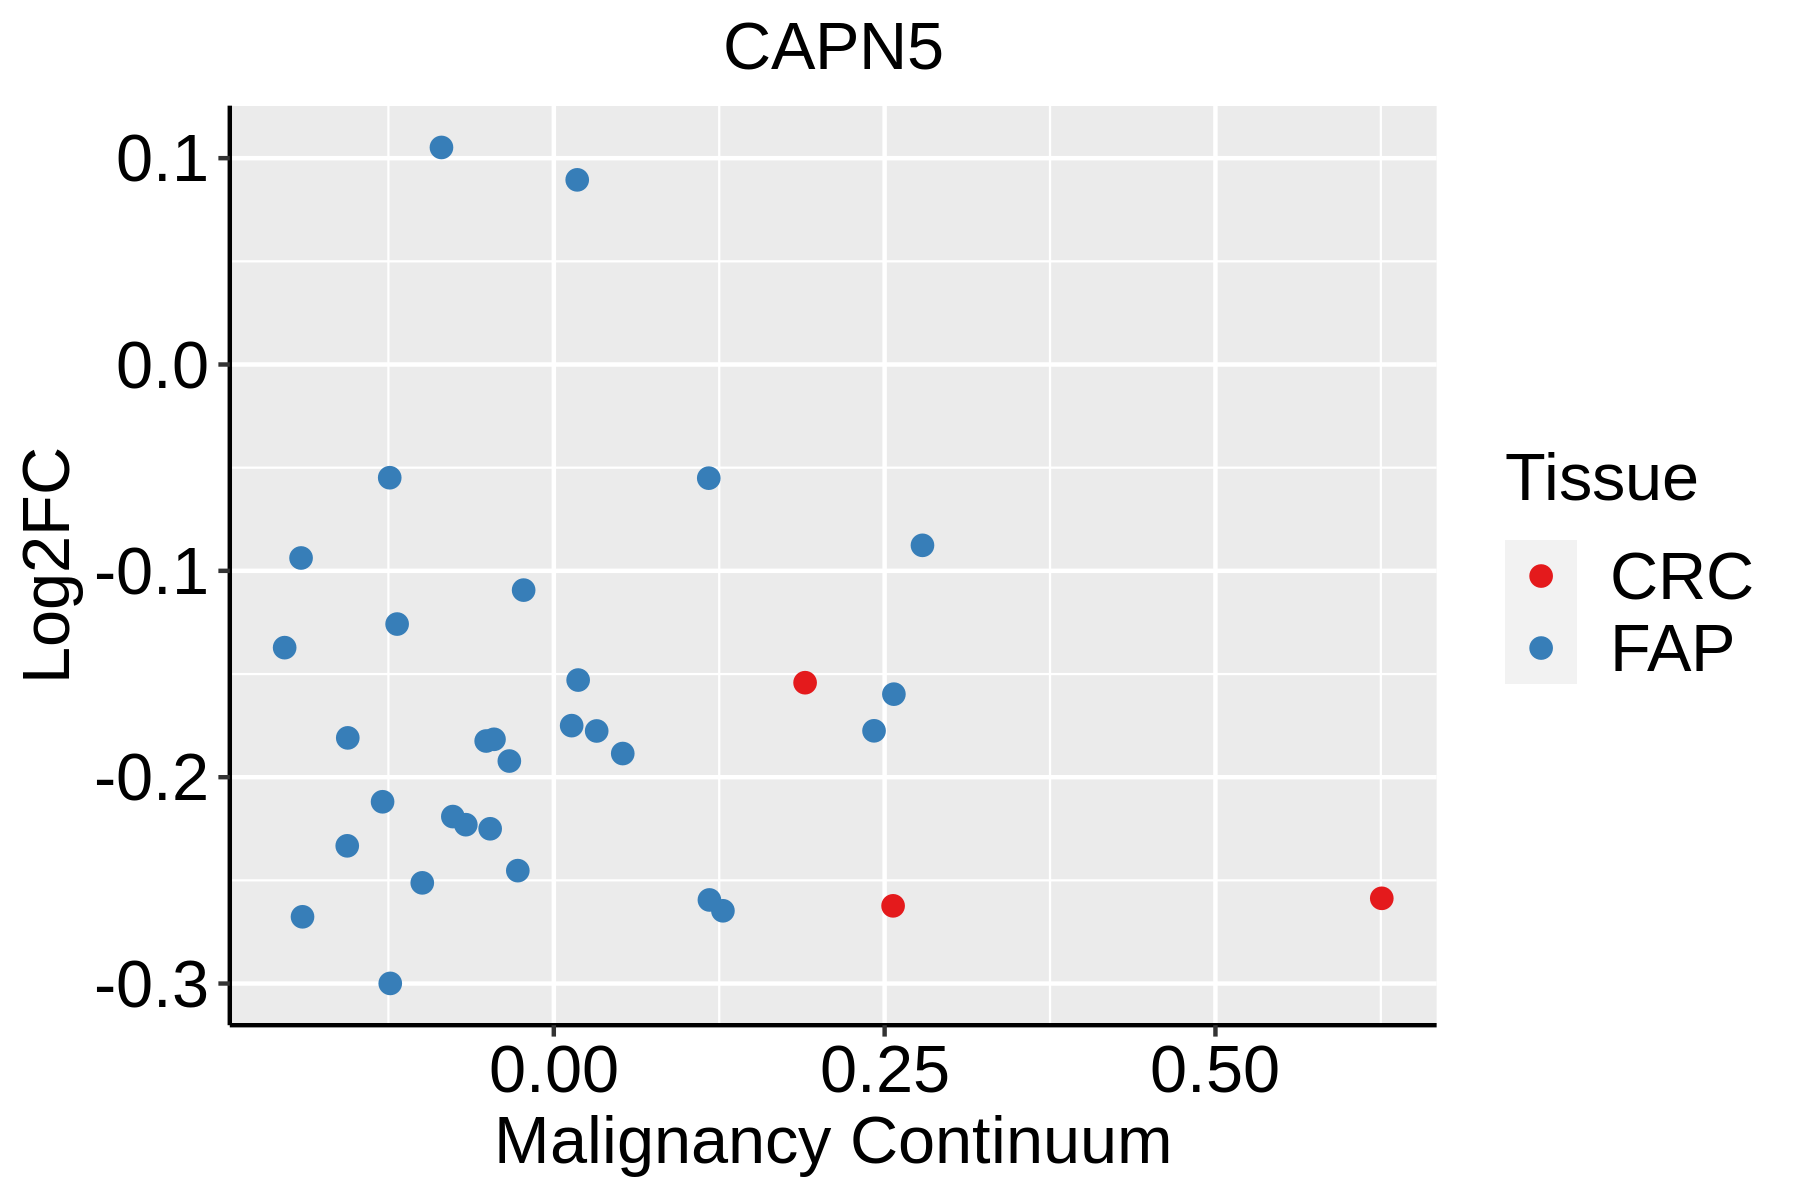 | FAP: Familial adenomatous polyposis |
| CRC: Colorectal cancer | ||
| Colorectum (HTA11) | 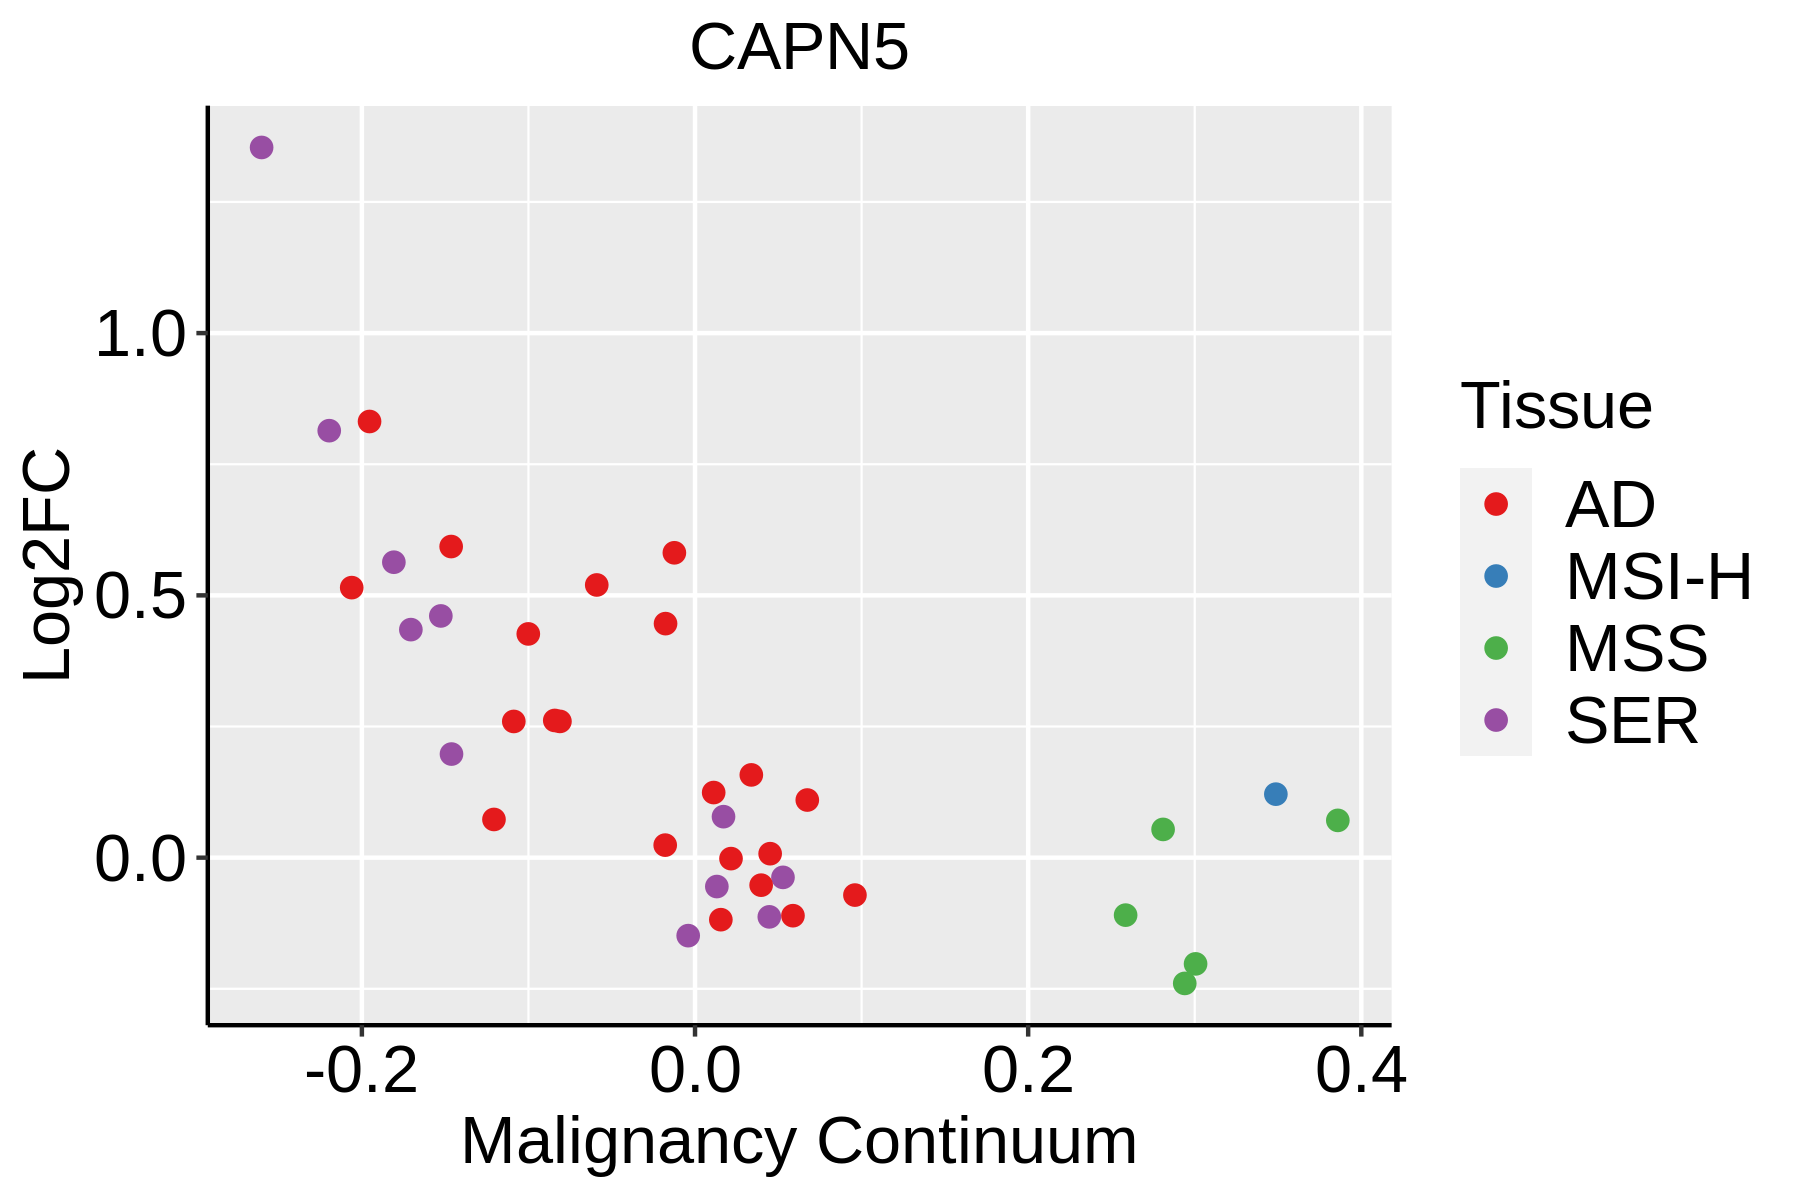 | AD: Adenomas |
| SER: Sessile serrated lesions | ||
| MSI-H: Microsatellite-high colorectal cancer | ||
| MSS: Microsatellite stable colorectal cancer | ||
| Esophagus |  | ESCC: Esophageal squamous cell carcinoma |
| HGIN: High-grade intraepithelial neoplasias | ||
| LGIN: Low-grade intraepithelial neoplasias |
| ∗log2FC in expression of this searched gene in stem-like cells from each diseased tissue sample relative to stem-like cells in normal samples in each tissue plotted against the malignancy continuum. Samples are colored based on if they are from different disease stage. |
Top |
Malignant transformation related pathway analysis |
| Find out the enriched GO biological processes and KEGG pathways involved in transition from healthy to precancer to cancer |
| Tissue | Disease Stage | Enriched GO biological Processes |
| Colorectum | AD |  |
| Colorectum | SER |  |
| Colorectum | MSS |  |
| Colorectum | MSI-H |  |
| Colorectum | FAP |  |
| ∗Top 15 enriched GO BP terms are showed in the bar plot of each disease state in each tissue. Each row represents a significant GO biological process which is colored according to the -log10(p.adjust). |
| Page: 1 2 3 4 5 6 7 8 9 |
| GO ID | Tissue | Disease Stage | Description | Gene Ratio | Bg Ratio | pvalue | p.adjust | Count |
| Page: 1 |
| Pathway ID | Tissue | Disease Stage | Description | Gene Ratio | Bg Ratio | pvalue | p.adjust | qvalue | Count |
| Page: 1 |
Top |
Cell-cell communication analysis |
| Identification of potential cell-cell interactions between two cell types and their ligand-receptor pairs for different disease states |
| Ligand | Receptor | LRpair | Pathway | Tissue | Disease Stage |
| Page: 1 |
Top |
Single-cell gene regulatory network inference analysis |
| Find out the significant the regulons (TFs) and the target genes of each regulon across cell types for different disease states |
| TF | Cell Type | Tissue | Disease Stage | Target Gene | RSS | Regulon Activity |
| ∗The dot plots of a searched regulon are shown for all cell subpopulations in each disease state of each tissue based on the regulon specific score inferred using pySCENIC and by calculating the average expression. |
| Page: 1 |
Top |
Somatic mutation of malignant transformation related genes |
| Annotation of somatic variants for genes involved in malignant transformation |
| Hugo Symbol | Variant Class | Variant Classification | dbSNP RS | HGVSc | HGVSp | HGVSp Short | SWISSPROT | BIOTYPE | SIFT | PolyPhen | Tumor Sample Barcode | Tissue | Histology | Sex | Age | Stage | Therapy Types | Drugs | Outcome |
| CAPN5 | SNV | Missense_Mutation | rs782484868 | c.142N>A | p.Ala48Thr | p.A48T | O15484 | protein_coding | tolerated(0.58) | benign(0) | TCGA-VQ-A8PP-01 | Stomach | stomach adenocarcinoma | Male | >=65 | III/IV | Chemotherapy | fluorouracil | PD |
| Page: 1 2 3 4 5 6 7 8 9 |
Top |
Related drugs of malignant transformation related genes |
| Identification of chemicals and drugs interact with genes involved in malignant transfromation |
| (DGIdb 4.0) |
| Entrez ID | Symbol | Category | Interaction Types | Drug Claim Name | Drug Name | PMIDs |
| Page: 1 |

Copyright 2023-Present -The University of Texas Health Science Center at Houston |