
|
|||||
|
 | |
| |
| |
| |
| |
| |
|
Gene: AFTPH |
Gene summary for AFTPH |
| Gene information | Species | Human | Gene symbol | AFTPH | Gene ID | 54812 |
| Gene name | aftiphilin | |
| Gene Alias | Nbla10388 | |
| Cytomap | 2p14 | |
| Gene Type | protein-coding | GO ID | GO:0006810 | UniProtAcc | Q6ULP2 |
Top |
Malignant transformation analysis |
| Identification of the aberrant gene expression in precancerous and cancerous lesions by comparing the gene expression of stem-like cells in diseased tissues with normal stem cells |
| Entrez ID | Symbol | Replicates | Species | Organ | Tissue | Adj P-value | Log2FC | Malignancy |
| 54812 | AFTPH | HTA11_3410_2000001011 | Human | Colorectum | AD | 3.45e-15 | -5.89e-01 | 0.0155 |
| 54812 | AFTPH | HTA11_2487_2000001011 | Human | Colorectum | SER | 8.99e-05 | -4.88e-01 | -0.1808 |
| 54812 | AFTPH | HTA11_2951_2000001011 | Human | Colorectum | AD | 8.24e-05 | -7.37e-01 | 0.0216 |
| 54812 | AFTPH | HTA11_1938_2000001011 | Human | Colorectum | AD | 1.86e-02 | -4.72e-01 | -0.0811 |
| 54812 | AFTPH | HTA11_3361_2000001011 | Human | Colorectum | AD | 2.24e-04 | -5.24e-01 | -0.1207 |
| 54812 | AFTPH | HTA11_696_2000001011 | Human | Colorectum | AD | 4.07e-10 | -4.72e-01 | -0.1464 |
| 54812 | AFTPH | HTA11_866_2000001011 | Human | Colorectum | AD | 3.13e-13 | -5.01e-01 | -0.1001 |
| 54812 | AFTPH | HTA11_546_2000001011 | Human | Colorectum | AD | 3.18e-02 | -4.92e-01 | -0.0842 |
| 54812 | AFTPH | HTA11_7862_2000001011 | Human | Colorectum | AD | 3.18e-03 | -6.15e-01 | -0.0179 |
| 54812 | AFTPH | HTA11_866_3004761011 | Human | Colorectum | AD | 6.29e-10 | -5.20e-01 | 0.096 |
| 54812 | AFTPH | HTA11_8622_2000001021 | Human | Colorectum | SER | 3.44e-03 | -6.43e-01 | 0.0528 |
| 54812 | AFTPH | HTA11_10711_2000001011 | Human | Colorectum | AD | 1.99e-07 | -5.54e-01 | 0.0338 |
| 54812 | AFTPH | HTA11_7696_3000711011 | Human | Colorectum | AD | 9.13e-15 | -4.82e-01 | 0.0674 |
| 54812 | AFTPH | HTA11_6818_2000001021 | Human | Colorectum | AD | 4.81e-05 | -5.67e-01 | 0.0588 |
| 54812 | AFTPH | HTA11_99999970781_79442 | Human | Colorectum | MSS | 3.57e-10 | -5.04e-01 | 0.294 |
| 54812 | AFTPH | HTA11_99999971662_82457 | Human | Colorectum | MSS | 1.23e-07 | -4.47e-01 | 0.3859 |
| 54812 | AFTPH | HTA11_99999973899_84307 | Human | Colorectum | MSS | 1.63e-03 | -5.67e-01 | 0.2585 |
| 54812 | AFTPH | HTA11_99999974143_84620 | Human | Colorectum | MSS | 1.32e-19 | -5.83e-01 | 0.3005 |
| 54812 | AFTPH | A015-C-203 | Human | Colorectum | FAP | 1.15e-24 | -3.91e-01 | -0.1294 |
| 54812 | AFTPH | A015-C-204 | Human | Colorectum | FAP | 8.68e-10 | -3.48e-01 | -0.0228 |
| Page: 1 2 3 4 5 6 7 8 |
| Tissue | Expression Dynamics | Abbreviation |
| Colorectum (GSE201348) |  | FAP: Familial adenomatous polyposis |
| CRC: Colorectal cancer | ||
| Colorectum (HTA11) |  | AD: Adenomas |
| SER: Sessile serrated lesions | ||
| MSI-H: Microsatellite-high colorectal cancer | ||
| MSS: Microsatellite stable colorectal cancer | ||
| Esophagus |  | ESCC: Esophageal squamous cell carcinoma |
| HGIN: High-grade intraepithelial neoplasias | ||
| LGIN: Low-grade intraepithelial neoplasias | ||
| Liver | 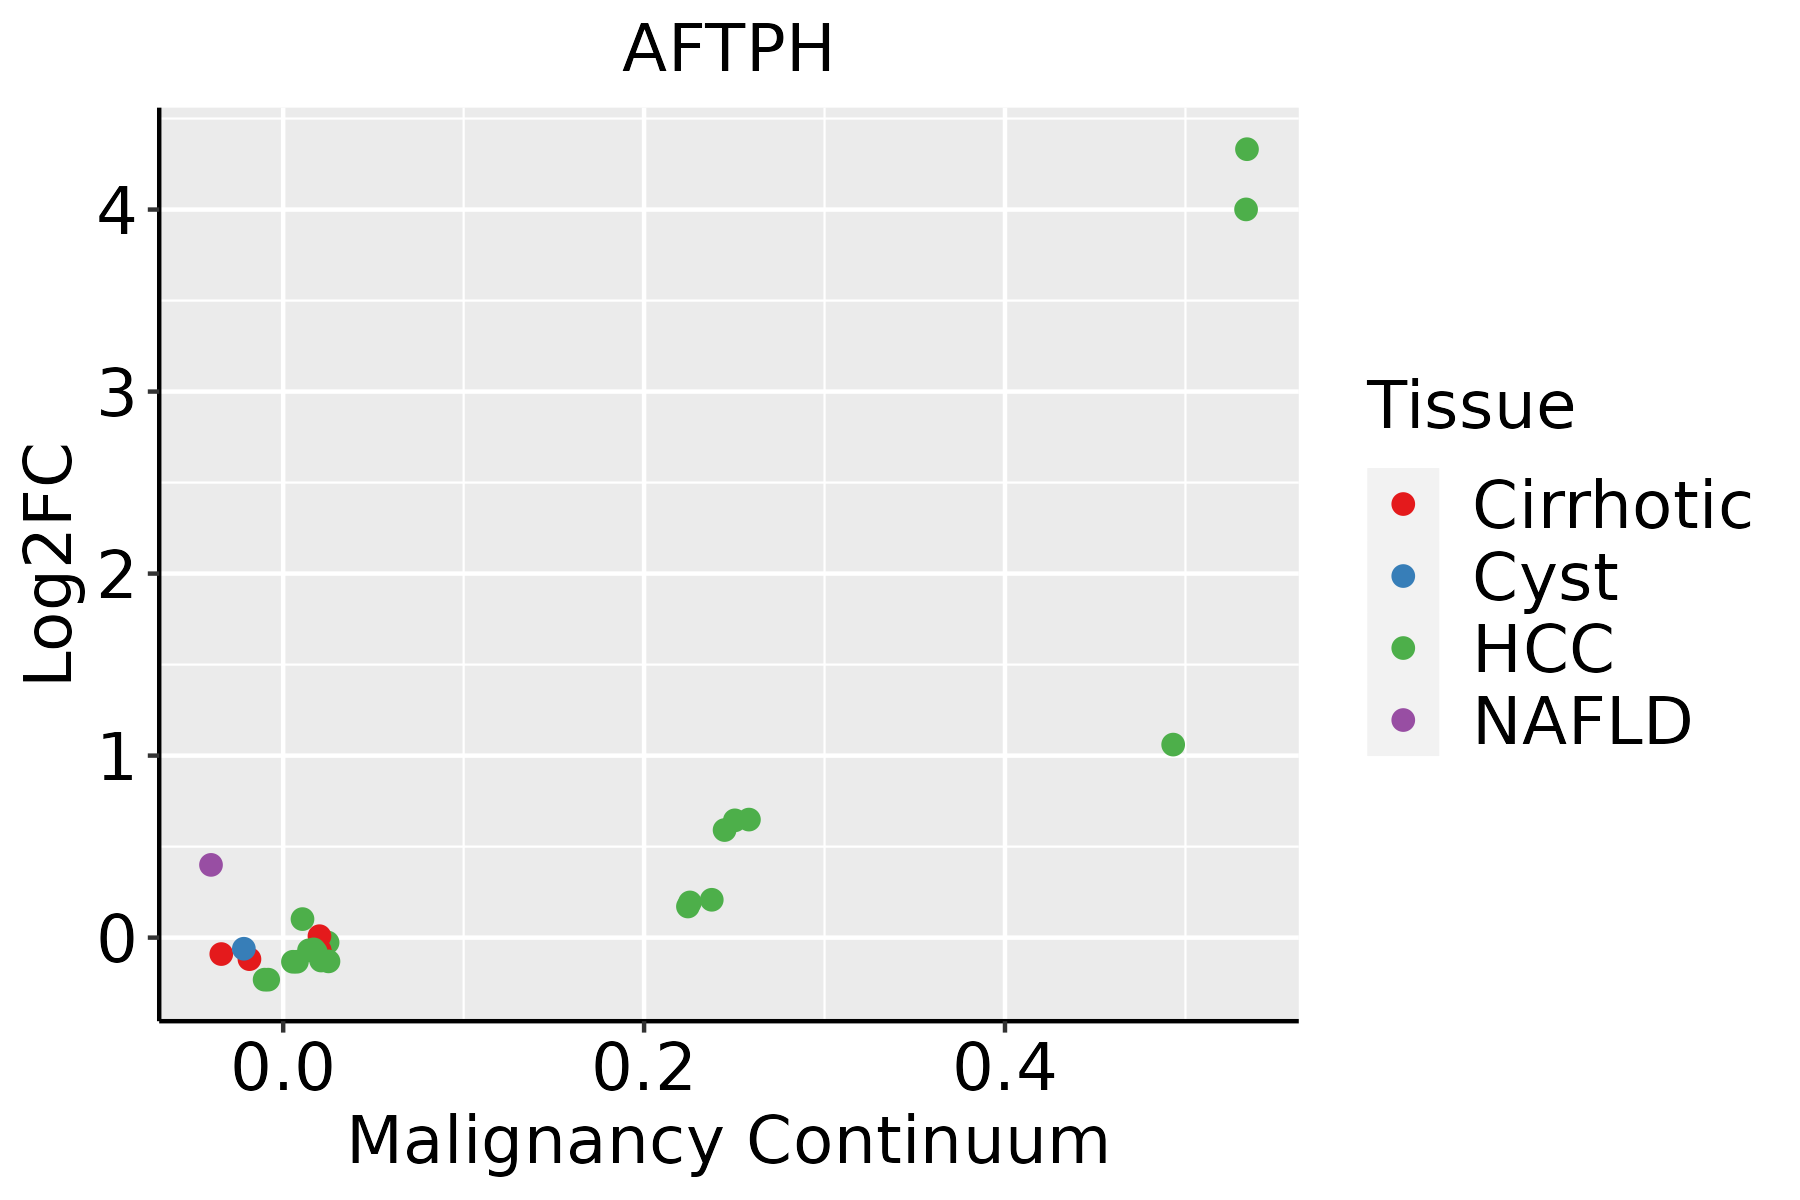 | HCC: Hepatocellular carcinoma |
| NAFLD: Non-alcoholic fatty liver disease | ||
| Oral Cavity | 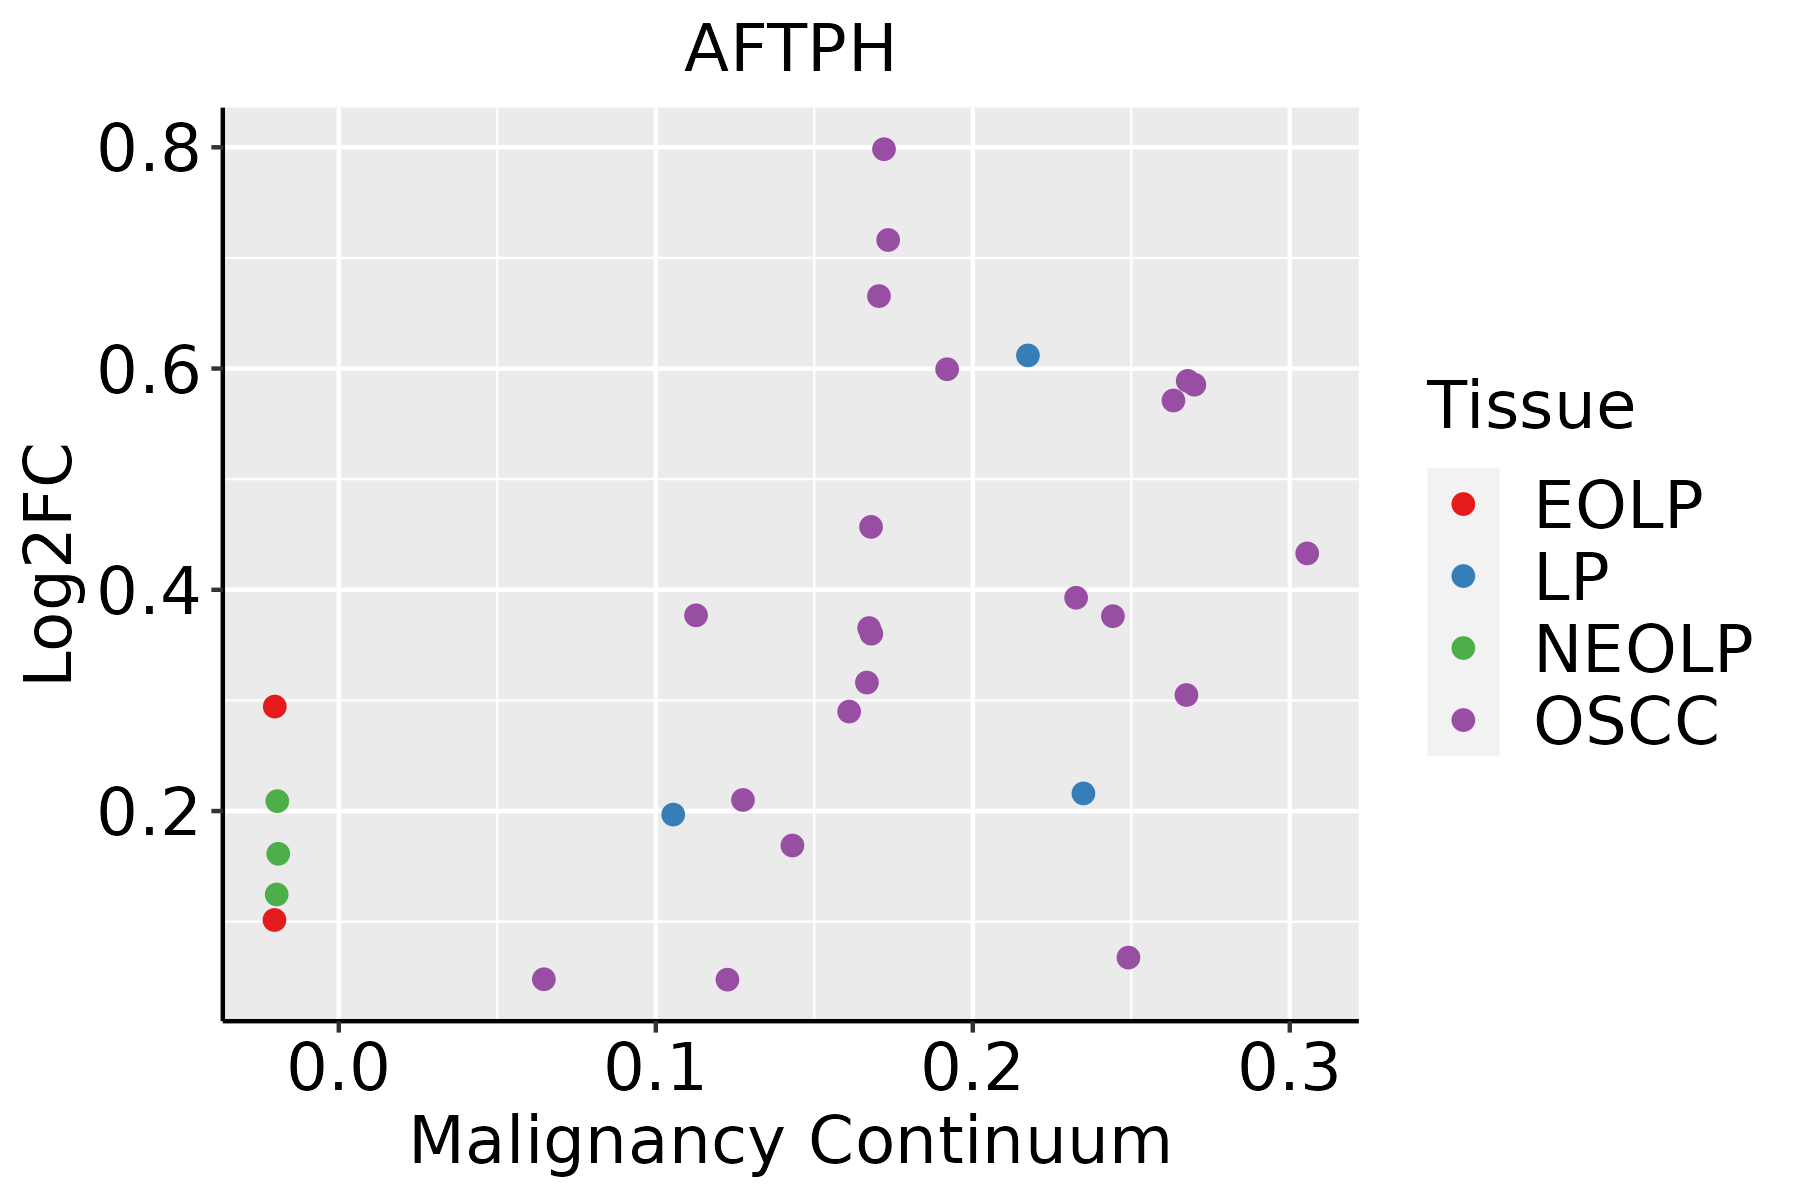 | EOLP: Erosive Oral lichen planus |
| LP: leukoplakia | ||
| NEOLP: Non-erosive oral lichen planus | ||
| OSCC: Oral squamous cell carcinoma | ||
| Prostate | 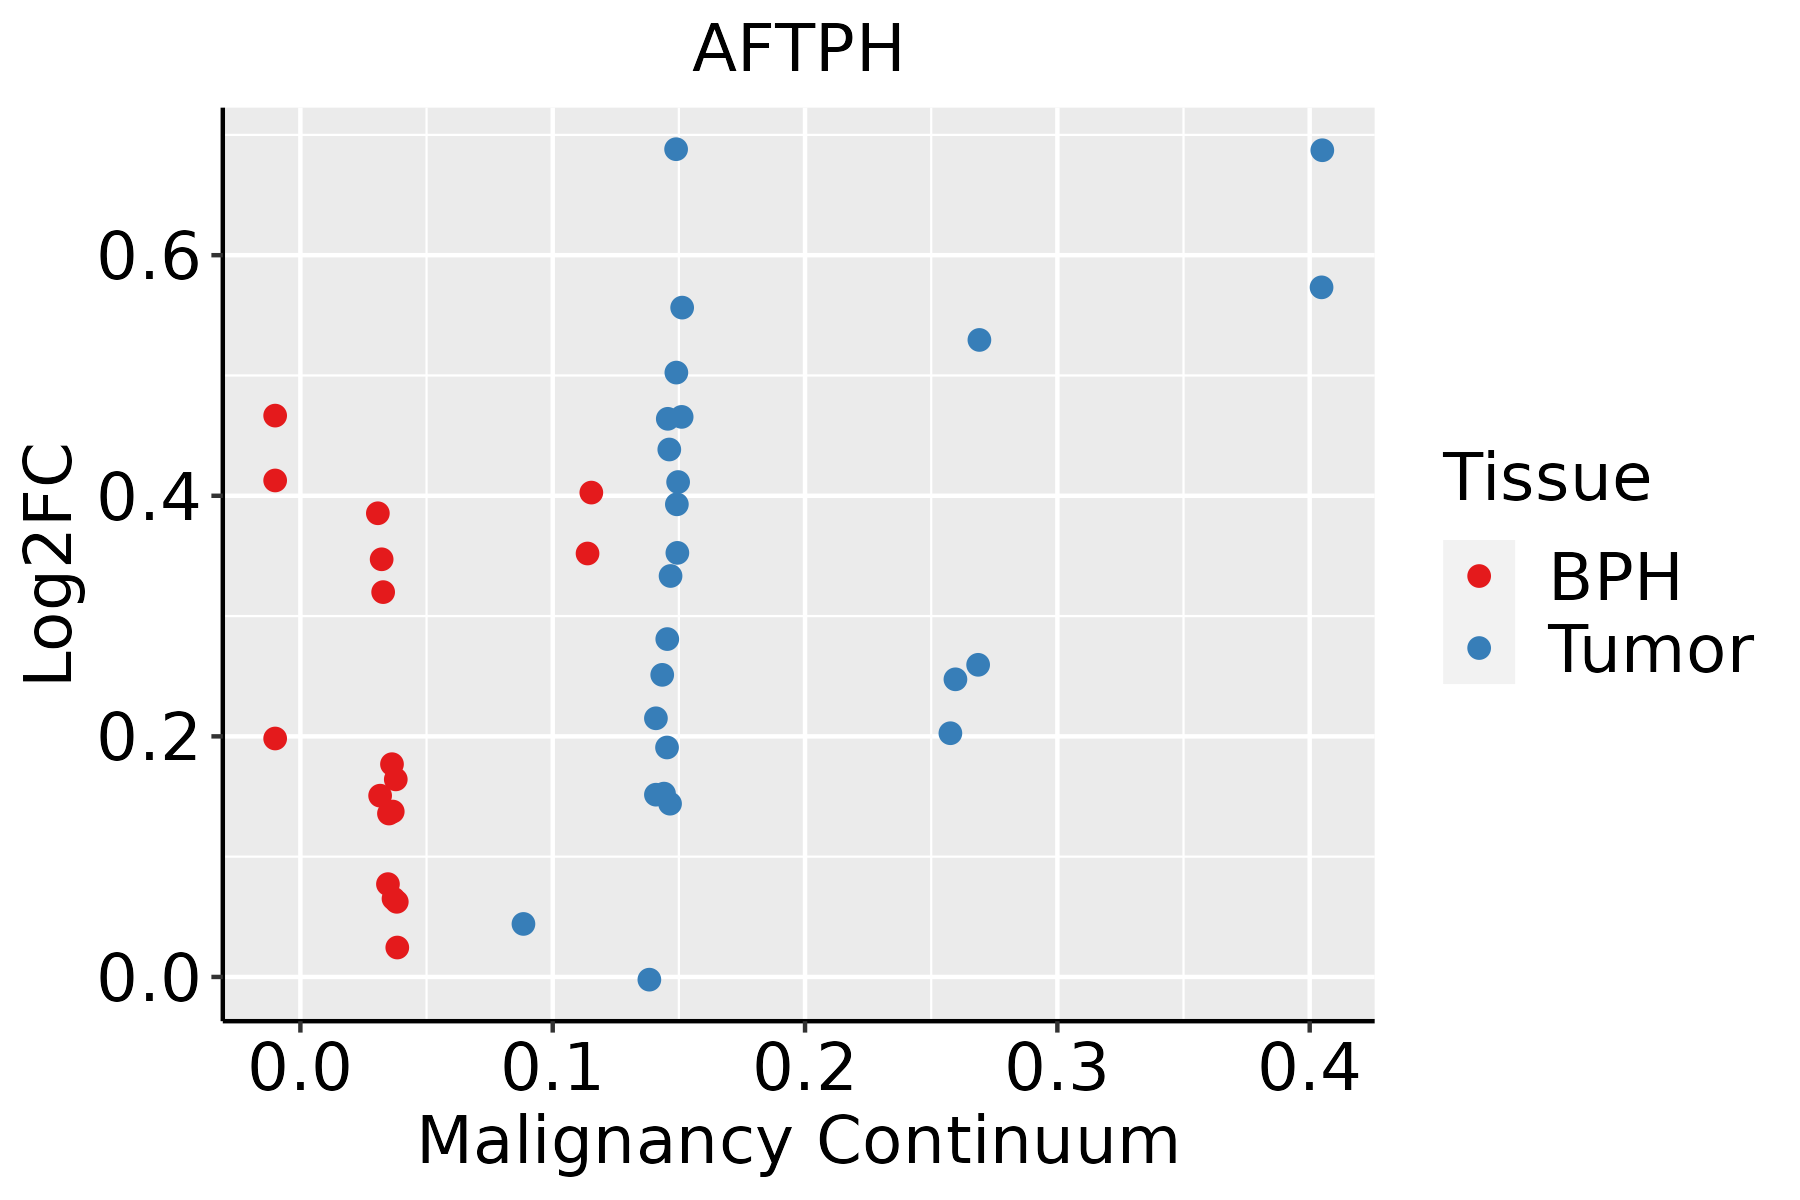 | BPH: Benign Prostatic Hyperplasia |
| ∗log2FC in expression of this searched gene in stem-like cells from each diseased tissue sample relative to stem-like cells in normal samples in each tissue plotted against the malignancy continuum. Samples are colored based on if they are from different disease stage. |
Top |
Malignant transformation related pathway analysis |
| Find out the enriched GO biological processes and KEGG pathways involved in transition from healthy to precancer to cancer |
| Tissue | Disease Stage | Enriched GO biological Processes |
| Colorectum | AD |  |
| Colorectum | SER |  |
| Colorectum | MSS |  |
| Colorectum | MSI-H |  |
| Colorectum | FAP |  |
| ∗Top 15 enriched GO BP terms are showed in the bar plot of each disease state in each tissue. Each row represents a significant GO biological process which is colored according to the -log10(p.adjust). |
| Page: 1 2 3 4 5 6 7 8 9 |
| GO ID | Tissue | Disease Stage | Description | Gene Ratio | Bg Ratio | pvalue | p.adjust | Count |
| Page: 1 |
| Pathway ID | Tissue | Disease Stage | Description | Gene Ratio | Bg Ratio | pvalue | p.adjust | qvalue | Count |
| Page: 1 |
Top |
Cell-cell communication analysis |
| Identification of potential cell-cell interactions between two cell types and their ligand-receptor pairs for different disease states |
| Ligand | Receptor | LRpair | Pathway | Tissue | Disease Stage |
| Page: 1 |
Top |
Single-cell gene regulatory network inference analysis |
| Find out the significant the regulons (TFs) and the target genes of each regulon across cell types for different disease states |
| TF | Cell Type | Tissue | Disease Stage | Target Gene | RSS | Regulon Activity |
| ∗The dot plots of a searched regulon are shown for all cell subpopulations in each disease state of each tissue based on the regulon specific score inferred using pySCENIC and by calculating the average expression. |
| Page: 1 |
Top |
Somatic mutation of malignant transformation related genes |
| Annotation of somatic variants for genes involved in malignant transformation |
| Hugo Symbol | Variant Class | Variant Classification | dbSNP RS | HGVSc | HGVSp | HGVSp Short | SWISSPROT | BIOTYPE | SIFT | PolyPhen | Tumor Sample Barcode | Tissue | Histology | Sex | Age | Stage | Therapy Types | Drugs | Outcome |
| AFTPH | insertion | Frame_Shift_Ins | novel | c.758_759insGATG | p.Asn254MetfsTer3 | p.N254Mfs*3 | Q6ULP2 | protein_coding | TCGA-FY-A4B0-01 | Thyroid | thyroid carcinoma | Male | >=65 | I/II | Hormone Therapy | synthroid | SD | ||
| AFTPH | insertion | Frame_Shift_Ins | novel | c.760_761insCAAC | p.Asn254ThrfsTer3 | p.N254Tfs*3 | Q6ULP2 | protein_coding | TCGA-FY-A4B0-01 | Thyroid | thyroid carcinoma | Male | >=65 | I/II | Hormone Therapy | synthroid | SD | ||
| AFTPH | insertion | Frame_Shift_Ins | novel | c.1041_1042insCTTTTAC | p.Arg348LeufsTer8 | p.R348Lfs*8 | Q6ULP2 | protein_coding | TCGA-FY-A4B0-01 | Thyroid | thyroid carcinoma | Male | >=65 | I/II | Hormone Therapy | synthroid | SD | ||
| AFTPH | insertion | Nonsense_Mutation | novel | c.2640_2641insTAAACTCCACTTTTTG | p.Glu881Ter | p.E881* | Q6ULP2 | protein_coding | TCGA-FY-A4B0-01 | Thyroid | thyroid carcinoma | Male | >=65 | I/II | Hormone Therapy | synthroid | SD |
| Page: 1 2 3 4 5 6 7 8 9 |
Top |
Related drugs of malignant transformation related genes |
| Identification of chemicals and drugs interact with genes involved in malignant transfromation |
| (DGIdb 4.0) |
| Entrez ID | Symbol | Category | Interaction Types | Drug Claim Name | Drug Name | PMIDs |
| Page: 1 |

Copyright 2023-Present -The University of Texas Health Science Center at Houston |