
|
|||||
|
 | |
| |
| |
| |
| |
| |
|
Gene: VPS52 |
Gene summary for VPS52 |
| Gene information | Species | Human | Gene symbol | VPS52 | Gene ID | 6293 |
| Gene name | VPS52 subunit of GARP complex | |
| Gene Alias | ARE1 | |
| Cytomap | 6p21.32 | |
| Gene Type | protein-coding | GO ID | GO:0006810 | UniProtAcc | B4DS44 |
Top |
Malignant transformation analysis |
| Identification of the aberrant gene expression in precancerous and cancerous lesions by comparing the gene expression of stem-like cells in diseased tissues with normal stem cells |
| Entrez ID | Symbol | Replicates | Species | Organ | Tissue | Adj P-value | Log2FC | Malignancy |
| 6293 | VPS52 | LZE4T | Human | Esophagus | ESCC | 5.27e-06 | 1.89e-01 | 0.0811 |
| 6293 | VPS52 | LZE7T | Human | Esophagus | ESCC | 2.17e-05 | 3.14e-01 | 0.0667 |
| 6293 | VPS52 | LZE8T | Human | Esophagus | ESCC | 2.19e-05 | 1.58e-01 | 0.067 |
| 6293 | VPS52 | LZE20T | Human | Esophagus | ESCC | 2.64e-08 | 3.08e-01 | 0.0662 |
| 6293 | VPS52 | LZE22T | Human | Esophagus | ESCC | 1.98e-04 | 2.82e-01 | 0.068 |
| 6293 | VPS52 | LZE24T | Human | Esophagus | ESCC | 1.75e-06 | 1.92e-01 | 0.0596 |
| 6293 | VPS52 | LZE21T | Human | Esophagus | ESCC | 1.62e-04 | 2.46e-01 | 0.0655 |
| 6293 | VPS52 | P1T-E | Human | Esophagus | ESCC | 1.21e-06 | 2.77e-01 | 0.0875 |
| 6293 | VPS52 | P2T-E | Human | Esophagus | ESCC | 4.75e-22 | 4.24e-01 | 0.1177 |
| 6293 | VPS52 | P4T-E | Human | Esophagus | ESCC | 7.72e-09 | 2.13e-01 | 0.1323 |
| 6293 | VPS52 | P5T-E | Human | Esophagus | ESCC | 1.14e-06 | 1.34e-01 | 0.1327 |
| 6293 | VPS52 | P8T-E | Human | Esophagus | ESCC | 2.60e-12 | 2.34e-01 | 0.0889 |
| 6293 | VPS52 | P9T-E | Human | Esophagus | ESCC | 4.05e-10 | 1.74e-01 | 0.1131 |
| 6293 | VPS52 | P10T-E | Human | Esophagus | ESCC | 3.30e-10 | 2.02e-01 | 0.116 |
| 6293 | VPS52 | P11T-E | Human | Esophagus | ESCC | 1.82e-10 | 4.12e-01 | 0.1426 |
| 6293 | VPS52 | P12T-E | Human | Esophagus | ESCC | 5.90e-16 | 3.68e-01 | 0.1122 |
| 6293 | VPS52 | P15T-E | Human | Esophagus | ESCC | 1.05e-14 | 2.77e-01 | 0.1149 |
| 6293 | VPS52 | P16T-E | Human | Esophagus | ESCC | 5.30e-25 | 4.55e-01 | 0.1153 |
| 6293 | VPS52 | P17T-E | Human | Esophagus | ESCC | 3.16e-03 | 2.46e-01 | 0.1278 |
| 6293 | VPS52 | P19T-E | Human | Esophagus | ESCC | 2.34e-05 | 4.38e-01 | 0.1662 |
| Page: 1 2 3 4 5 |
| Tissue | Expression Dynamics | Abbreviation |
| Esophagus | 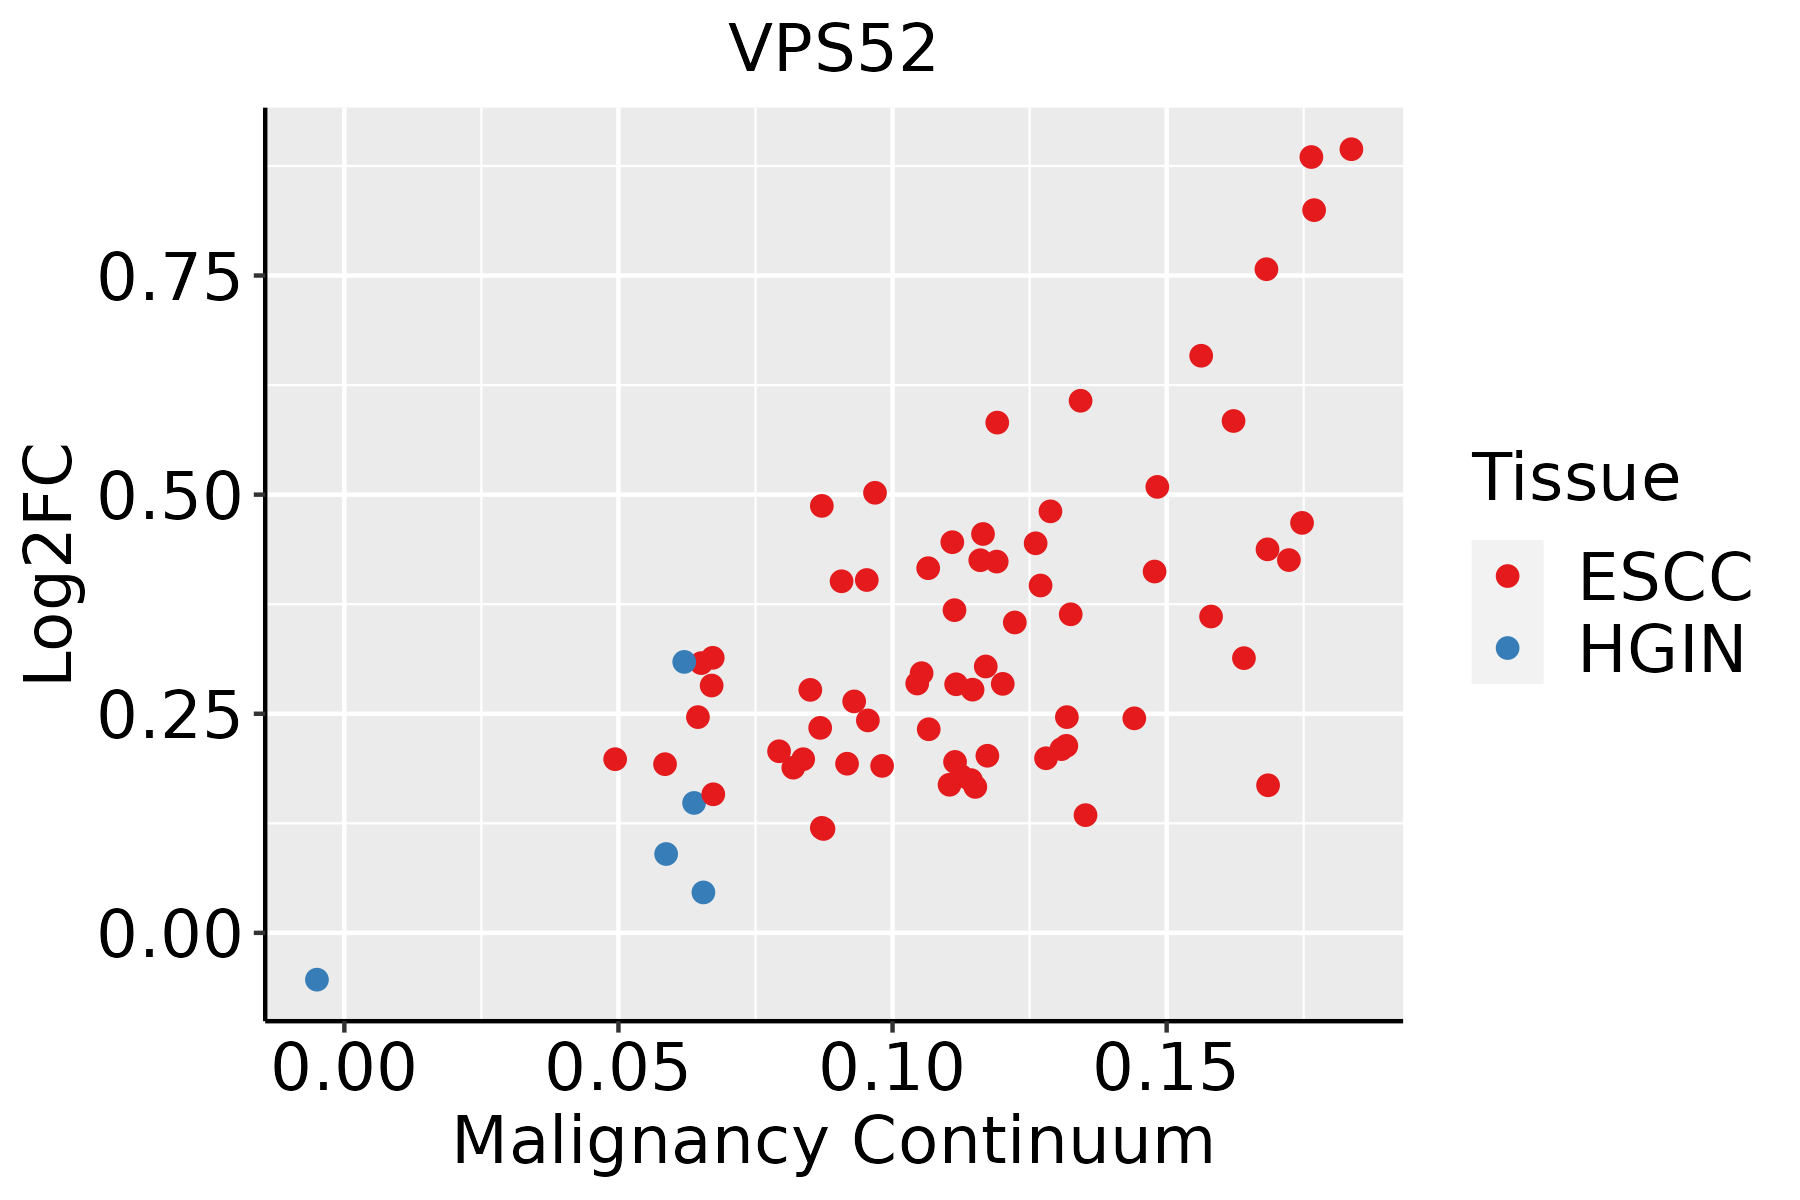 | ESCC: Esophageal squamous cell carcinoma |
| HGIN: High-grade intraepithelial neoplasias | ||
| LGIN: Low-grade intraepithelial neoplasias | ||
| Liver | 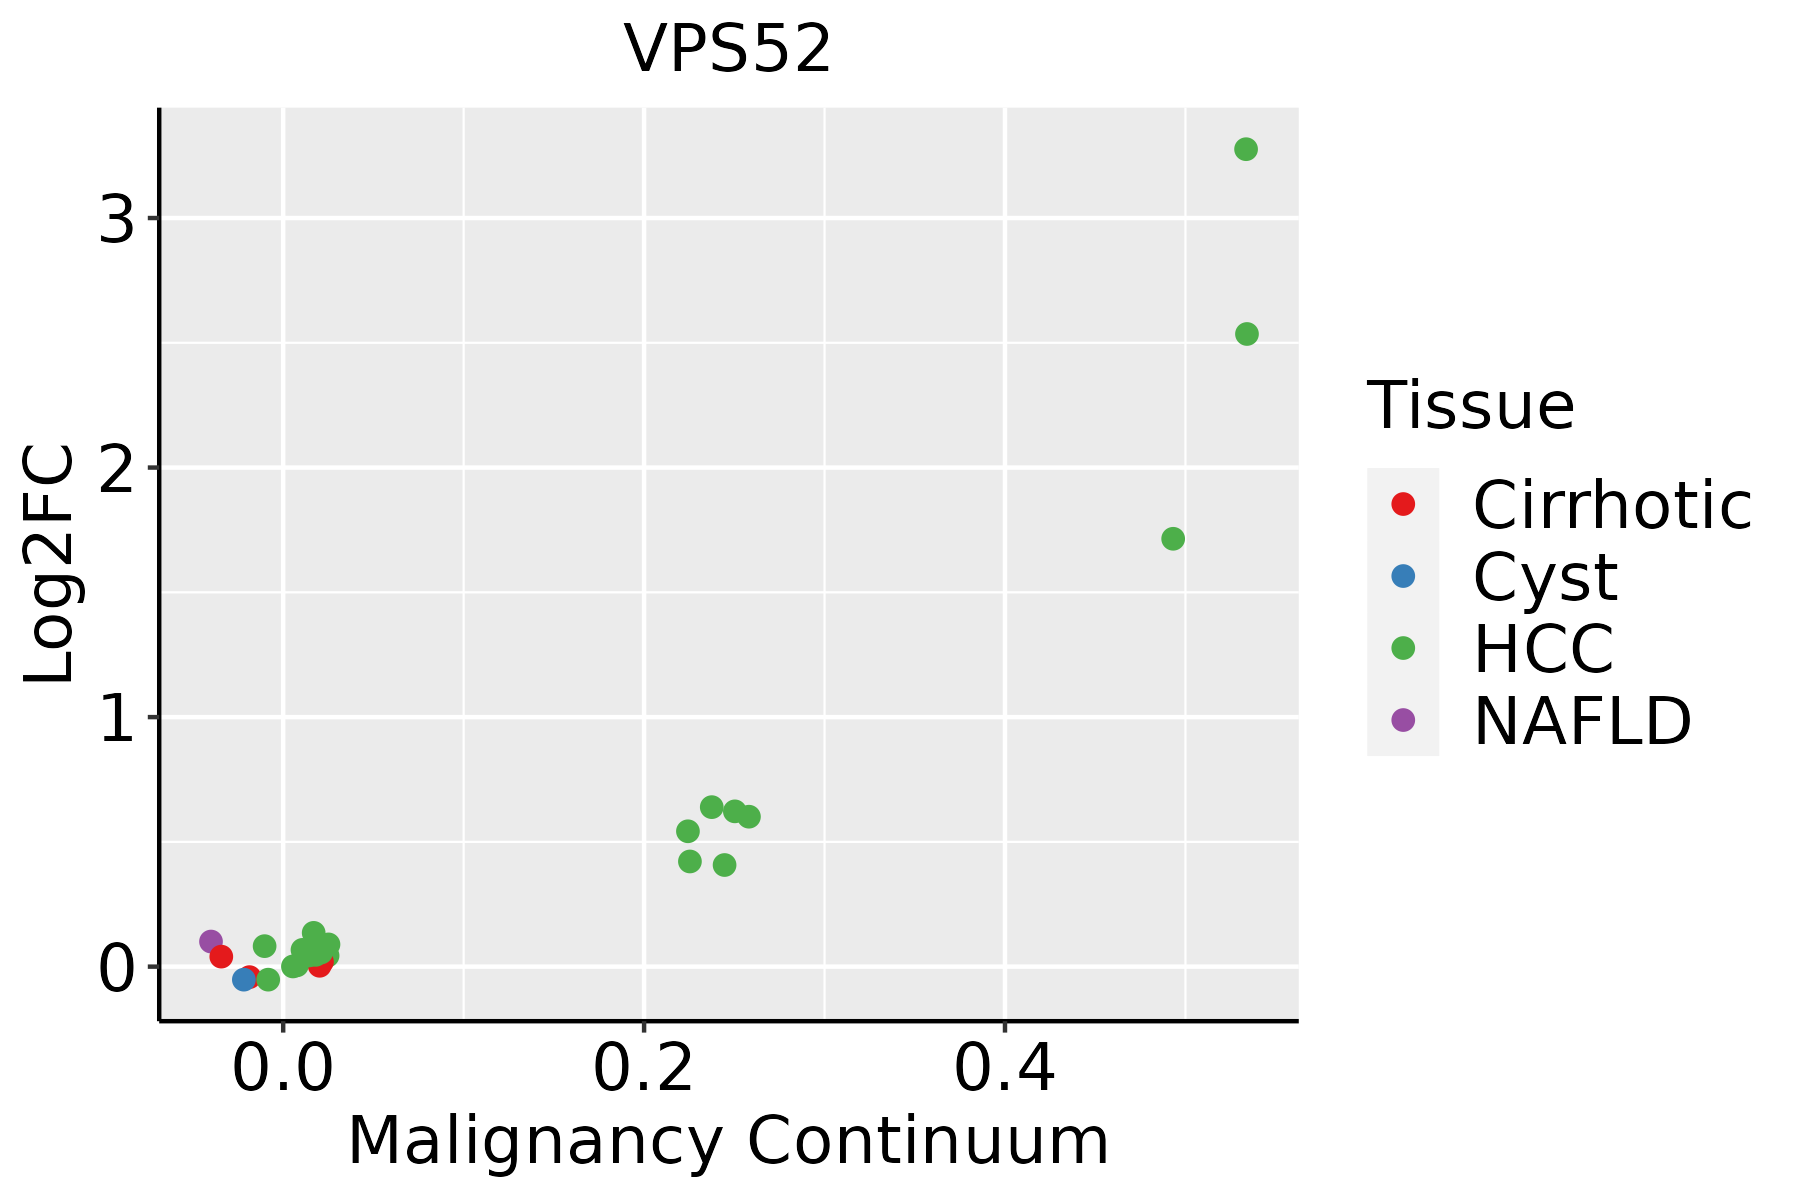 | HCC: Hepatocellular carcinoma |
| NAFLD: Non-alcoholic fatty liver disease | ||
| Oral Cavity |  | EOLP: Erosive Oral lichen planus |
| LP: leukoplakia | ||
| NEOLP: Non-erosive oral lichen planus | ||
| OSCC: Oral squamous cell carcinoma |
| ∗log2FC in expression of this searched gene in stem-like cells from each diseased tissue sample relative to stem-like cells in normal samples in each tissue plotted against the malignancy continuum. Samples are colored based on if they are from different disease stage. |
Top |
Malignant transformation related pathway analysis |
| Find out the enriched GO biological processes and KEGG pathways involved in transition from healthy to precancer to cancer |
| Tissue | Disease Stage | Enriched GO biological Processes |
| Colorectum | AD |  |
| Colorectum | SER |  |
| Colorectum | MSS |  |
| Colorectum | MSI-H |  |
| Colorectum | FAP |  |
| ∗Top 15 enriched GO BP terms are showed in the bar plot of each disease state in each tissue. Each row represents a significant GO biological process which is colored according to the -log10(p.adjust). |
| Page: 1 2 3 4 5 6 7 8 9 |
| GO ID | Tissue | Disease Stage | Description | Gene Ratio | Bg Ratio | pvalue | p.adjust | Count |
| GO:004819318 | Esophagus | ESCC | Golgi vesicle transport | 231/8552 | 296/18723 | 1.82e-30 | 9.63e-28 | 231 |
| GO:001619715 | Esophagus | ESCC | endosomal transport | 168/8552 | 230/18723 | 2.28e-17 | 1.93e-15 | 168 |
| GO:000703417 | Esophagus | ESCC | vacuolar transport | 119/8552 | 157/18723 | 1.16e-14 | 6.30e-13 | 119 |
| GO:001648210 | Esophagus | ESCC | cytosolic transport | 124/8552 | 168/18723 | 9.69e-14 | 4.69e-12 | 124 |
| GO:000689215 | Esophagus | ESCC | post-Golgi vesicle-mediated transport | 82/8552 | 104/18723 | 4.00e-12 | 1.55e-10 | 82 |
| GO:009887615 | Esophagus | ESCC | vesicle-mediated transport to the plasma membrane | 99/8552 | 136/18723 | 1.13e-10 | 3.39e-09 | 99 |
| GO:00070419 | Esophagus | ESCC | lysosomal transport | 83/8552 | 114/18723 | 3.52e-09 | 7.41e-08 | 83 |
| GO:00421477 | Esophagus | ESCC | retrograde transport, endosome to Golgi | 63/8552 | 91/18723 | 4.58e-06 | 4.87e-05 | 63 |
| GO:00324565 | Esophagus | ESCC | endocytic recycling | 51/8552 | 73/18723 | 2.47e-05 | 2.10e-04 | 51 |
| GO:00485687 | Esophagus | ESCC | embryonic organ development | 228/8552 | 427/18723 | 7.28e-04 | 3.79e-03 | 228 |
| GO:00068963 | Esophagus | ESCC | Golgi to vacuole transport | 16/8552 | 20/18723 | 1.85e-03 | 8.40e-03 | 16 |
| GO:004819321 | Liver | HCC | Golgi vesicle transport | 217/7958 | 296/18723 | 2.58e-27 | 1.02e-24 | 217 |
| GO:001619721 | Liver | HCC | endosomal transport | 154/7958 | 230/18723 | 4.74e-14 | 2.95e-12 | 154 |
| GO:001648221 | Liver | HCC | cytosolic transport | 117/7958 | 168/18723 | 8.83e-13 | 4.48e-11 | 117 |
| GO:000703421 | Liver | HCC | vacuolar transport | 108/7958 | 157/18723 | 2.22e-11 | 8.69e-10 | 108 |
| GO:000689221 | Liver | HCC | post-Golgi vesicle-mediated transport | 77/7958 | 104/18723 | 6.14e-11 | 2.24e-09 | 77 |
| GO:009887621 | Liver | HCC | vesicle-mediated transport to the plasma membrane | 92/7958 | 136/18723 | 2.57e-09 | 7.07e-08 | 92 |
| GO:000704121 | Liver | HCC | lysosomal transport | 76/7958 | 114/18723 | 1.56e-07 | 2.88e-06 | 76 |
| GO:004214721 | Liver | HCC | retrograde transport, endosome to Golgi | 61/7958 | 91/18723 | 1.94e-06 | 2.68e-05 | 61 |
| GO:00324562 | Liver | HCC | endocytic recycling | 48/7958 | 73/18723 | 5.07e-05 | 4.83e-04 | 48 |
| Page: 1 2 |
| Pathway ID | Tissue | Disease Stage | Description | Gene Ratio | Bg Ratio | pvalue | p.adjust | qvalue | Count |
| Page: 1 |
Top |
Cell-cell communication analysis |
| Identification of potential cell-cell interactions between two cell types and their ligand-receptor pairs for different disease states |
| Ligand | Receptor | LRpair | Pathway | Tissue | Disease Stage |
| Page: 1 |
Top |
Single-cell gene regulatory network inference analysis |
| Find out the significant the regulons (TFs) and the target genes of each regulon across cell types for different disease states |
| TF | Cell Type | Tissue | Disease Stage | Target Gene | RSS | Regulon Activity |
| ∗The dot plots of a searched regulon are shown for all cell subpopulations in each disease state of each tissue based on the regulon specific score inferred using pySCENIC and by calculating the average expression. |
| Page: 1 |
Top |
Somatic mutation of malignant transformation related genes |
| Annotation of somatic variants for genes involved in malignant transformation |
| Hugo Symbol | Variant Class | Variant Classification | dbSNP RS | HGVSc | HGVSp | HGVSp Short | SWISSPROT | BIOTYPE | SIFT | PolyPhen | Tumor Sample Barcode | Tissue | Histology | Sex | Age | Stage | Therapy Types | Drugs | Outcome |
| VPS52 | SNV | Missense_Mutation | c.1310G>A | p.Cys437Tyr | p.C437Y | Q8N1B4 | protein_coding | deleterious(0.01) | probably_damaging(0.99) | TCGA-DJ-A1QQ-01 | Thyroid | thyroid carcinoma | Male | <65 | I/II | Unknown | Unknown | SD | |
| VPS52 | SNV | Missense_Mutation | novel | c.1733N>T | p.Arg578Leu | p.R578L | Q8N1B4 | protein_coding | deleterious(0) | probably_damaging(0.958) | TCGA-EM-A2CJ-01 | Thyroid | thyroid carcinoma | Female | <65 | I/II | Unknown | Unknown | SD |
| VPS52 | SNV | Missense_Mutation | rs745922747 | c.86N>A | p.Pro29Gln | p.P29Q | Q8N1B4 | protein_coding | tolerated_low_confidence(0.05) | benign(0.162) | TCGA-EM-A2CM-01 | Thyroid | thyroid carcinoma | Female | <65 | III/IV | Unknown | Unknown | SD |
| Page: 1 2 3 4 5 6 7 8 |
Top |
Related drugs of malignant transformation related genes |
| Identification of chemicals and drugs interact with genes involved in malignant transfromation |
| (DGIdb 4.0) |
| Entrez ID | Symbol | Category | Interaction Types | Drug Claim Name | Drug Name | PMIDs |
| Page: 1 |

Copyright 2023-Present -The University of Texas Health Science Center at Houston |