
|
|||||
|
 | |
| |
| |
| |
| |
| |
|
Gene: TESK2 |
Gene summary for TESK2 |
| Gene information | Species | Human | Gene symbol | TESK2 | Gene ID | 10420 |
| Gene name | testis associated actin remodelling kinase 2 | |
| Gene Alias | TESK2 | |
| Cytomap | 1p34.1 | |
| Gene Type | protein-coding | GO ID | GO:0000003 | UniProtAcc | B4DFN2 |
Top |
Malignant transformation analysis |
| Identification of the aberrant gene expression in precancerous and cancerous lesions by comparing the gene expression of stem-like cells in diseased tissues with normal stem cells |
| Entrez ID | Symbol | Replicates | Species | Organ | Tissue | Adj P-value | Log2FC | Malignancy |
| 10420 | TESK2 | HTA11_347_2000001011 | Human | Colorectum | AD | 6.71e-18 | 7.55e-01 | -0.1954 |
| 10420 | TESK2 | HTA11_696_2000001011 | Human | Colorectum | AD | 2.92e-04 | 4.36e-01 | -0.1464 |
| 10420 | TESK2 | HTA11_5212_2000001011 | Human | Colorectum | AD | 4.78e-03 | 5.85e-01 | -0.2061 |
| 10420 | TESK2 | A015-C-203 | Human | Colorectum | FAP | 7.77e-06 | -9.82e-02 | -0.1294 |
| 10420 | TESK2 | A002-C-205 | Human | Colorectum | FAP | 1.16e-02 | -5.92e-02 | -0.1236 |
| 10420 | TESK2 | A015-C-006 | Human | Colorectum | FAP | 4.35e-02 | -2.21e-01 | -0.0994 |
| 10420 | TESK2 | A015-C-106 | Human | Colorectum | FAP | 2.62e-03 | -1.45e-01 | -0.0511 |
| 10420 | TESK2 | A002-C-114 | Human | Colorectum | FAP | 8.06e-04 | -2.36e-01 | -0.1561 |
| 10420 | TESK2 | A015-C-104 | Human | Colorectum | FAP | 2.08e-07 | -1.75e-01 | -0.1899 |
| 10420 | TESK2 | A001-C-014 | Human | Colorectum | FAP | 3.27e-02 | -1.74e-01 | 0.0135 |
| 10420 | TESK2 | A002-C-016 | Human | Colorectum | FAP | 2.51e-03 | -1.70e-01 | 0.0521 |
| 10420 | TESK2 | A002-C-116 | Human | Colorectum | FAP | 2.88e-05 | -1.32e-01 | -0.0452 |
| 10420 | TESK2 | F034 | Human | Colorectum | FAP | 4.46e-04 | -1.76e-01 | -0.0665 |
| 10420 | TESK2 | AEH-subject1 | Human | Endometrium | AEH | 5.52e-07 | 2.55e-01 | -0.3059 |
| 10420 | TESK2 | AEH-subject3 | Human | Endometrium | AEH | 2.98e-03 | 2.35e-01 | -0.2576 |
| 10420 | TESK2 | AEH-subject4 | Human | Endometrium | AEH | 2.17e-03 | 2.67e-01 | -0.2657 |
| 10420 | TESK2 | AEH-subject5 | Human | Endometrium | AEH | 3.15e-02 | 1.78e-01 | -0.2953 |
| 10420 | TESK2 | EEC-subject1 | Human | Endometrium | EEC | 6.76e-19 | 5.94e-01 | -0.2682 |
| 10420 | TESK2 | LZE4T | Human | Esophagus | ESCC | 7.13e-04 | 1.37e-01 | 0.0811 |
| 10420 | TESK2 | LZE20T | Human | Esophagus | ESCC | 4.90e-05 | 1.41e-01 | 0.0662 |
| Page: 1 2 3 4 |
| Tissue | Expression Dynamics | Abbreviation |
| Colorectum (GSE201348) |  | FAP: Familial adenomatous polyposis |
| CRC: Colorectal cancer | ||
| Colorectum (HTA11) |  | AD: Adenomas |
| SER: Sessile serrated lesions | ||
| MSI-H: Microsatellite-high colorectal cancer | ||
| MSS: Microsatellite stable colorectal cancer | ||
| Endometrium | 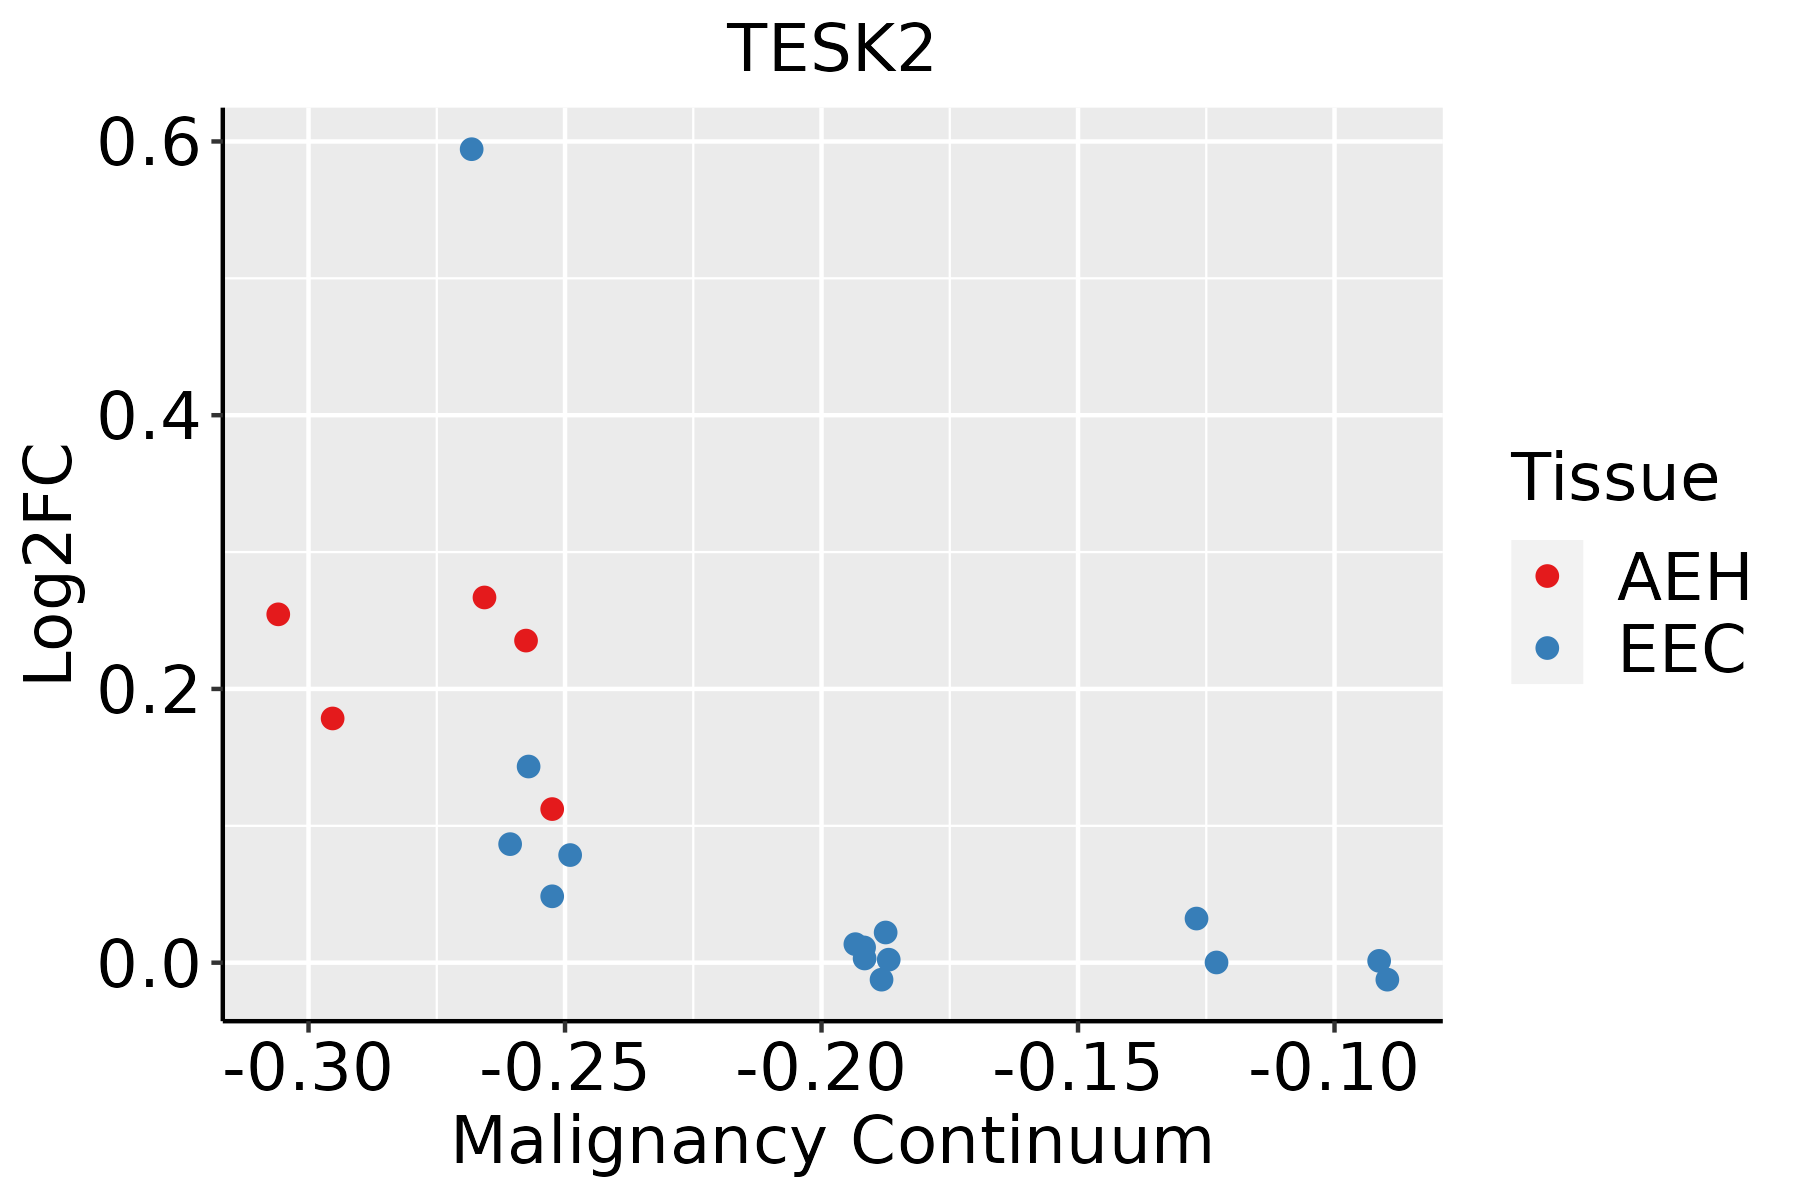 | AEH: Atypical endometrial hyperplasia |
| EEC: Endometrioid Cancer | ||
| Esophagus | 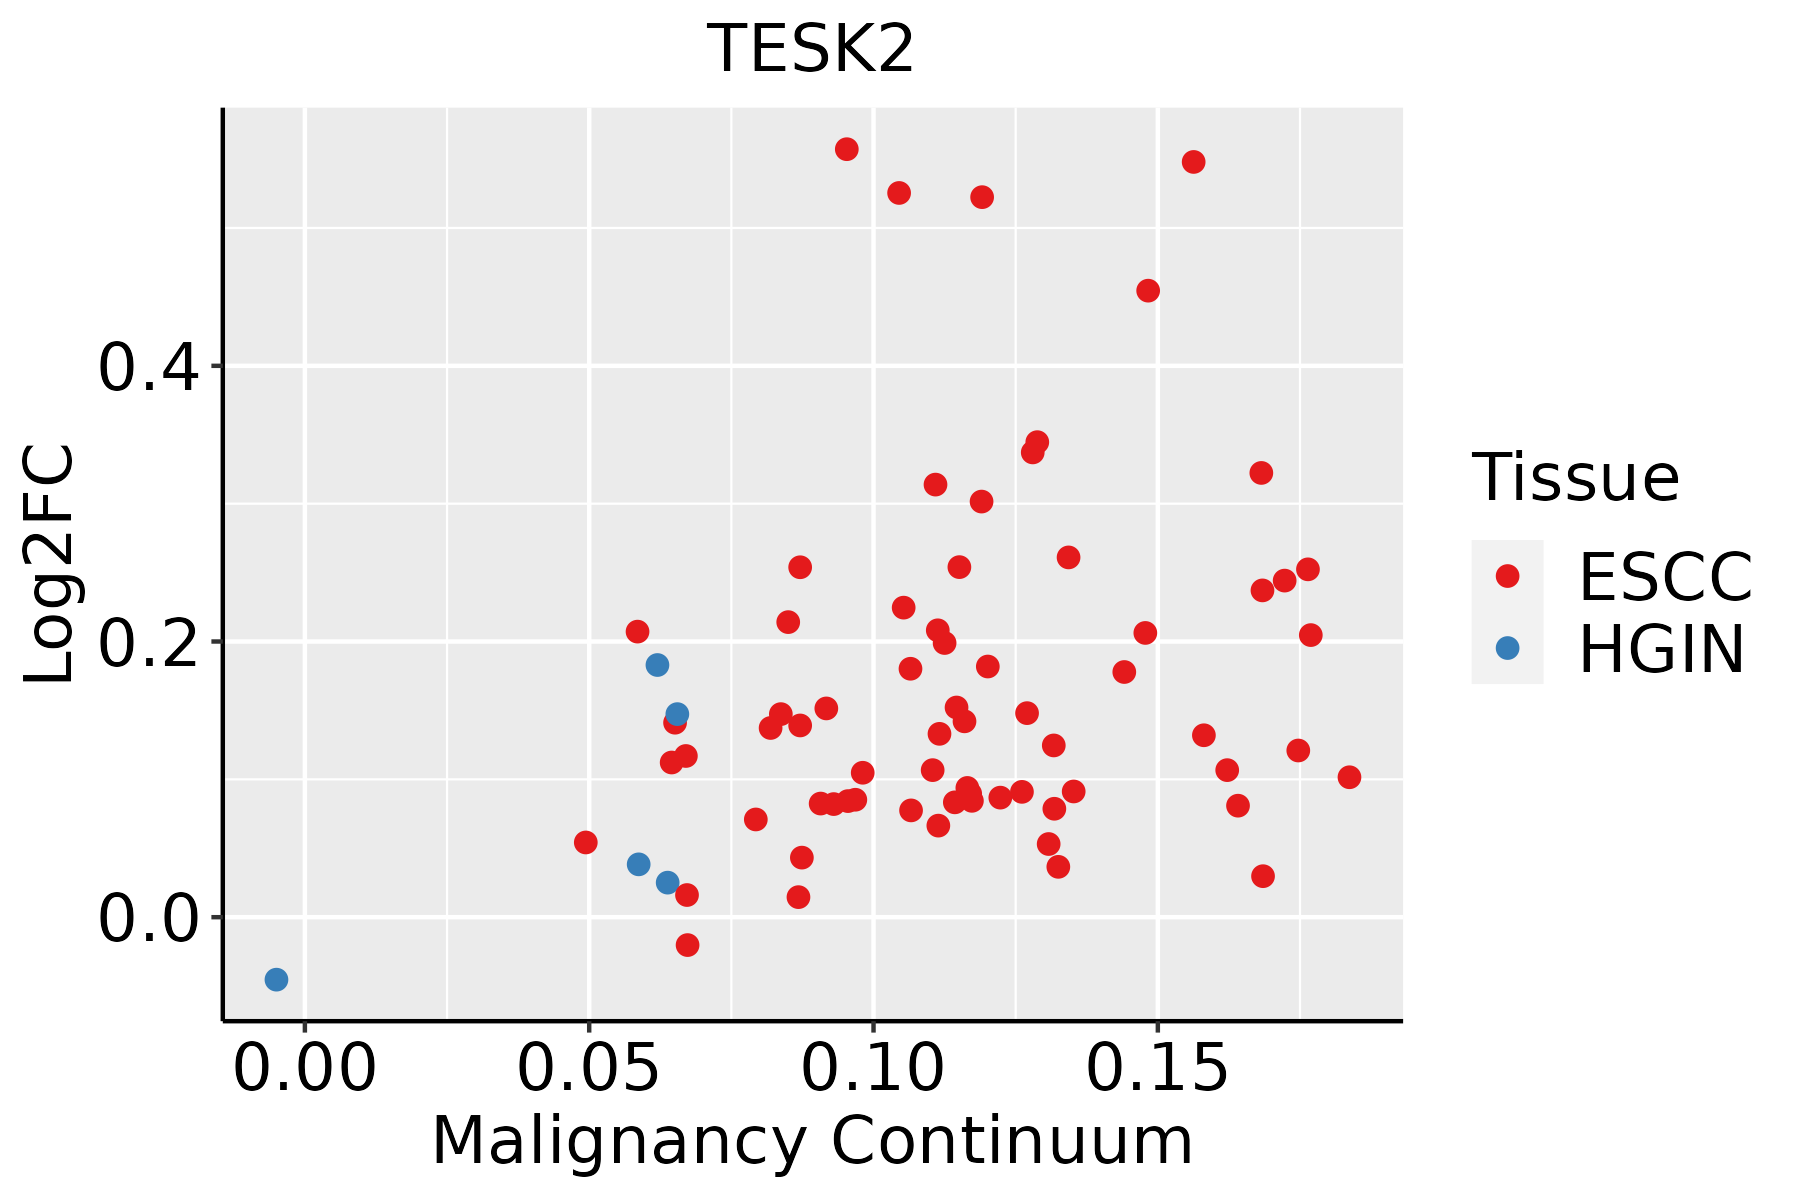 | ESCC: Esophageal squamous cell carcinoma |
| HGIN: High-grade intraepithelial neoplasias | ||
| LGIN: Low-grade intraepithelial neoplasias | ||
| Liver | 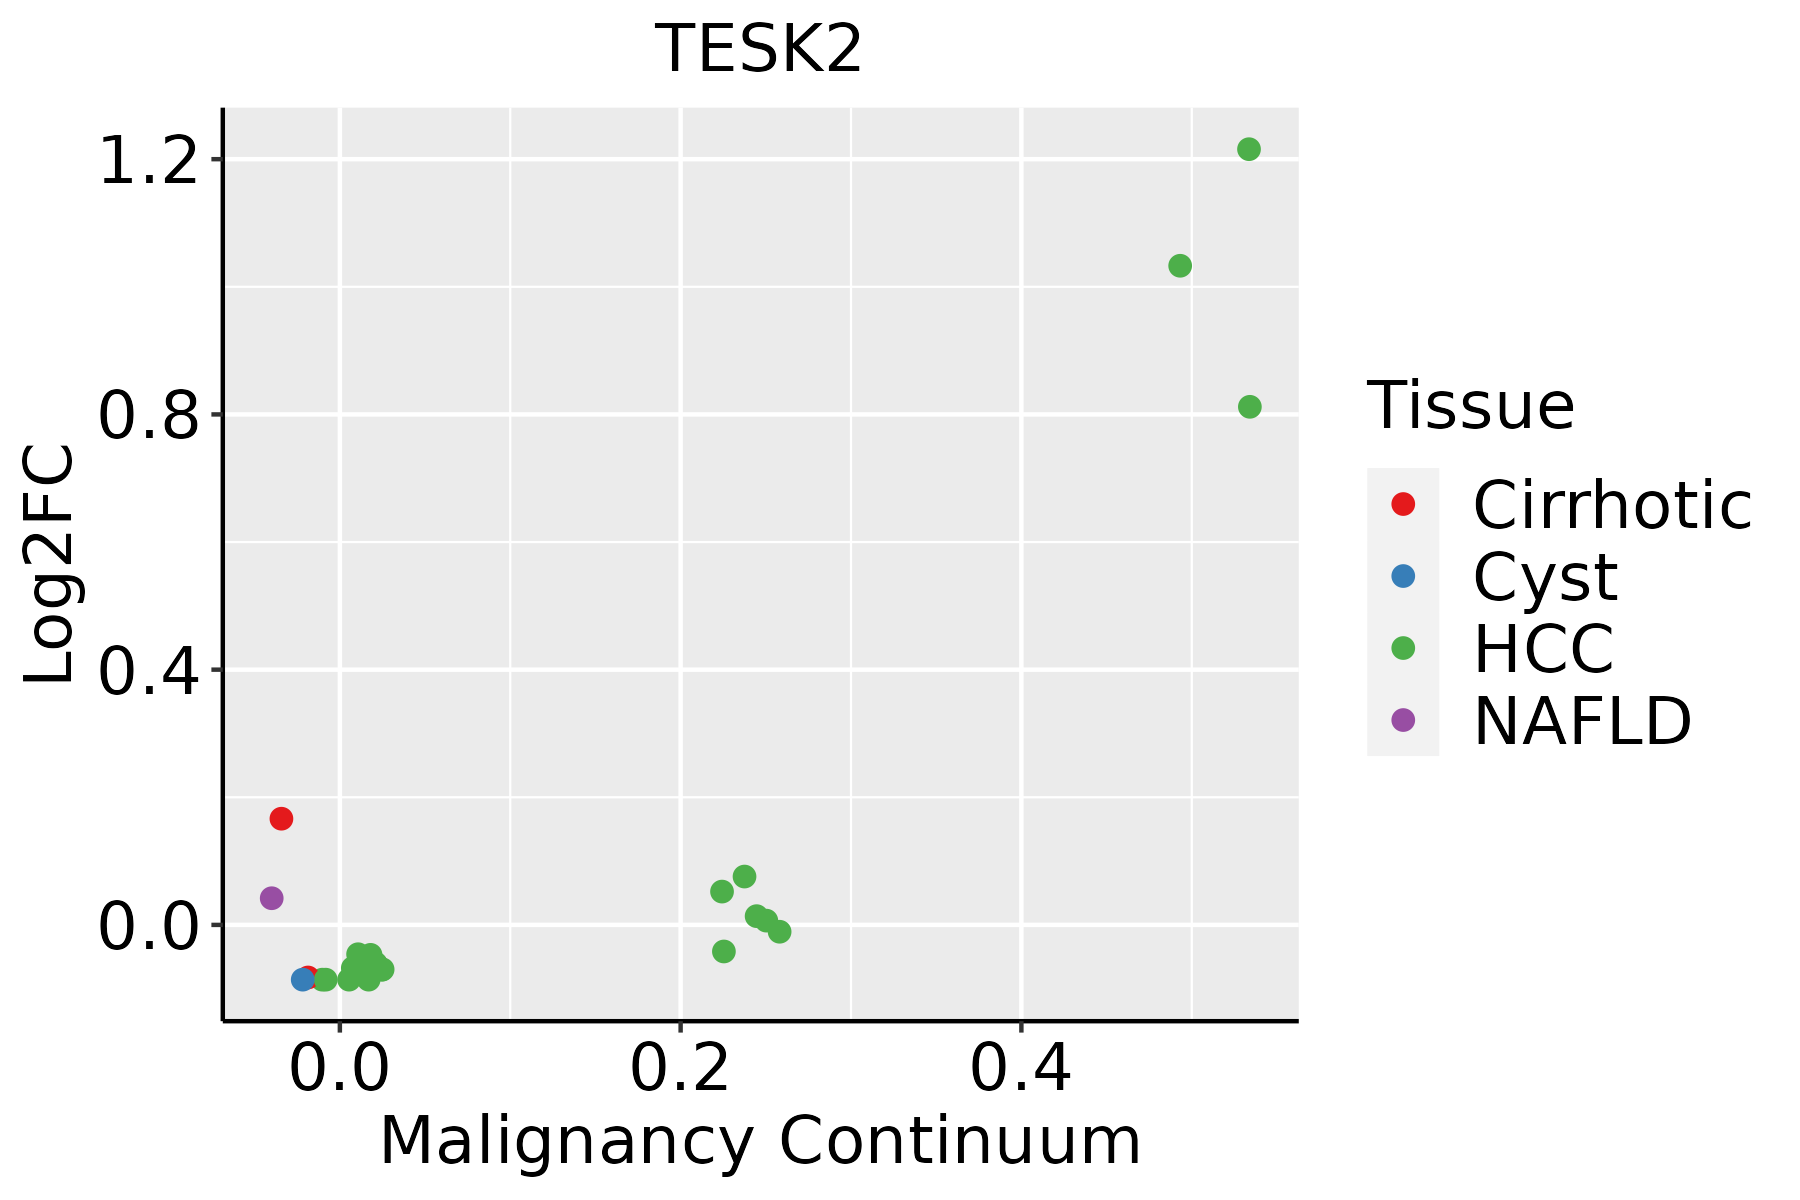 | HCC: Hepatocellular carcinoma |
| NAFLD: Non-alcoholic fatty liver disease |
| ∗log2FC in expression of this searched gene in stem-like cells from each diseased tissue sample relative to stem-like cells in normal samples in each tissue plotted against the malignancy continuum. Samples are colored based on if they are from different disease stage. |
Top |
Malignant transformation related pathway analysis |
| Find out the enriched GO biological processes and KEGG pathways involved in transition from healthy to precancer to cancer |
| Tissue | Disease Stage | Enriched GO biological Processes |
| Colorectum | AD |  |
| Colorectum | SER |  |
| Colorectum | MSS |  |
| Colorectum | MSI-H |  |
| Colorectum | FAP |  |
| ∗Top 15 enriched GO BP terms are showed in the bar plot of each disease state in each tissue. Each row represents a significant GO biological process which is colored according to the -log10(p.adjust). |
| Page: 1 2 3 4 5 6 7 8 9 |
| GO ID | Tissue | Disease Stage | Description | Gene Ratio | Bg Ratio | pvalue | p.adjust | Count |
| GO:0034329 | Colorectum | AD | cell junction assembly | 136/3918 | 420/18723 | 2.02e-08 | 1.15e-06 | 136 |
| GO:0150115 | Colorectum | AD | cell-substrate junction organization | 44/3918 | 101/18723 | 2.38e-07 | 9.81e-06 | 44 |
| GO:0031589 | Colorectum | AD | cell-substrate adhesion | 116/3918 | 363/18723 | 4.68e-07 | 1.76e-05 | 116 |
| GO:0007044 | Colorectum | AD | cell-substrate junction assembly | 41/3918 | 95/18723 | 8.20e-07 | 2.85e-05 | 41 |
| GO:0007160 | Colorectum | AD | cell-matrix adhesion | 75/3918 | 233/18723 | 3.56e-05 | 6.45e-04 | 75 |
| GO:0048041 | Colorectum | AD | focal adhesion assembly | 34/3918 | 87/18723 | 8.30e-05 | 1.30e-03 | 34 |
| GO:00343293 | Colorectum | FAP | cell junction assembly | 105/2622 | 420/18723 | 1.03e-09 | 2.18e-07 | 105 |
| GO:00315893 | Colorectum | FAP | cell-substrate adhesion | 93/2622 | 363/18723 | 2.48e-09 | 4.61e-07 | 93 |
| GO:00070443 | Colorectum | FAP | cell-substrate junction assembly | 36/2622 | 95/18723 | 6.03e-09 | 9.48e-07 | 36 |
| GO:01501153 | Colorectum | FAP | cell-substrate junction organization | 37/2622 | 101/18723 | 1.09e-08 | 1.33e-06 | 37 |
| GO:00071603 | Colorectum | FAP | cell-matrix adhesion | 63/2622 | 233/18723 | 1.13e-07 | 7.43e-06 | 63 |
| GO:00480413 | Colorectum | FAP | focal adhesion assembly | 31/2622 | 87/18723 | 3.40e-07 | 1.86e-05 | 31 |
| GO:00315899 | Endometrium | AEH | cell-substrate adhesion | 87/2100 | 363/18723 | 3.51e-12 | 5.70e-10 | 87 |
| GO:015011510 | Endometrium | AEH | cell-substrate junction organization | 31/2100 | 101/18723 | 1.01e-07 | 4.99e-06 | 31 |
| GO:00480418 | Endometrium | AEH | focal adhesion assembly | 28/2100 | 87/18723 | 1.36e-07 | 6.14e-06 | 28 |
| GO:00071609 | Endometrium | AEH | cell-matrix adhesion | 54/2100 | 233/18723 | 1.42e-07 | 6.37e-06 | 54 |
| GO:00070449 | Endometrium | AEH | cell-substrate junction assembly | 29/2100 | 95/18723 | 2.93e-07 | 1.28e-05 | 29 |
| GO:00343299 | Endometrium | AEH | cell junction assembly | 78/2100 | 420/18723 | 4.80e-06 | 1.24e-04 | 78 |
| GO:003158915 | Endometrium | EEC | cell-substrate adhesion | 87/2168 | 363/18723 | 1.95e-11 | 3.00e-09 | 87 |
| GO:015011514 | Endometrium | EEC | cell-substrate junction organization | 31/2168 | 101/18723 | 2.07e-07 | 9.20e-06 | 31 |
| Page: 1 2 |
| Pathway ID | Tissue | Disease Stage | Description | Gene Ratio | Bg Ratio | pvalue | p.adjust | qvalue | Count |
| Page: 1 |
Top |
Cell-cell communication analysis |
| Identification of potential cell-cell interactions between two cell types and their ligand-receptor pairs for different disease states |
| Ligand | Receptor | LRpair | Pathway | Tissue | Disease Stage |
| Page: 1 |
Top |
Single-cell gene regulatory network inference analysis |
| Find out the significant the regulons (TFs) and the target genes of each regulon across cell types for different disease states |
| TF | Cell Type | Tissue | Disease Stage | Target Gene | RSS | Regulon Activity |
| ∗The dot plots of a searched regulon are shown for all cell subpopulations in each disease state of each tissue based on the regulon specific score inferred using pySCENIC and by calculating the average expression. |
| Page: 1 |
Top |
Somatic mutation of malignant transformation related genes |
| Annotation of somatic variants for genes involved in malignant transformation |
| Hugo Symbol | Variant Class | Variant Classification | dbSNP RS | HGVSc | HGVSp | HGVSp Short | SWISSPROT | BIOTYPE | SIFT | PolyPhen | Tumor Sample Barcode | Tissue | Histology | Sex | Age | Stage | Therapy Types | Drugs | Outcome |
| TESK2 | insertion | In_Frame_Ins | novel | c.86_87insCTATCAACCTGC | p.Glu29delinsAspTyrGlnProAla | p.E29delinsDYQPA | Q96S53 | protein_coding | TCGA-IM-A41Z-01 | Thyroid | thyroid carcinoma | Female | <65 | I/II | Hormone Therapy | synthroid | SD |
| Page: 1 2 3 4 5 6 7 8 |
Top |
Related drugs of malignant transformation related genes |
| Identification of chemicals and drugs interact with genes involved in malignant transfromation |
| (DGIdb 4.0) |
| Entrez ID | Symbol | Category | Interaction Types | Drug Claim Name | Drug Name | PMIDs |
| 10420 | TESK2 | DRUGGABLE GENOME, KINASE, SERINE THREONINE KINASE, ENZYME, TYROSINE KINASE | inhibitor | 249565798 | ||
| 10420 | TESK2 | DRUGGABLE GENOME, KINASE, SERINE THREONINE KINASE, ENZYME, TYROSINE KINASE | inhibitor | 249565799 | ||
| 10420 | TESK2 | DRUGGABLE GENOME, KINASE, SERINE THREONINE KINASE, ENZYME, TYROSINE KINASE | inhibitor | 249565797 |
| Page: 1 |

Copyright 2023-Present -The University of Texas Health Science Center at Houston |