
|
|||||
|
 | |
| |
| |
| |
| |
| |
|
Gene: RNF139 |
Gene summary for RNF139 |
| Gene information | Species | Human | Gene symbol | RNF139 | Gene ID | 11236 |
| Gene name | ring finger protein 139 | |
| Gene Alias | HRCA1 | |
| Cytomap | 8q24.13 | |
| Gene Type | protein-coding | GO ID | GO:0006412 | UniProtAcc | Q8WU17 |
Top |
Malignant transformation analysis |
| Identification of the aberrant gene expression in precancerous and cancerous lesions by comparing the gene expression of stem-like cells in diseased tissues with normal stem cells |
| Entrez ID | Symbol | Replicates | Species | Organ | Tissue | Adj P-value | Log2FC | Malignancy |
| 11236 | RNF139 | LZE4T | Human | Esophagus | ESCC | 1.10e-05 | 1.26e-01 | 0.0811 |
| 11236 | RNF139 | LZE20T | Human | Esophagus | ESCC | 2.79e-05 | 1.47e-01 | 0.0662 |
| 11236 | RNF139 | LZE24T | Human | Esophagus | ESCC | 3.01e-12 | 2.96e-01 | 0.0596 |
| 11236 | RNF139 | LZE6T | Human | Esophagus | ESCC | 4.49e-02 | 3.35e-02 | 0.0845 |
| 11236 | RNF139 | P1T-E | Human | Esophagus | ESCC | 9.65e-05 | 2.44e-01 | 0.0875 |
| 11236 | RNF139 | P2T-E | Human | Esophagus | ESCC | 7.55e-29 | 4.21e-01 | 0.1177 |
| 11236 | RNF139 | P4T-E | Human | Esophagus | ESCC | 1.50e-17 | 3.58e-01 | 0.1323 |
| 11236 | RNF139 | P5T-E | Human | Esophagus | ESCC | 8.99e-29 | 3.25e-01 | 0.1327 |
| 11236 | RNF139 | P8T-E | Human | Esophagus | ESCC | 4.13e-10 | 9.82e-02 | 0.0889 |
| 11236 | RNF139 | P9T-E | Human | Esophagus | ESCC | 2.60e-13 | 3.03e-01 | 0.1131 |
| 11236 | RNF139 | P10T-E | Human | Esophagus | ESCC | 1.40e-22 | 1.49e-01 | 0.116 |
| 11236 | RNF139 | P11T-E | Human | Esophagus | ESCC | 1.74e-10 | 3.60e-01 | 0.1426 |
| 11236 | RNF139 | P12T-E | Human | Esophagus | ESCC | 3.42e-17 | 3.82e-01 | 0.1122 |
| 11236 | RNF139 | P15T-E | Human | Esophagus | ESCC | 1.83e-27 | 3.58e-01 | 0.1149 |
| 11236 | RNF139 | P16T-E | Human | Esophagus | ESCC | 7.98e-16 | 2.34e-01 | 0.1153 |
| 11236 | RNF139 | P17T-E | Human | Esophagus | ESCC | 2.22e-05 | 9.92e-02 | 0.1278 |
| 11236 | RNF139 | P20T-E | Human | Esophagus | ESCC | 1.12e-11 | 1.25e-01 | 0.1124 |
| 11236 | RNF139 | P21T-E | Human | Esophagus | ESCC | 3.79e-17 | 2.19e-01 | 0.1617 |
| 11236 | RNF139 | P22T-E | Human | Esophagus | ESCC | 3.23e-13 | 8.68e-02 | 0.1236 |
| 11236 | RNF139 | P23T-E | Human | Esophagus | ESCC | 5.14e-14 | 5.13e-01 | 0.108 |
| Page: 1 2 3 4 5 |
| Tissue | Expression Dynamics | Abbreviation |
| Esophagus | 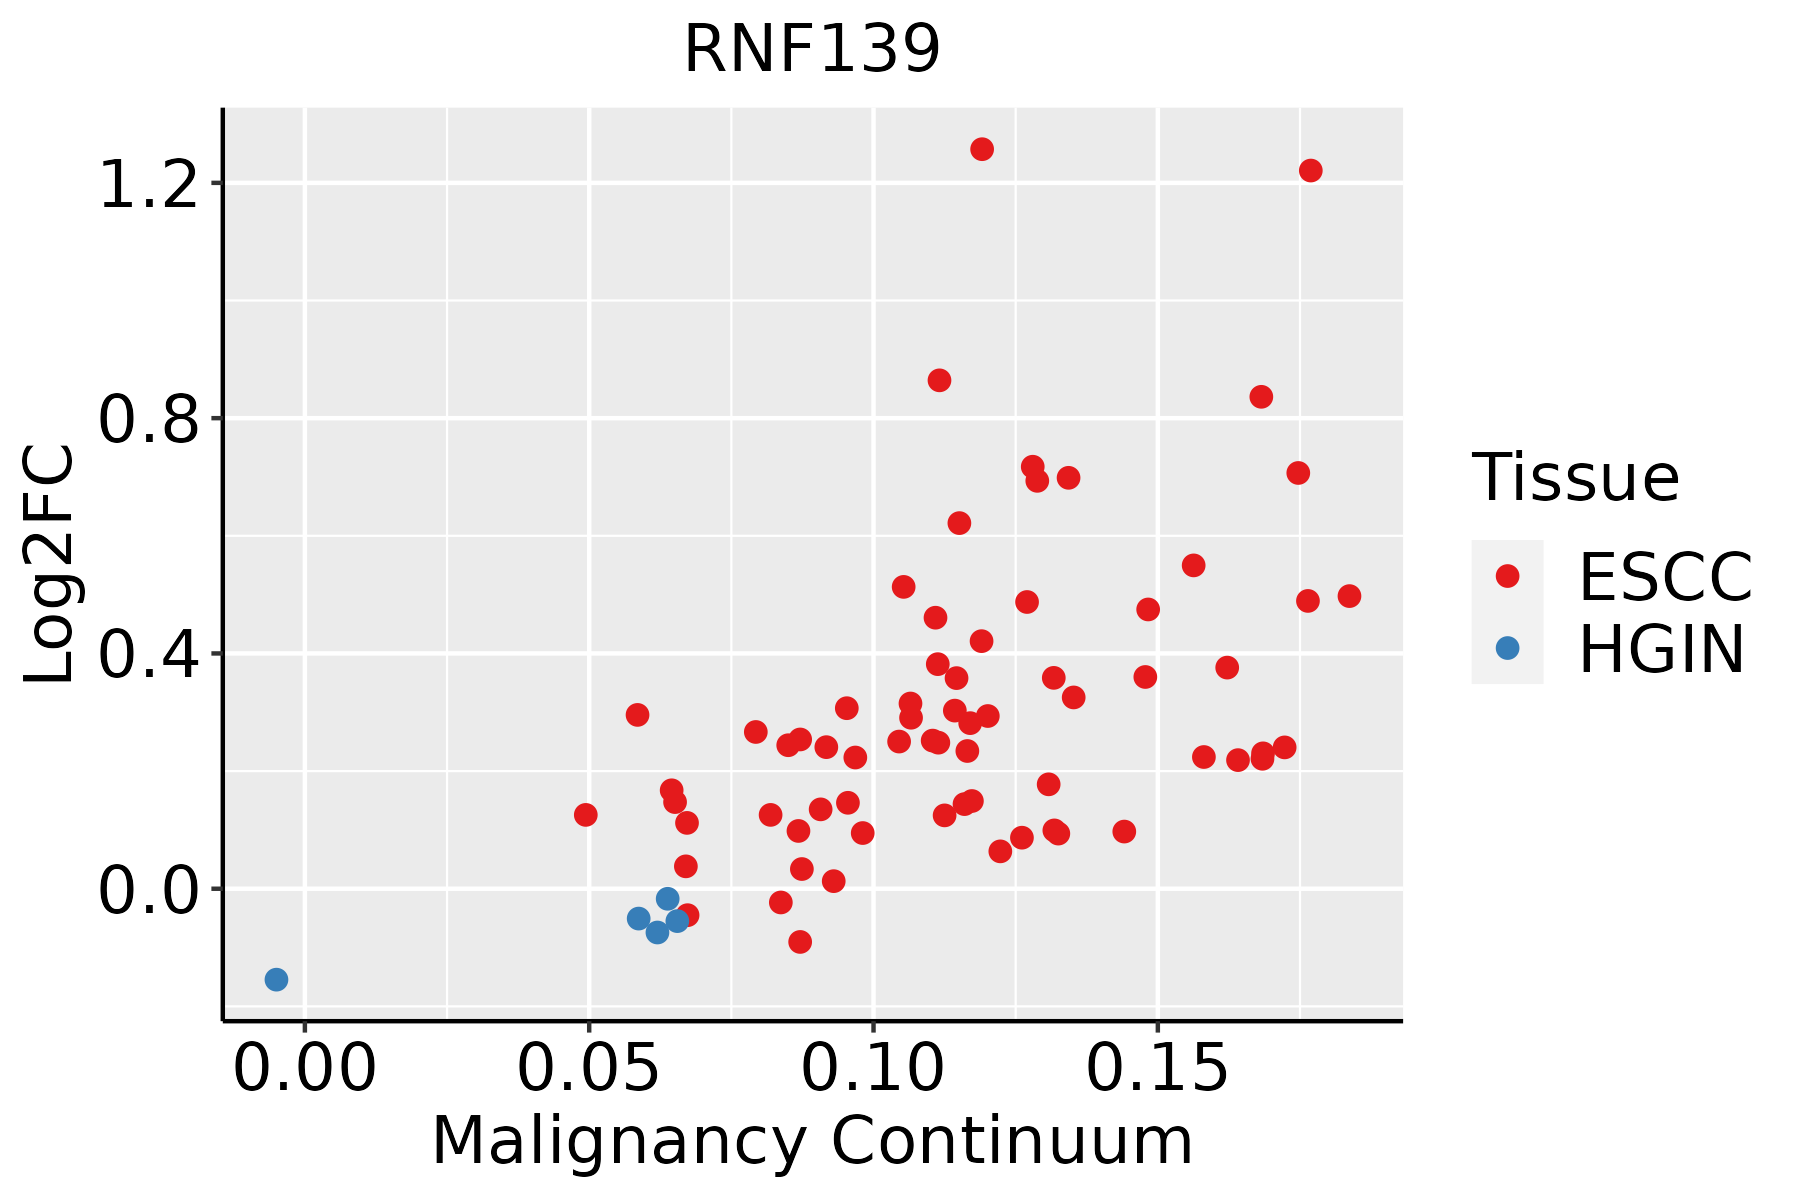 | ESCC: Esophageal squamous cell carcinoma |
| HGIN: High-grade intraepithelial neoplasias | ||
| LGIN: Low-grade intraepithelial neoplasias | ||
| Liver | 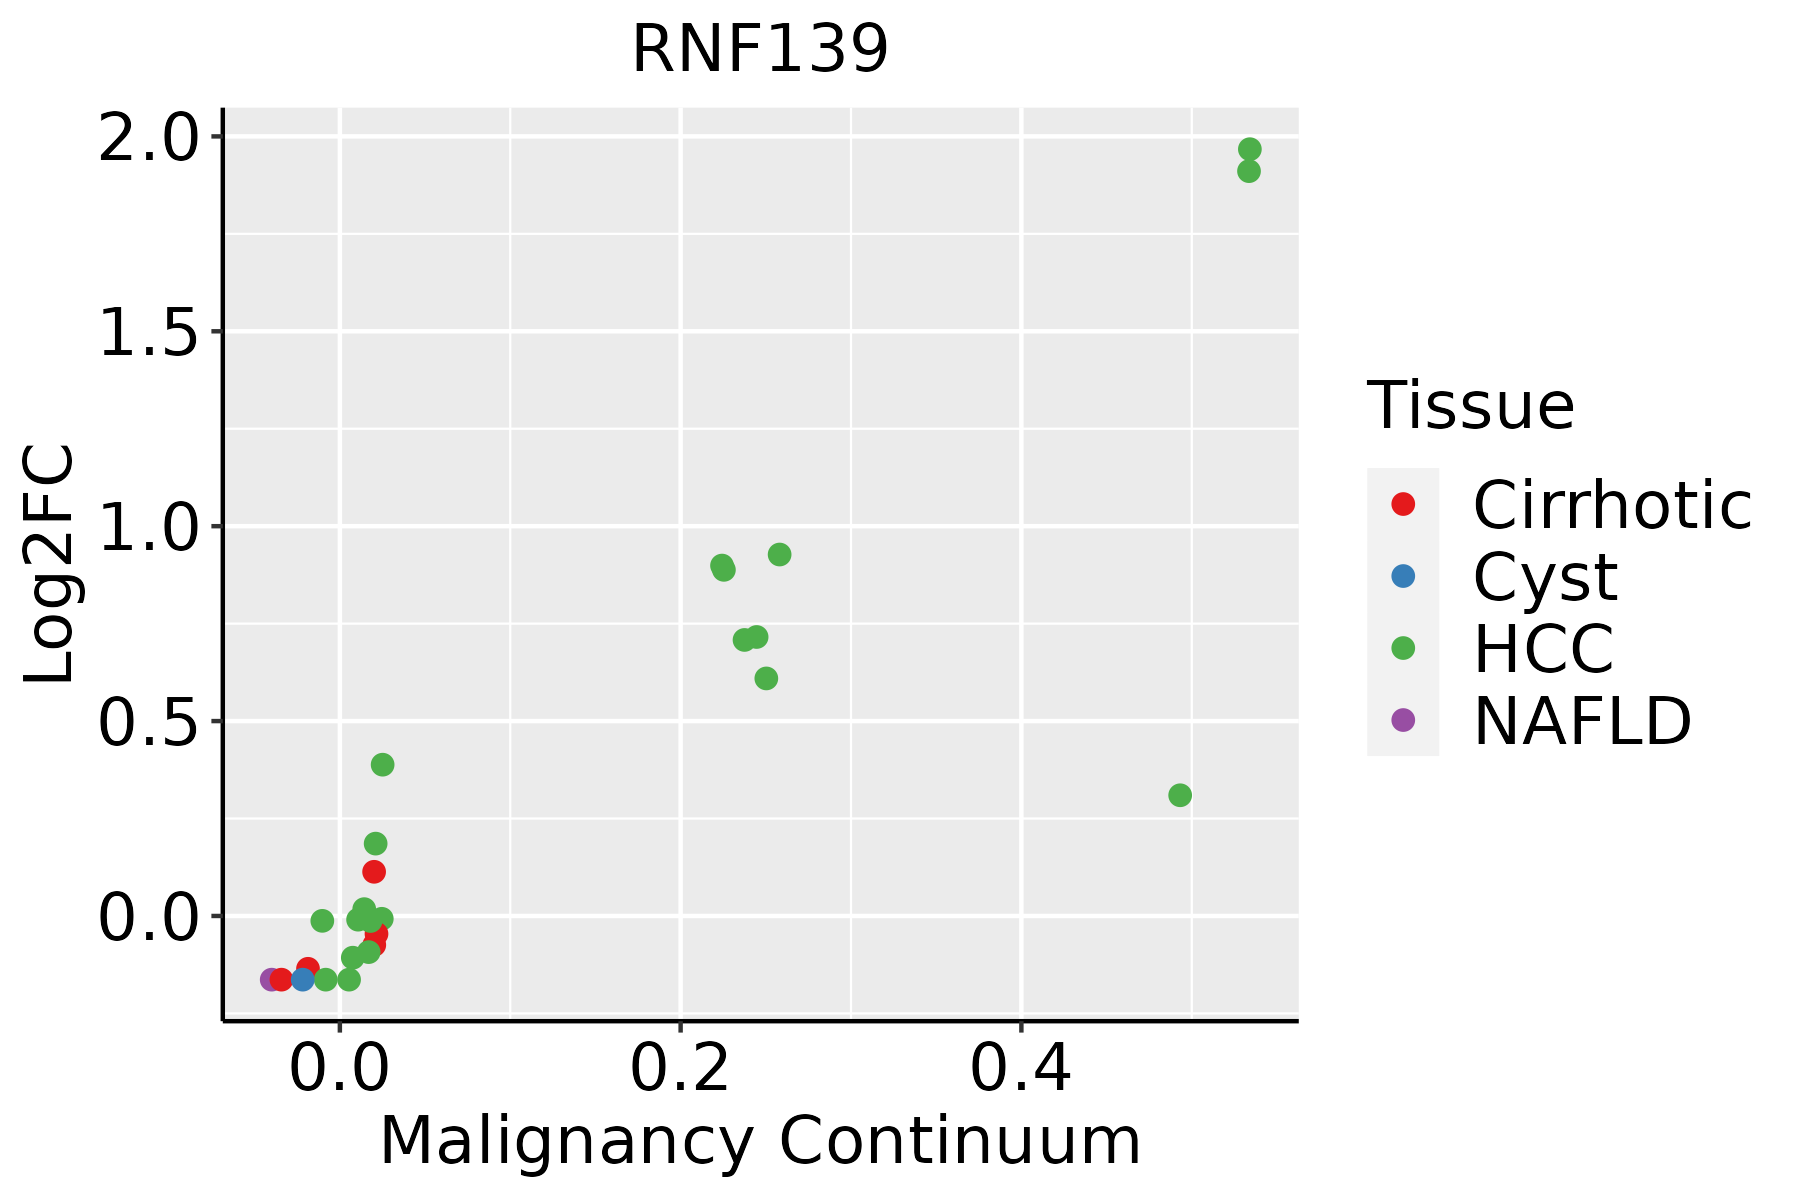 | HCC: Hepatocellular carcinoma |
| NAFLD: Non-alcoholic fatty liver disease | ||
| Oral Cavity | 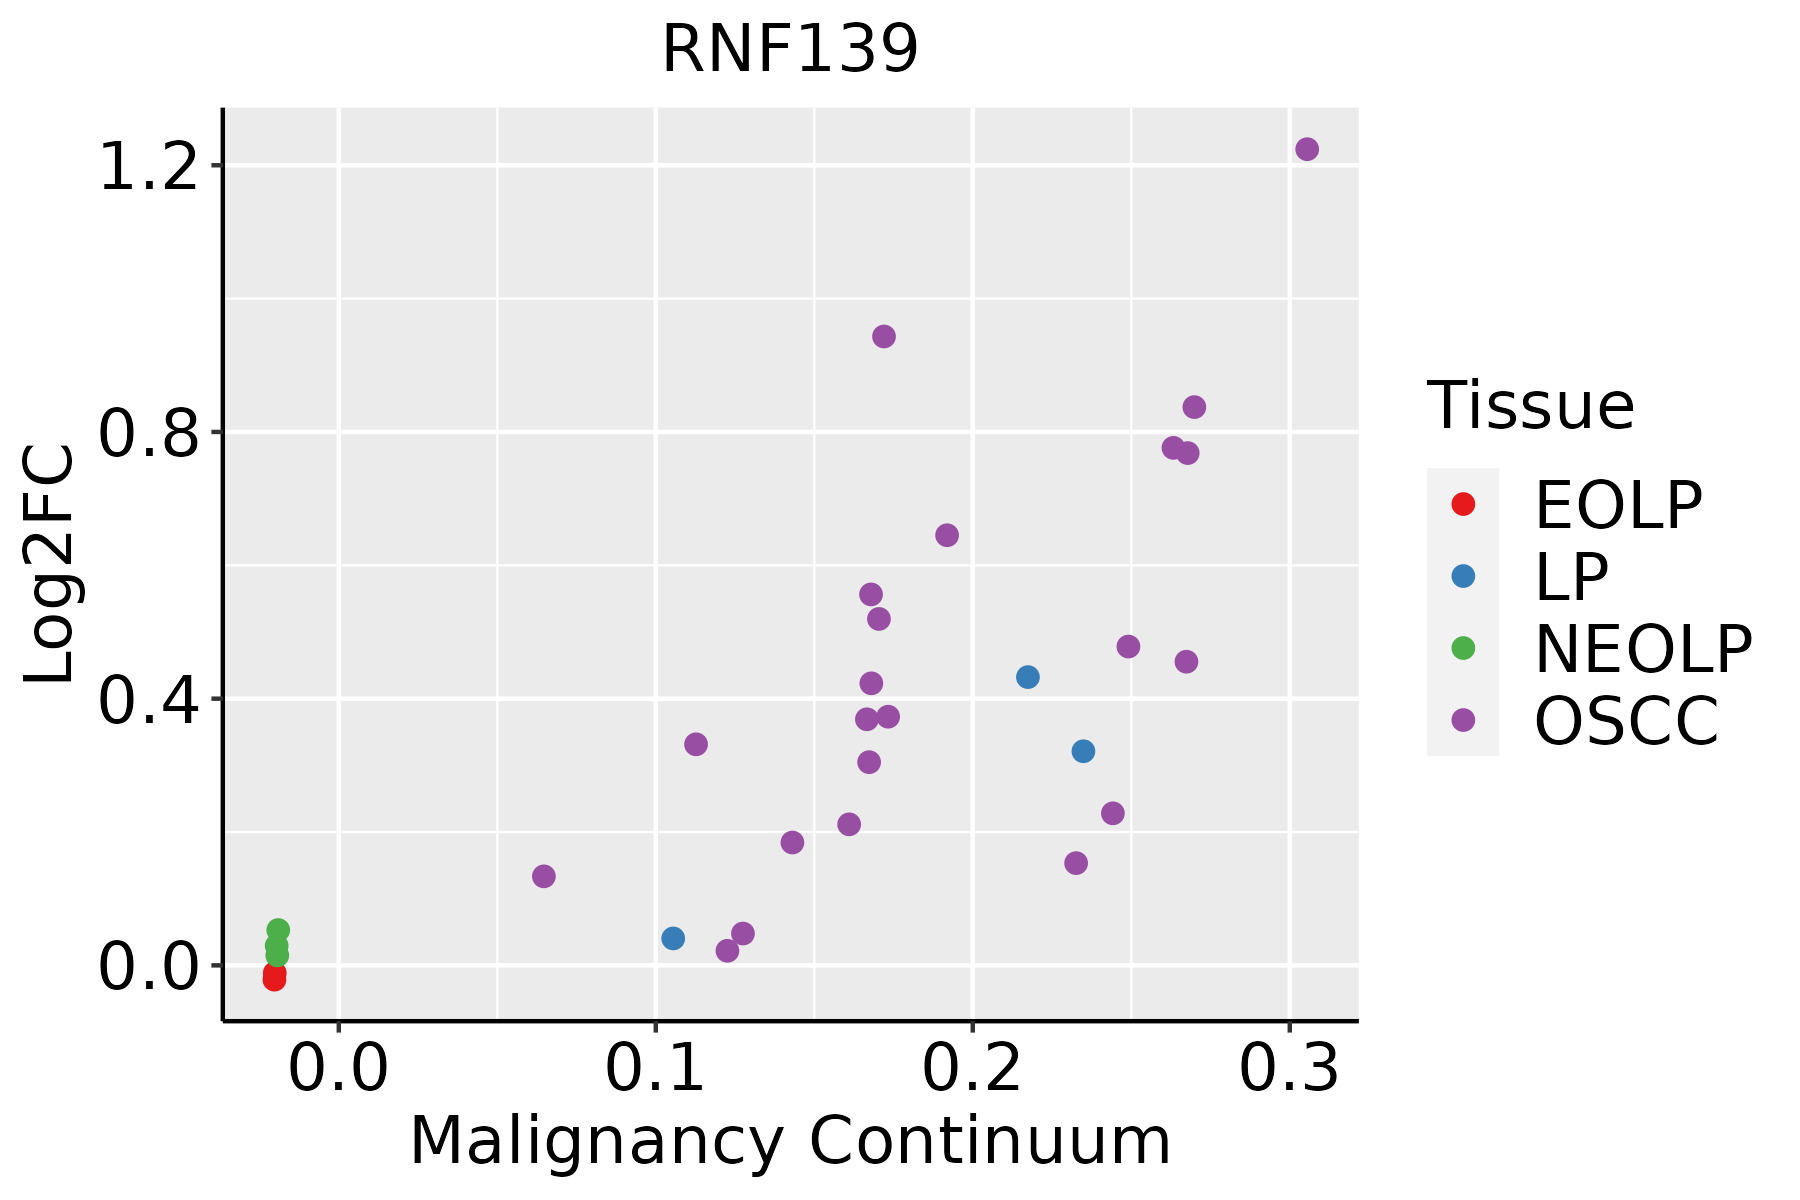 | EOLP: Erosive Oral lichen planus |
| LP: leukoplakia | ||
| NEOLP: Non-erosive oral lichen planus | ||
| OSCC: Oral squamous cell carcinoma |
| ∗log2FC in expression of this searched gene in stem-like cells from each diseased tissue sample relative to stem-like cells in normal samples in each tissue plotted against the malignancy continuum. Samples are colored based on if they are from different disease stage. |
Top |
Malignant transformation related pathway analysis |
| Find out the enriched GO biological processes and KEGG pathways involved in transition from healthy to precancer to cancer |
| Tissue | Disease Stage | Enriched GO biological Processes |
| Colorectum | AD |  |
| Colorectum | SER |  |
| Colorectum | MSS |  |
| Colorectum | MSI-H |  |
| Colorectum | FAP |  |
| ∗Top 15 enriched GO BP terms are showed in the bar plot of each disease state in each tissue. Each row represents a significant GO biological process which is colored according to the -log10(p.adjust). |
| Page: 1 2 3 4 5 6 7 8 9 |
| GO ID | Tissue | Disease Stage | Description | Gene Ratio | Bg Ratio | pvalue | p.adjust | Count |
| GO:0010498111 | Esophagus | ESCC | proteasomal protein catabolic process | 369/8552 | 490/18723 | 1.13e-41 | 1.80e-38 | 369 |
| GO:004819318 | Esophagus | ESCC | Golgi vesicle transport | 231/8552 | 296/18723 | 1.82e-30 | 9.63e-28 | 231 |
| GO:0042176111 | Esophagus | ESCC | regulation of protein catabolic process | 280/8552 | 391/18723 | 8.65e-26 | 2.39e-23 | 280 |
| GO:0031647111 | Esophagus | ESCC | regulation of protein stability | 223/8552 | 298/18723 | 5.76e-25 | 1.52e-22 | 223 |
| GO:003238618 | Esophagus | ESCC | regulation of intracellular transport | 243/8552 | 337/18723 | 3.20e-23 | 7.25e-21 | 243 |
| GO:0009896111 | Esophagus | ESCC | positive regulation of catabolic process | 332/8552 | 492/18723 | 4.36e-23 | 9.22e-21 | 332 |
| GO:0034976111 | Esophagus | ESCC | response to endoplasmic reticulum stress | 192/8552 | 256/18723 | 7.15e-22 | 1.30e-19 | 192 |
| GO:0031331111 | Esophagus | ESCC | positive regulation of cellular catabolic process | 292/8552 | 427/18723 | 8.67e-22 | 1.53e-19 | 292 |
| GO:1903362111 | Esophagus | ESCC | regulation of cellular protein catabolic process | 188/8552 | 255/18723 | 5.12e-20 | 6.62e-18 | 188 |
| GO:0045862111 | Esophagus | ESCC | positive regulation of proteolysis | 256/8552 | 372/18723 | 7.88e-20 | 9.43e-18 | 256 |
| GO:1903050111 | Esophagus | ESCC | regulation of proteolysis involved in cellular protein catabolic process | 163/8552 | 221/18723 | 1.44e-17 | 1.27e-15 | 163 |
| GO:0006417111 | Esophagus | ESCC | regulation of translation | 304/8552 | 468/18723 | 1.53e-17 | 1.33e-15 | 304 |
| GO:0045732111 | Esophagus | ESCC | positive regulation of protein catabolic process | 167/8552 | 231/18723 | 1.47e-16 | 1.14e-14 | 167 |
| GO:2000058111 | Esophagus | ESCC | regulation of ubiquitin-dependent protein catabolic process | 125/8552 | 164/18723 | 1.17e-15 | 7.76e-14 | 125 |
| GO:000688815 | Esophagus | ESCC | endoplasmic reticulum to Golgi vesicle-mediated transport | 102/8552 | 130/18723 | 1.73e-14 | 9.22e-13 | 102 |
| GO:1903364111 | Esophagus | ESCC | positive regulation of cellular protein catabolic process | 117/8552 | 155/18723 | 3.25e-14 | 1.66e-12 | 117 |
| GO:1903052110 | Esophagus | ESCC | positive regulation of proteolysis involved in cellular protein catabolic process | 101/8552 | 133/18723 | 9.58e-13 | 4.19e-11 | 101 |
| GO:003650315 | Esophagus | ESCC | ERAD pathway | 82/8552 | 107/18723 | 5.80e-11 | 1.84e-09 | 82 |
| GO:005160418 | Esophagus | ESCC | protein maturation | 189/8552 | 294/18723 | 7.64e-11 | 2.39e-09 | 189 |
| GO:2000060111 | Esophagus | ESCC | positive regulation of ubiquitin-dependent protein catabolic process | 81/8552 | 107/18723 | 2.23e-10 | 6.34e-09 | 81 |
| Page: 1 2 3 4 5 6 |
| Pathway ID | Tissue | Disease Stage | Description | Gene Ratio | Bg Ratio | pvalue | p.adjust | qvalue | Count |
| Page: 1 |
Top |
Cell-cell communication analysis |
| Identification of potential cell-cell interactions between two cell types and their ligand-receptor pairs for different disease states |
| Ligand | Receptor | LRpair | Pathway | Tissue | Disease Stage |
| Page: 1 |
Top |
Single-cell gene regulatory network inference analysis |
| Find out the significant the regulons (TFs) and the target genes of each regulon across cell types for different disease states |
| TF | Cell Type | Tissue | Disease Stage | Target Gene | RSS | Regulon Activity |
| ∗The dot plots of a searched regulon are shown for all cell subpopulations in each disease state of each tissue based on the regulon specific score inferred using pySCENIC and by calculating the average expression. |
| Page: 1 |
Top |
Somatic mutation of malignant transformation related genes |
| Annotation of somatic variants for genes involved in malignant transformation |
| Hugo Symbol | Variant Class | Variant Classification | dbSNP RS | HGVSc | HGVSp | HGVSp Short | SWISSPROT | BIOTYPE | SIFT | PolyPhen | Tumor Sample Barcode | Tissue | Histology | Sex | Age | Stage | Therapy Types | Drugs | Outcome |
| RNF139 | insertion | Nonsense_Mutation | novel | c.691_692insAGTAAACAGTAAAGTCTCTCTGATGT | p.Arg231LysfsTer2 | p.R231Kfs*2 | Q8WU17 | protein_coding | TCGA-EL-A3ZG-01 | Thyroid | thyroid carcinoma | Male | <65 | I/II | Unknown | Unknown | SD | ||
| RNF139 | insertion | Nonsense_Mutation | novel | c.763_764insGAGAATCA | p.Tyr255Ter | p.Y255* | Q8WU17 | protein_coding | TCGA-FY-A4B0-01 | Thyroid | thyroid carcinoma | Male | >=65 | I/II | Hormone Therapy | synthroid | SD |
| Page: 1 2 3 4 5 6 7 8 |
Top |
Related drugs of malignant transformation related genes |
| Identification of chemicals and drugs interact with genes involved in malignant transfromation |
| (DGIdb 4.0) |
| Entrez ID | Symbol | Category | Interaction Types | Drug Claim Name | Drug Name | PMIDs |
| Page: 1 |

Copyright 2023-Present -The University of Texas Health Science Center at Houston |