
|
|||||
|
 | |
| |
| |
| |
| |
| |
|
Gene: HNRNPL |
Gene summary for HNRNPL |
| Gene information | Species | Human | Gene symbol | HNRNPL | Gene ID | 3191 |
| Gene name | heterogeneous nuclear ribonucleoprotein L | |
| Gene Alias | HNRPL | |
| Cytomap | 19q13.2 | |
| Gene Type | protein-coding | GO ID | GO:0000375 | UniProtAcc | P14866 |
Top |
Malignant transformation analysis |
| Identification of the aberrant gene expression in precancerous and cancerous lesions by comparing the gene expression of stem-like cells in diseased tissues with normal stem cells |
| Entrez ID | Symbol | Replicates | Species | Organ | Tissue | Adj P-value | Log2FC | Malignancy |
| 3191 | HNRNPL | HTA11_3410_2000001011 | Human | Colorectum | AD | 2.67e-05 | 1.21e-01 | 0.0155 |
| 3191 | HNRNPL | HTA11_1938_2000001011 | Human | Colorectum | AD | 2.48e-05 | 6.22e-01 | -0.0811 |
| 3191 | HNRNPL | HTA11_347_2000001011 | Human | Colorectum | AD | 2.52e-09 | 5.07e-01 | -0.1954 |
| 3191 | HNRNPL | HTA11_696_2000001011 | Human | Colorectum | AD | 3.21e-04 | 3.67e-01 | -0.1464 |
| 3191 | HNRNPL | HTA11_866_2000001011 | Human | Colorectum | AD | 2.41e-02 | 3.04e-01 | -0.1001 |
| 3191 | HNRNPL | HTA11_1391_2000001011 | Human | Colorectum | AD | 2.89e-05 | 5.12e-01 | -0.059 |
| 3191 | HNRNPL | HTA11_866_3004761011 | Human | Colorectum | AD | 5.08e-14 | 7.36e-01 | 0.096 |
| 3191 | HNRNPL | HTA11_7663_2000001011 | Human | Colorectum | SER | 2.73e-04 | 7.05e-01 | 0.0131 |
| 3191 | HNRNPL | HTA11_10623_2000001011 | Human | Colorectum | AD | 4.99e-03 | 4.78e-01 | -0.0177 |
| 3191 | HNRNPL | HTA11_7696_3000711011 | Human | Colorectum | AD | 1.83e-22 | 8.20e-01 | 0.0674 |
| 3191 | HNRNPL | HTA11_6818_2000001021 | Human | Colorectum | AD | 1.48e-08 | 6.18e-01 | 0.0588 |
| 3191 | HNRNPL | HTA11_99999970781_79442 | Human | Colorectum | MSS | 1.28e-14 | 6.11e-01 | 0.294 |
| 3191 | HNRNPL | HTA11_99999965062_69753 | Human | Colorectum | MSI-H | 1.03e-07 | 1.31e+00 | 0.3487 |
| 3191 | HNRNPL | HTA11_99999965104_69814 | Human | Colorectum | MSS | 1.24e-05 | 5.70e-01 | 0.281 |
| 3191 | HNRNPL | HTA11_99999971662_82457 | Human | Colorectum | MSS | 6.74e-11 | 5.98e-01 | 0.3859 |
| 3191 | HNRNPL | A015-C-203 | Human | Colorectum | FAP | 8.00e-06 | -2.86e-02 | -0.1294 |
| 3191 | HNRNPL | A001-C-108 | Human | Colorectum | FAP | 3.99e-02 | -9.42e-02 | -0.0272 |
| 3191 | HNRNPL | A002-C-205 | Human | Colorectum | FAP | 1.56e-05 | -1.84e-01 | -0.1236 |
| 3191 | HNRNPL | A015-C-006 | Human | Colorectum | FAP | 9.32e-04 | -7.52e-02 | -0.0994 |
| 3191 | HNRNPL | A002-C-114 | Human | Colorectum | FAP | 5.29e-06 | -2.32e-01 | -0.1561 |
| Page: 1 2 3 4 5 6 7 8 9 |
| Tissue | Expression Dynamics | Abbreviation |
| Colorectum (GSE201348) |  | FAP: Familial adenomatous polyposis |
| CRC: Colorectal cancer | ||
| Colorectum (HTA11) |  | AD: Adenomas |
| SER: Sessile serrated lesions | ||
| MSI-H: Microsatellite-high colorectal cancer | ||
| MSS: Microsatellite stable colorectal cancer | ||
| Endometrium | 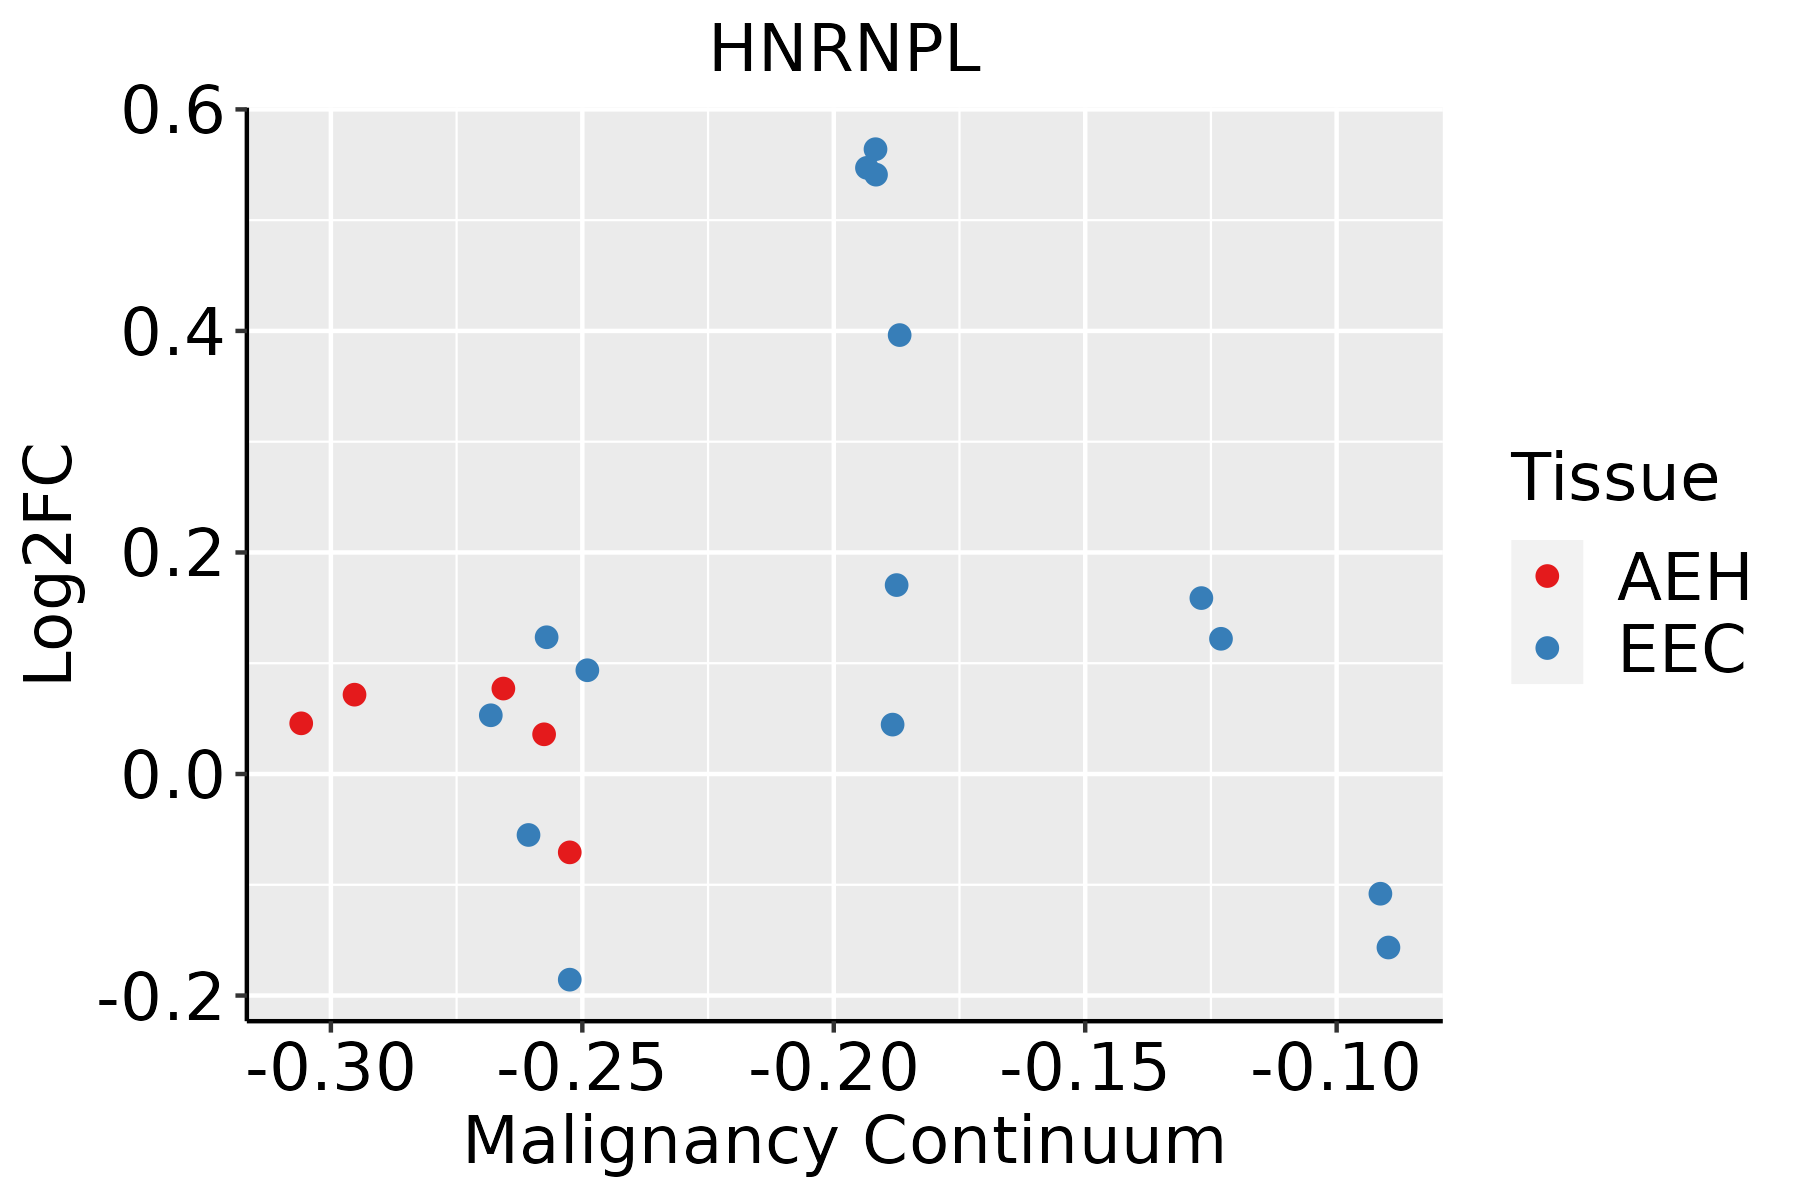 | AEH: Atypical endometrial hyperplasia |
| EEC: Endometrioid Cancer | ||
| Esophagus | 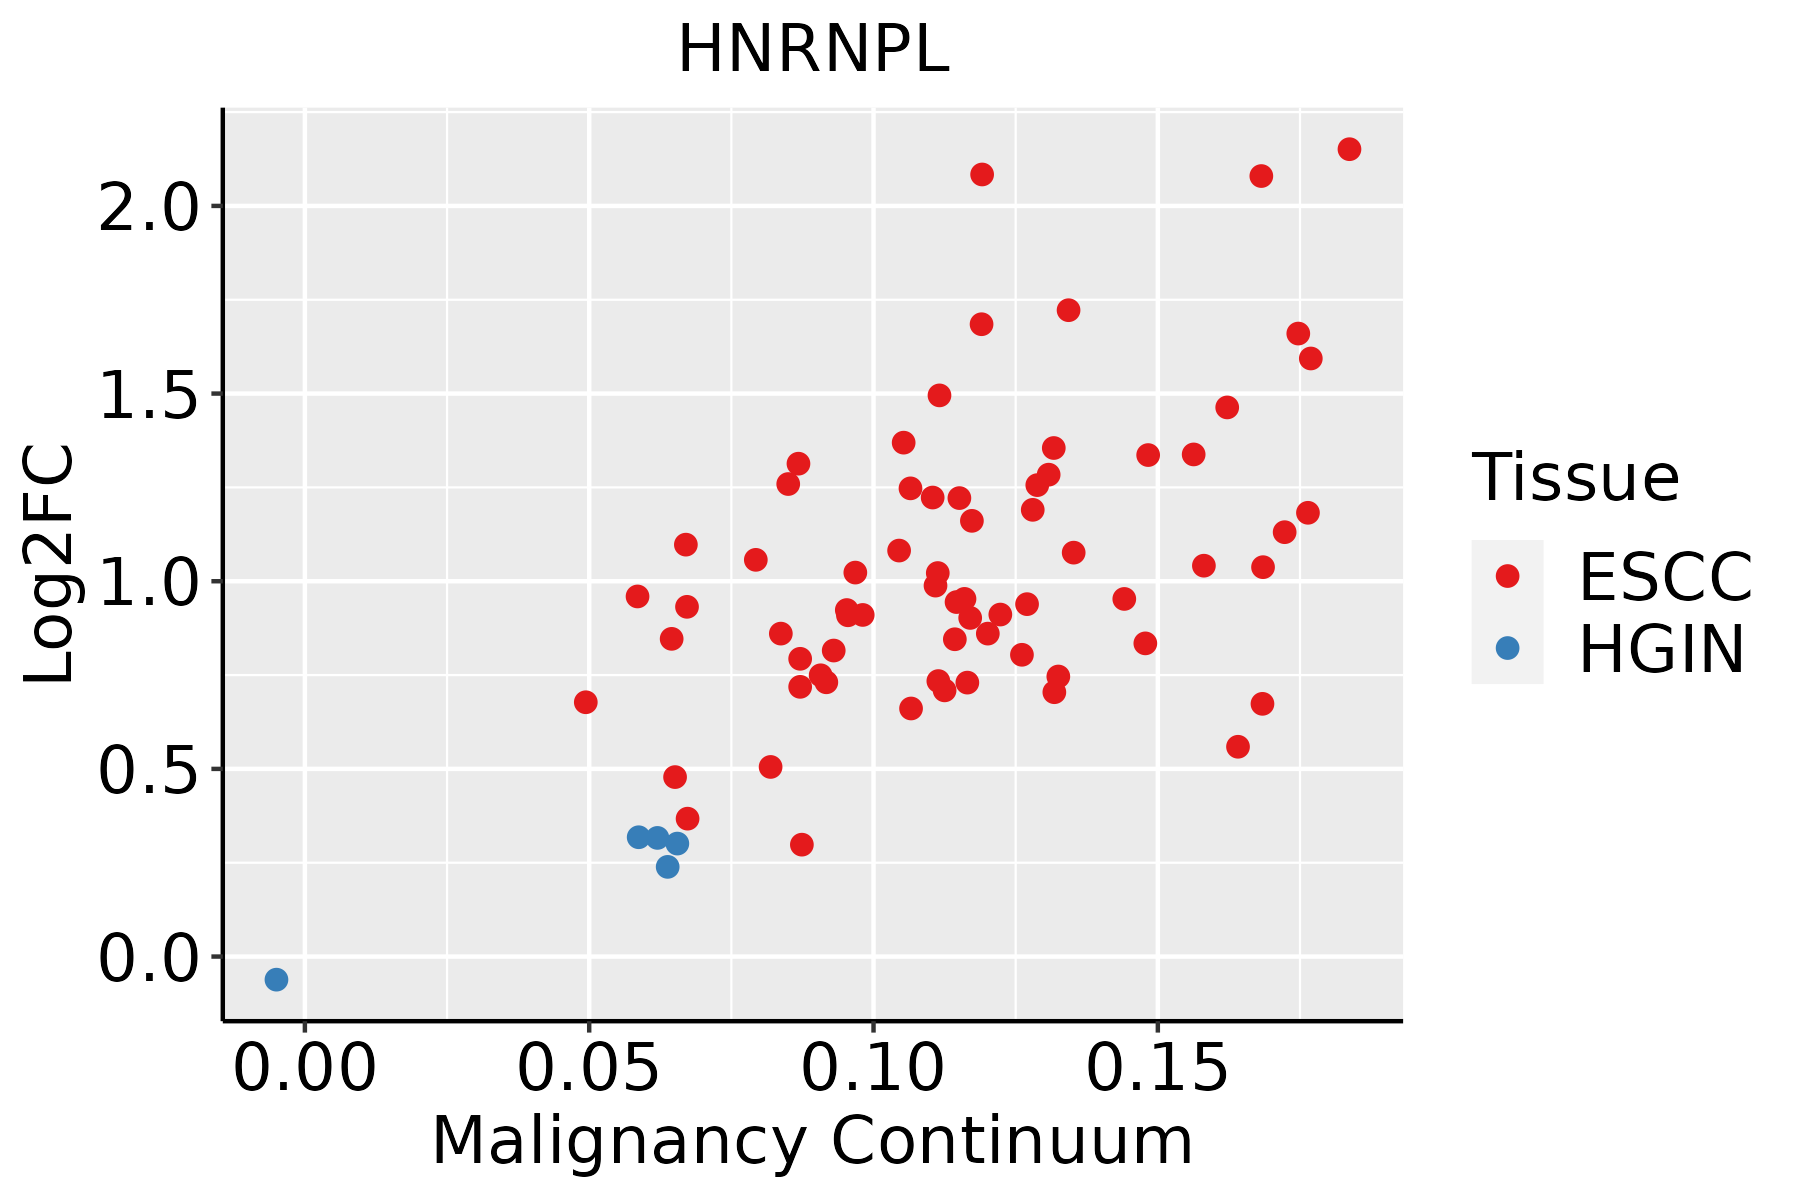 | ESCC: Esophageal squamous cell carcinoma |
| HGIN: High-grade intraepithelial neoplasias | ||
| LGIN: Low-grade intraepithelial neoplasias | ||
| Liver | 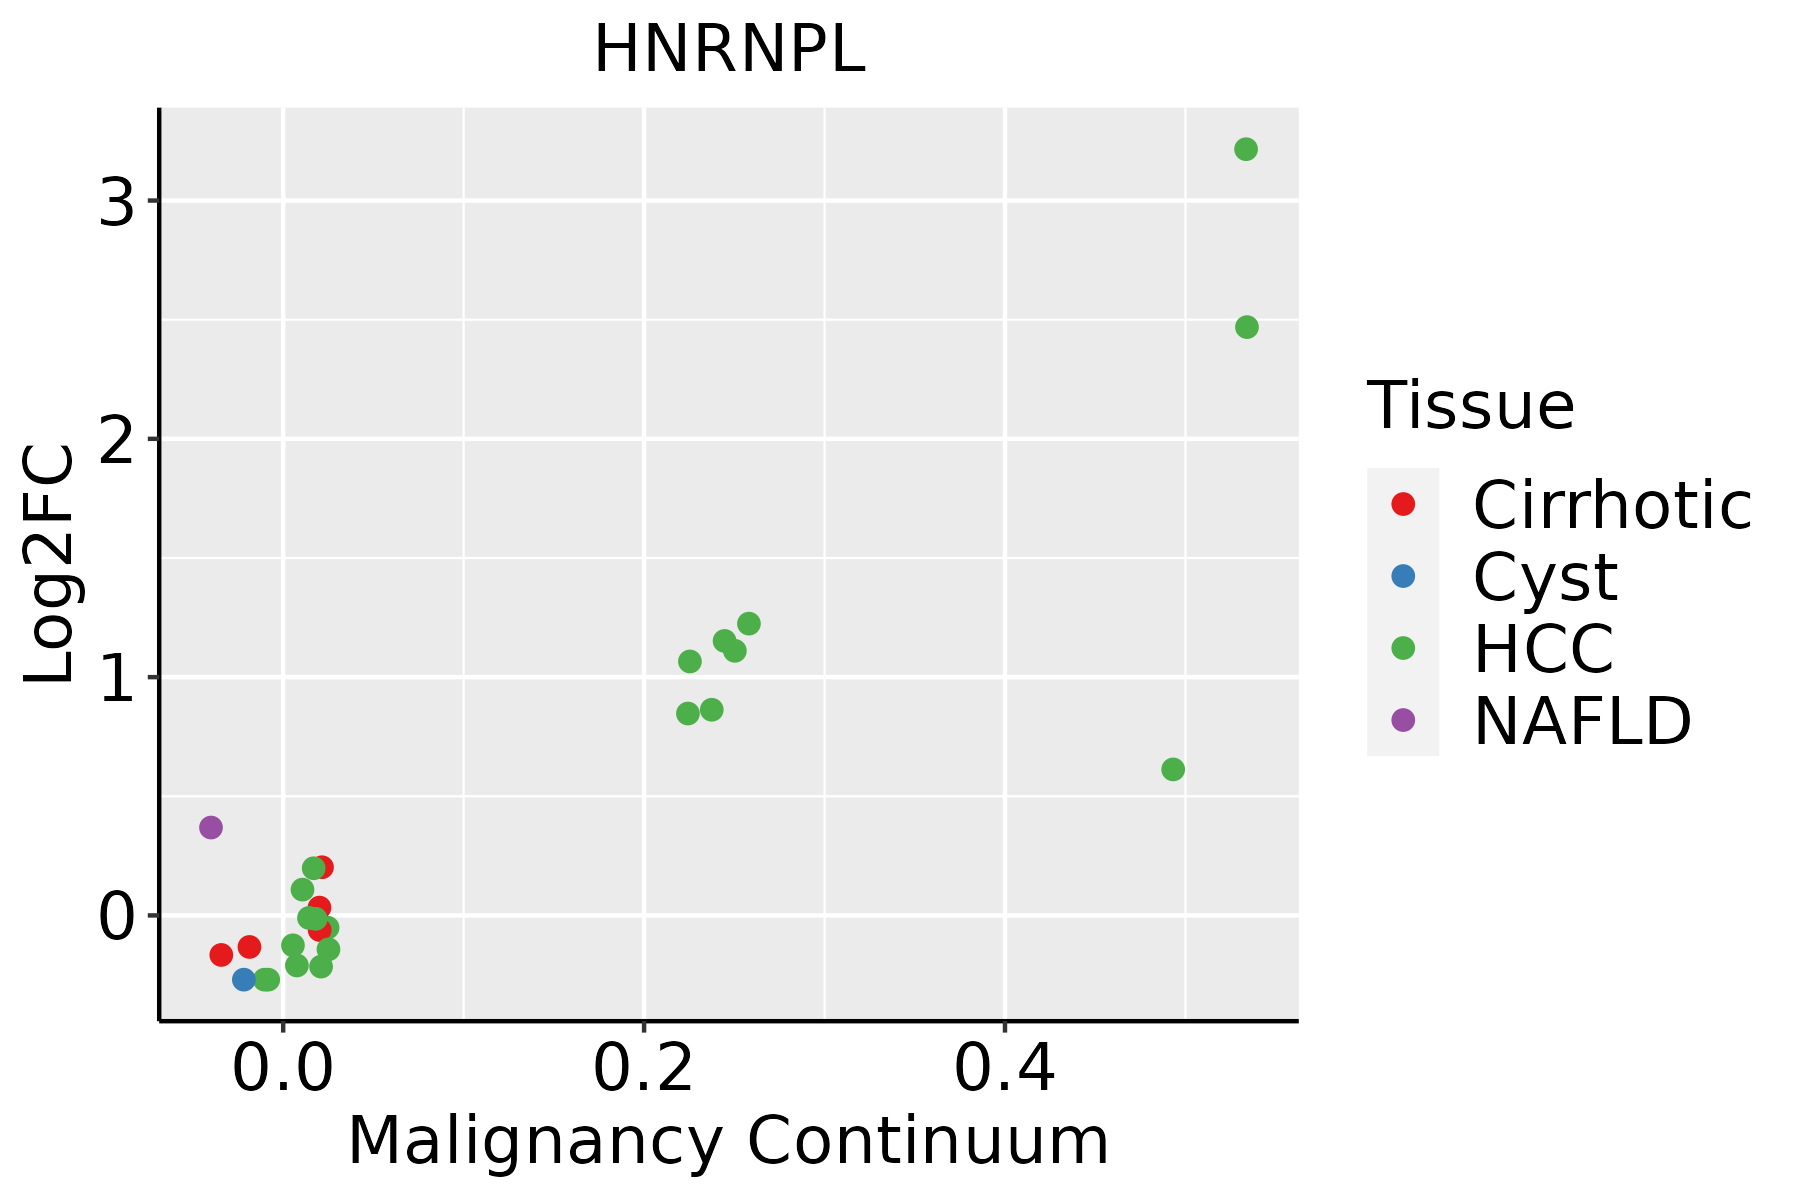 | HCC: Hepatocellular carcinoma |
| NAFLD: Non-alcoholic fatty liver disease | ||
| Oral Cavity | 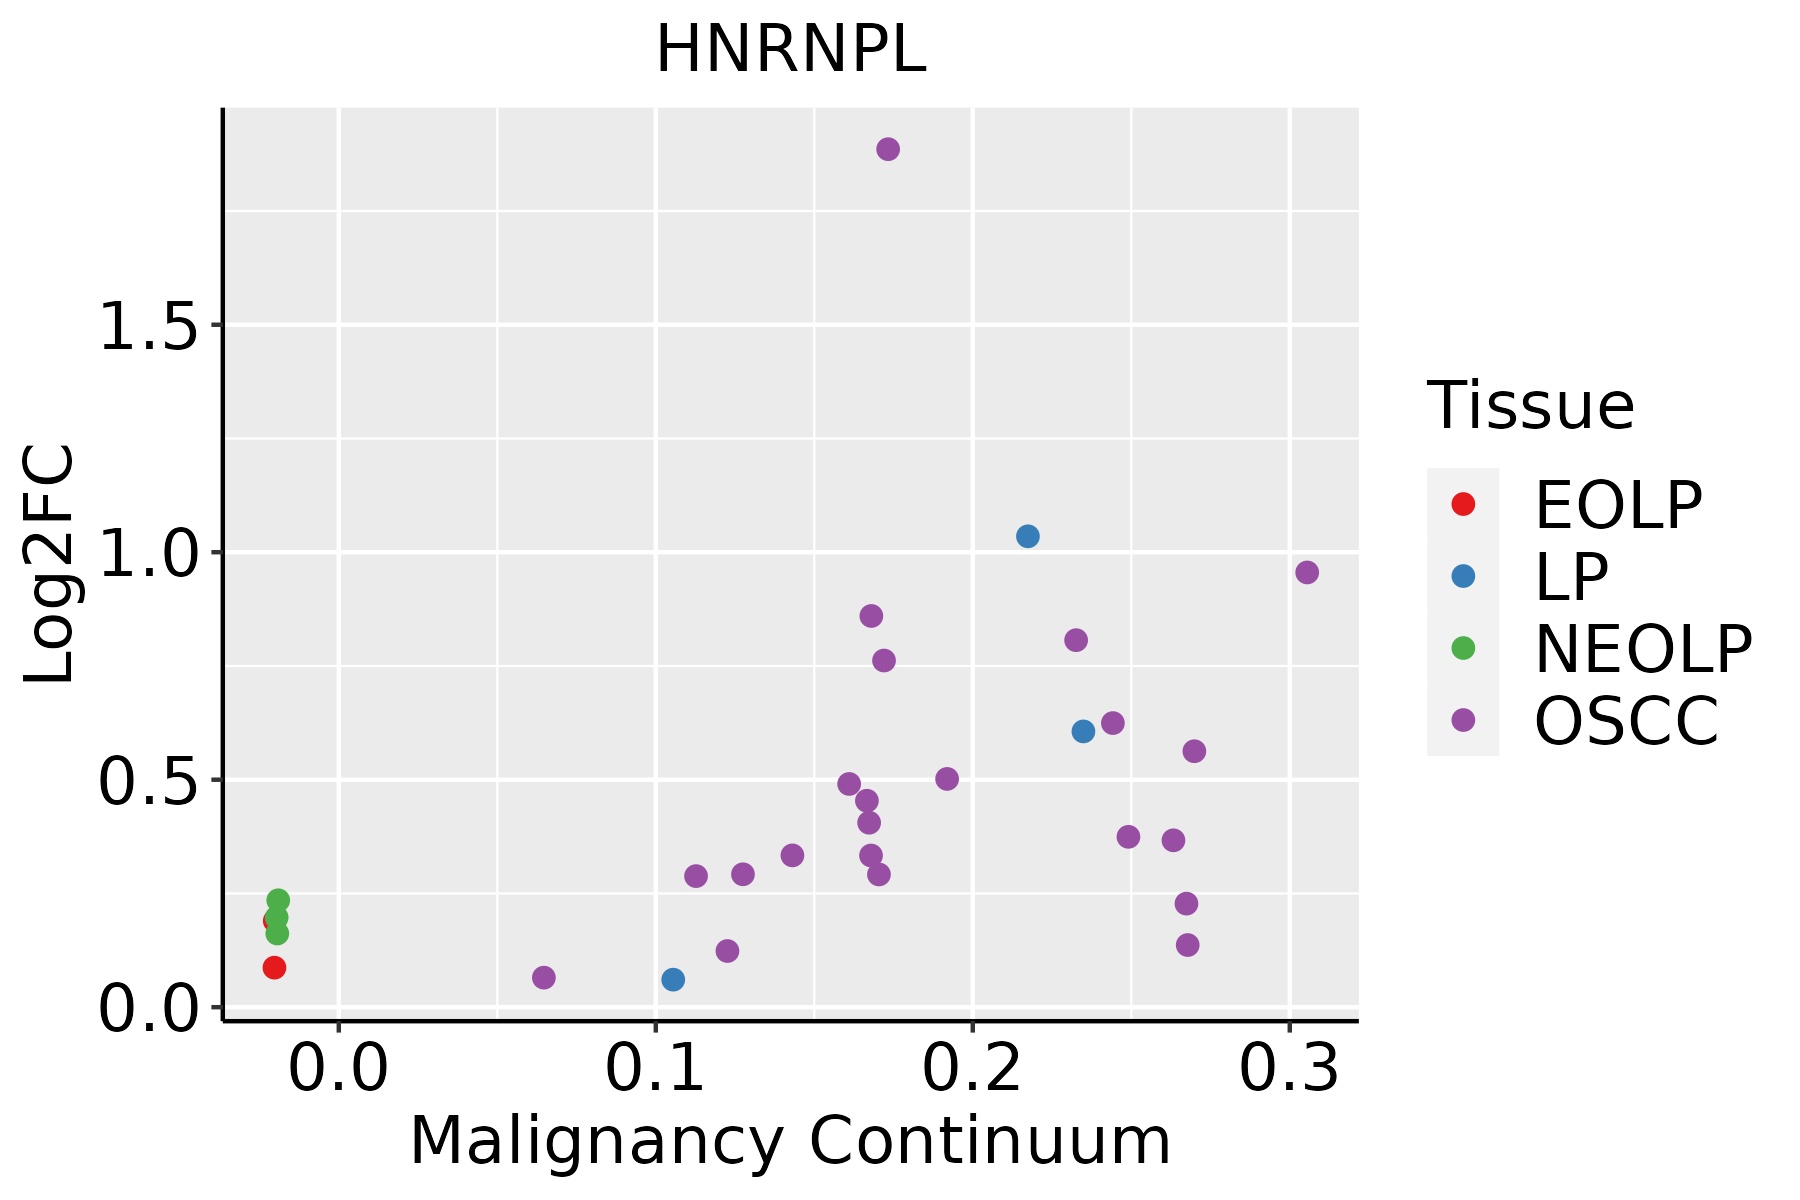 | EOLP: Erosive Oral lichen planus |
| LP: leukoplakia | ||
| NEOLP: Non-erosive oral lichen planus | ||
| OSCC: Oral squamous cell carcinoma | ||
| Skin | 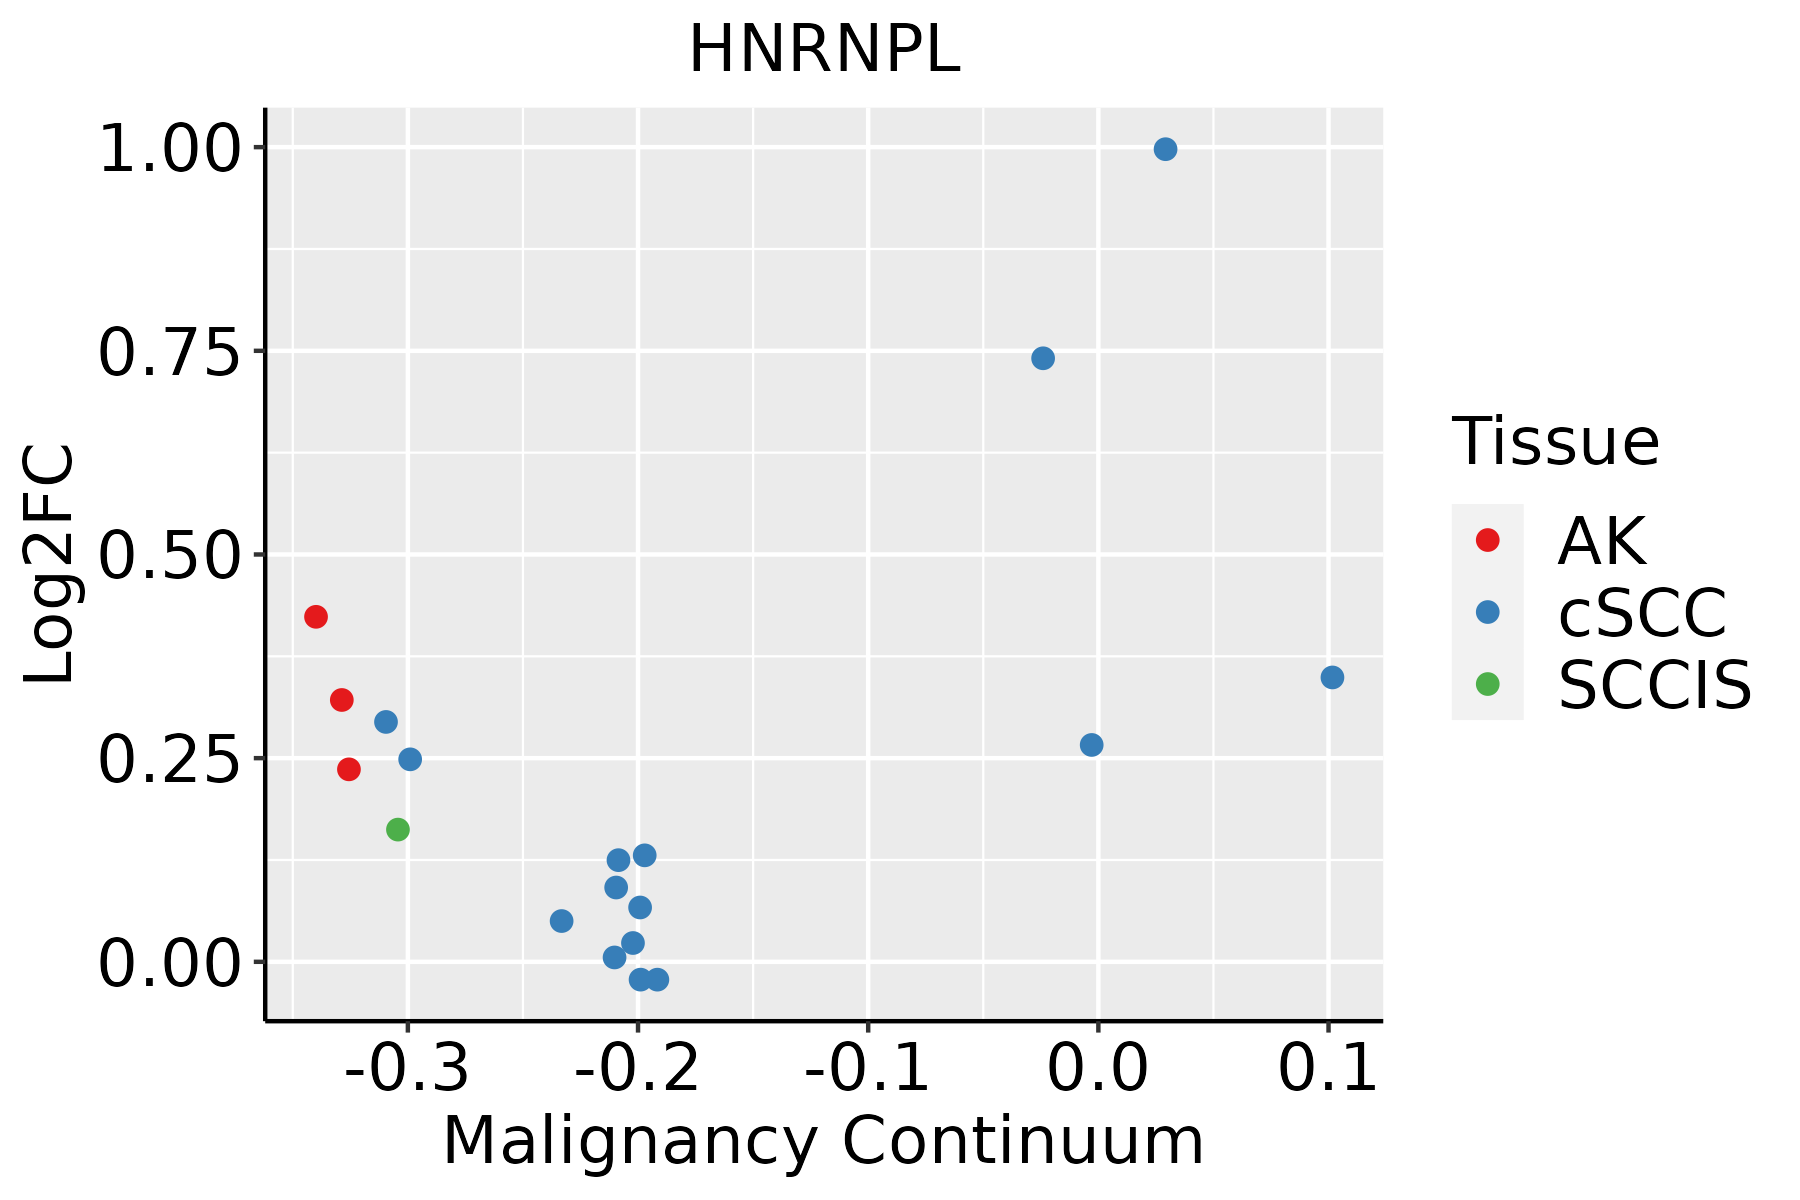 | AK: Actinic keratosis |
| cSCC: Cutaneous squamous cell carcinoma | ||
| SCCIS:squamous cell carcinoma in situ | ||
| Thyroid | 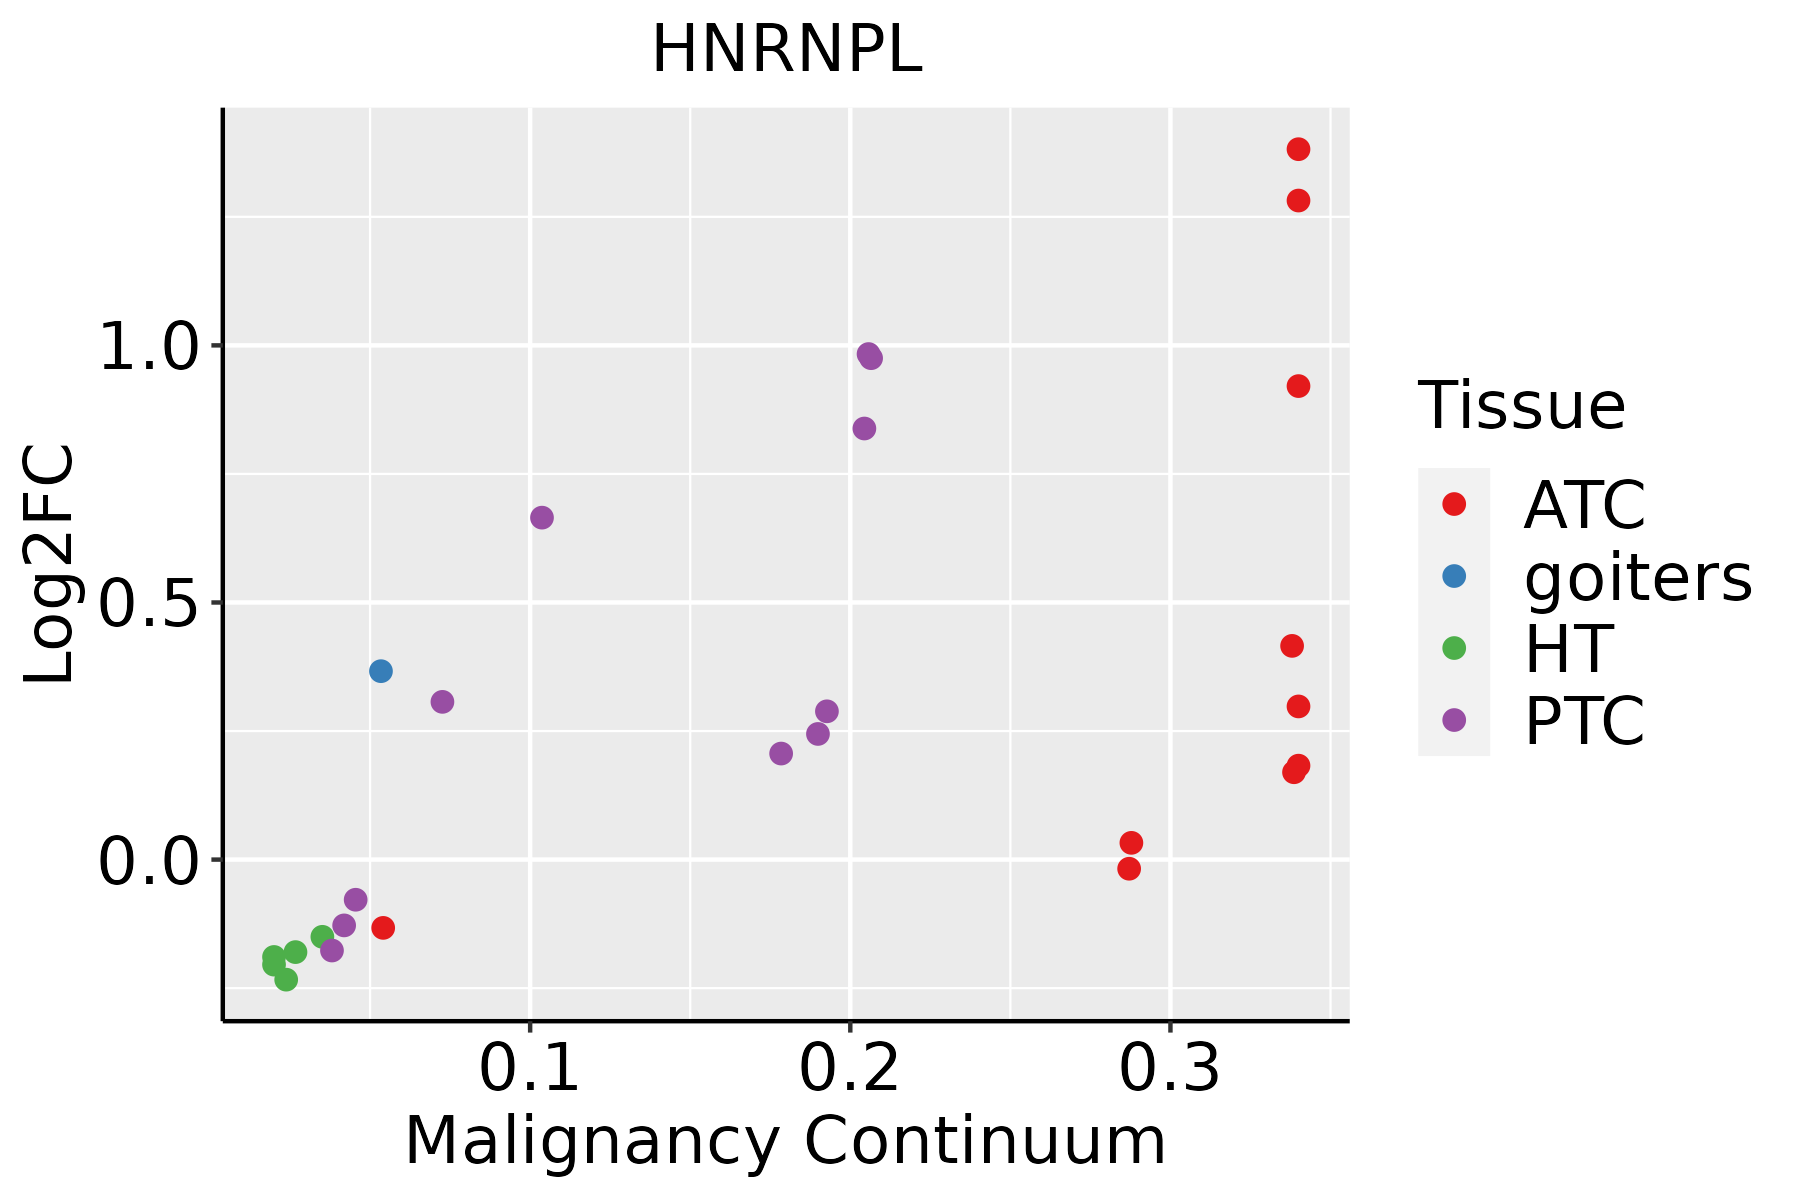 | ATC: Anaplastic thyroid cancer |
| HT: Hashimoto's thyroiditis | ||
| PTC: Papillary thyroid cancer |
| ∗log2FC in expression of this searched gene in stem-like cells from each diseased tissue sample relative to stem-like cells in normal samples in each tissue plotted against the malignancy continuum. Samples are colored based on if they are from different disease stage. |
Top |
Malignant transformation related pathway analysis |
| Find out the enriched GO biological processes and KEGG pathways involved in transition from healthy to precancer to cancer |
| Tissue | Disease Stage | Enriched GO biological Processes |
| Colorectum | AD |  |
| Colorectum | SER |  |
| Colorectum | MSS |  |
| Colorectum | MSI-H |  |
| Colorectum | FAP |  |
| ∗Top 15 enriched GO BP terms are showed in the bar plot of each disease state in each tissue. Each row represents a significant GO biological process which is colored according to the -log10(p.adjust). |
| Page: 1 2 3 4 5 6 7 8 9 |
| GO ID | Tissue | Disease Stage | Description | Gene Ratio | Bg Ratio | pvalue | p.adjust | Count |
| GO:0008380 | Colorectum | AD | RNA splicing | 169/3918 | 434/18723 | 3.59e-18 | 2.04e-15 | 169 |
| GO:0000377 | Colorectum | AD | RNA splicing, via transesterification reactions with bulged adenosine as nucleophile | 130/3918 | 320/18723 | 5.88e-16 | 2.16e-13 | 130 |
| GO:0000398 | Colorectum | AD | mRNA splicing, via spliceosome | 130/3918 | 320/18723 | 5.88e-16 | 2.16e-13 | 130 |
| GO:0000375 | Colorectum | AD | RNA splicing, via transesterification reactions | 131/3918 | 324/18723 | 7.11e-16 | 2.22e-13 | 131 |
| GO:1903311 | Colorectum | AD | regulation of mRNA metabolic process | 117/3918 | 288/18723 | 1.69e-14 | 4.23e-12 | 117 |
| GO:0043484 | Colorectum | AD | regulation of RNA splicing | 70/3918 | 148/18723 | 6.47e-13 | 1.16e-10 | 70 |
| GO:0048024 | Colorectum | AD | regulation of mRNA splicing, via spliceosome | 50/3918 | 101/18723 | 1.62e-10 | 1.56e-08 | 50 |
| GO:0050684 | Colorectum | AD | regulation of mRNA processing | 61/3918 | 137/18723 | 4.23e-10 | 3.58e-08 | 61 |
| GO:0000380 | Colorectum | AD | alternative mRNA splicing, via spliceosome | 33/3918 | 77/18723 | 1.13e-05 | 2.55e-04 | 33 |
| GO:0000381 | Colorectum | AD | regulation of alternative mRNA splicing, via spliceosome | 27/3918 | 60/18723 | 2.41e-05 | 4.66e-04 | 27 |
| GO:00083801 | Colorectum | SER | RNA splicing | 123/2897 | 434/18723 | 3.84e-12 | 8.41e-10 | 123 |
| GO:00003751 | Colorectum | SER | RNA splicing, via transesterification reactions | 90/2897 | 324/18723 | 8.68e-09 | 7.50e-07 | 90 |
| GO:00003771 | Colorectum | SER | RNA splicing, via transesterification reactions with bulged adenosine as nucleophile | 89/2897 | 320/18723 | 9.82e-09 | 8.14e-07 | 89 |
| GO:00003981 | Colorectum | SER | mRNA splicing, via spliceosome | 89/2897 | 320/18723 | 9.82e-09 | 8.14e-07 | 89 |
| GO:00434841 | Colorectum | SER | regulation of RNA splicing | 49/2897 | 148/18723 | 7.02e-08 | 4.49e-06 | 49 |
| GO:19033111 | Colorectum | SER | regulation of mRNA metabolic process | 78/2897 | 288/18723 | 2.61e-07 | 1.43e-05 | 78 |
| GO:00480241 | Colorectum | SER | regulation of mRNA splicing, via spliceosome | 35/2897 | 101/18723 | 1.52e-06 | 6.85e-05 | 35 |
| GO:00506841 | Colorectum | SER | regulation of mRNA processing | 42/2897 | 137/18723 | 5.57e-06 | 2.01e-04 | 42 |
| GO:00003801 | Colorectum | SER | alternative mRNA splicing, via spliceosome | 24/2897 | 77/18723 | 4.08e-04 | 6.09e-03 | 24 |
| GO:00003811 | Colorectum | SER | regulation of alternative mRNA splicing, via spliceosome | 20/2897 | 60/18723 | 4.60e-04 | 6.65e-03 | 20 |
| Page: 1 2 3 4 5 6 7 8 9 10 11 |
| Pathway ID | Tissue | Disease Stage | Description | Gene Ratio | Bg Ratio | pvalue | p.adjust | qvalue | Count |
| Page: 1 |
Top |
Cell-cell communication analysis |
| Identification of potential cell-cell interactions between two cell types and their ligand-receptor pairs for different disease states |
| Ligand | Receptor | LRpair | Pathway | Tissue | Disease Stage |
| Page: 1 |
Top |
Single-cell gene regulatory network inference analysis |
| Find out the significant the regulons (TFs) and the target genes of each regulon across cell types for different disease states |
| TF | Cell Type | Tissue | Disease Stage | Target Gene | RSS | Regulon Activity |
| ∗The dot plots of a searched regulon are shown for all cell subpopulations in each disease state of each tissue based on the regulon specific score inferred using pySCENIC and by calculating the average expression. |
| Page: 1 |
Top |
Somatic mutation of malignant transformation related genes |
| Annotation of somatic variants for genes involved in malignant transformation |
| Hugo Symbol | Variant Class | Variant Classification | dbSNP RS | HGVSc | HGVSp | HGVSp Short | SWISSPROT | BIOTYPE | SIFT | PolyPhen | Tumor Sample Barcode | Tissue | Histology | Sex | Age | Stage | Therapy Types | Drugs | Outcome |
| HNRNPL | SNV | Missense_Mutation | novel | c.394G>A | p.Val132Met | p.V132M | P14866 | protein_coding | tolerated(0.78) | benign(0.116) | TCGA-FY-A4B0-01 | Thyroid | thyroid carcinoma | Male | >=65 | I/II | Hormone Therapy | synthroid | SD |
| Page: 1 2 3 4 5 6 7 8 |
Top |
Related drugs of malignant transformation related genes |
| Identification of chemicals and drugs interact with genes involved in malignant transfromation |
| (DGIdb 4.0) |
| Entrez ID | Symbol | Category | Interaction Types | Drug Claim Name | Drug Name | PMIDs |
| Page: 1 |

Copyright 2023-Present -The University of Texas Health Science Center at Houston |