
|
|||||
|
 | |
| |
| |
| |
| |
| |
|
Gene: GAN |
Gene summary for GAN |
| Gene information | Species | Human | Gene symbol | GAN | Gene ID | 8139 |
| Gene name | gigaxonin | |
| Gene Alias | GAN1 | |
| Cytomap | 16q23.2 | |
| Gene Type | protein-coding | GO ID | GO:0006464 | UniProtAcc | A0A0S2Z4W2 |
Top |
Malignant transformation analysis |
| Identification of the aberrant gene expression in precancerous and cancerous lesions by comparing the gene expression of stem-like cells in diseased tissues with normal stem cells |
| Entrez ID | Symbol | Replicates | Species | Organ | Tissue | Adj P-value | Log2FC | Malignancy |
| 8139 | GAN | CCI_1 | Human | Cervix | CC | 4.32e-13 | 7.07e-01 | 0.528 |
| 8139 | GAN | CCI_2 | Human | Cervix | CC | 3.18e-07 | 7.64e-01 | 0.5249 |
| 8139 | GAN | CCI_3 | Human | Cervix | CC | 2.75e-12 | 7.43e-01 | 0.516 |
| 8139 | GAN | Tumor | Human | Cervix | CC | 5.14e-07 | 2.04e-01 | 0.1241 |
| 8139 | GAN | LZE22T | Human | Esophagus | ESCC | 1.23e-02 | 1.30e-01 | 0.068 |
| 8139 | GAN | P2T-E | Human | Esophagus | ESCC | 8.79e-06 | -5.63e-02 | 0.1177 |
| 8139 | GAN | P4T-E | Human | Esophagus | ESCC | 2.50e-06 | -4.93e-02 | 0.1323 |
| 8139 | GAN | P5T-E | Human | Esophagus | ESCC | 2.60e-11 | -3.88e-02 | 0.1327 |
| 8139 | GAN | P8T-E | Human | Esophagus | ESCC | 2.19e-24 | 7.83e-02 | 0.0889 |
| 8139 | GAN | P9T-E | Human | Esophagus | ESCC | 4.51e-08 | 4.91e-02 | 0.1131 |
| 8139 | GAN | P10T-E | Human | Esophagus | ESCC | 1.45e-12 | 1.12e-01 | 0.116 |
| 8139 | GAN | P11T-E | Human | Esophagus | ESCC | 2.71e-02 | 1.97e-01 | 0.1426 |
| 8139 | GAN | P12T-E | Human | Esophagus | ESCC | 4.29e-15 | -1.83e-02 | 0.1122 |
| 8139 | GAN | P15T-E | Human | Esophagus | ESCC | 1.37e-07 | 1.32e-01 | 0.1149 |
| 8139 | GAN | P16T-E | Human | Esophagus | ESCC | 8.83e-07 | -8.29e-02 | 0.1153 |
| 8139 | GAN | P20T-E | Human | Esophagus | ESCC | 2.42e-10 | 1.12e-01 | 0.1124 |
| 8139 | GAN | P21T-E | Human | Esophagus | ESCC | 1.39e-05 | 3.31e-02 | 0.1617 |
| 8139 | GAN | P22T-E | Human | Esophagus | ESCC | 7.19e-12 | 8.98e-02 | 0.1236 |
| 8139 | GAN | P23T-E | Human | Esophagus | ESCC | 6.87e-11 | 6.04e-01 | 0.108 |
| 8139 | GAN | P24T-E | Human | Esophagus | ESCC | 1.28e-11 | -3.58e-02 | 0.1287 |
| Page: 1 2 3 4 |
| Tissue | Expression Dynamics | Abbreviation |
| Cervix | 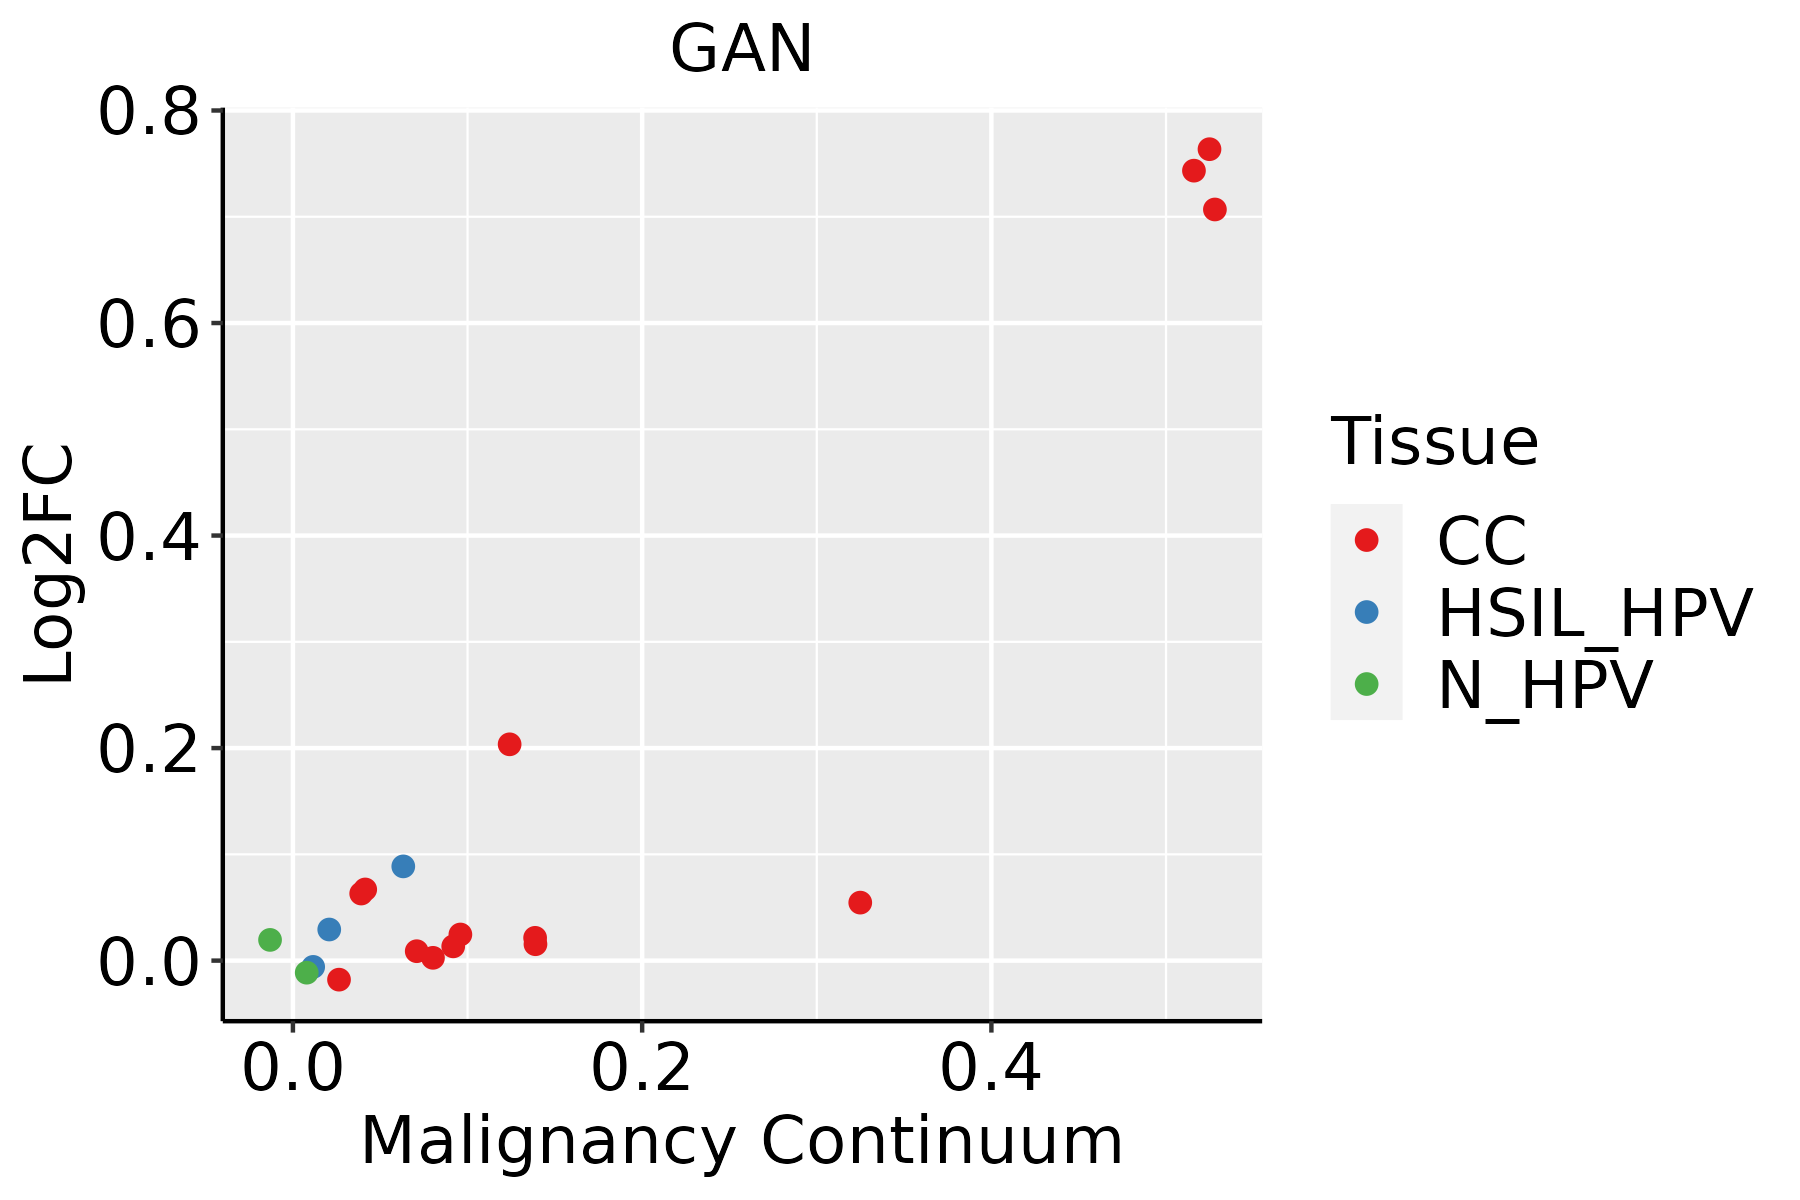 | CC: Cervix cancer |
| HSIL_HPV: HPV-infected high-grade squamous intraepithelial lesions | ||
| N_HPV: HPV-infected normal cervix | ||
| Esophagus | 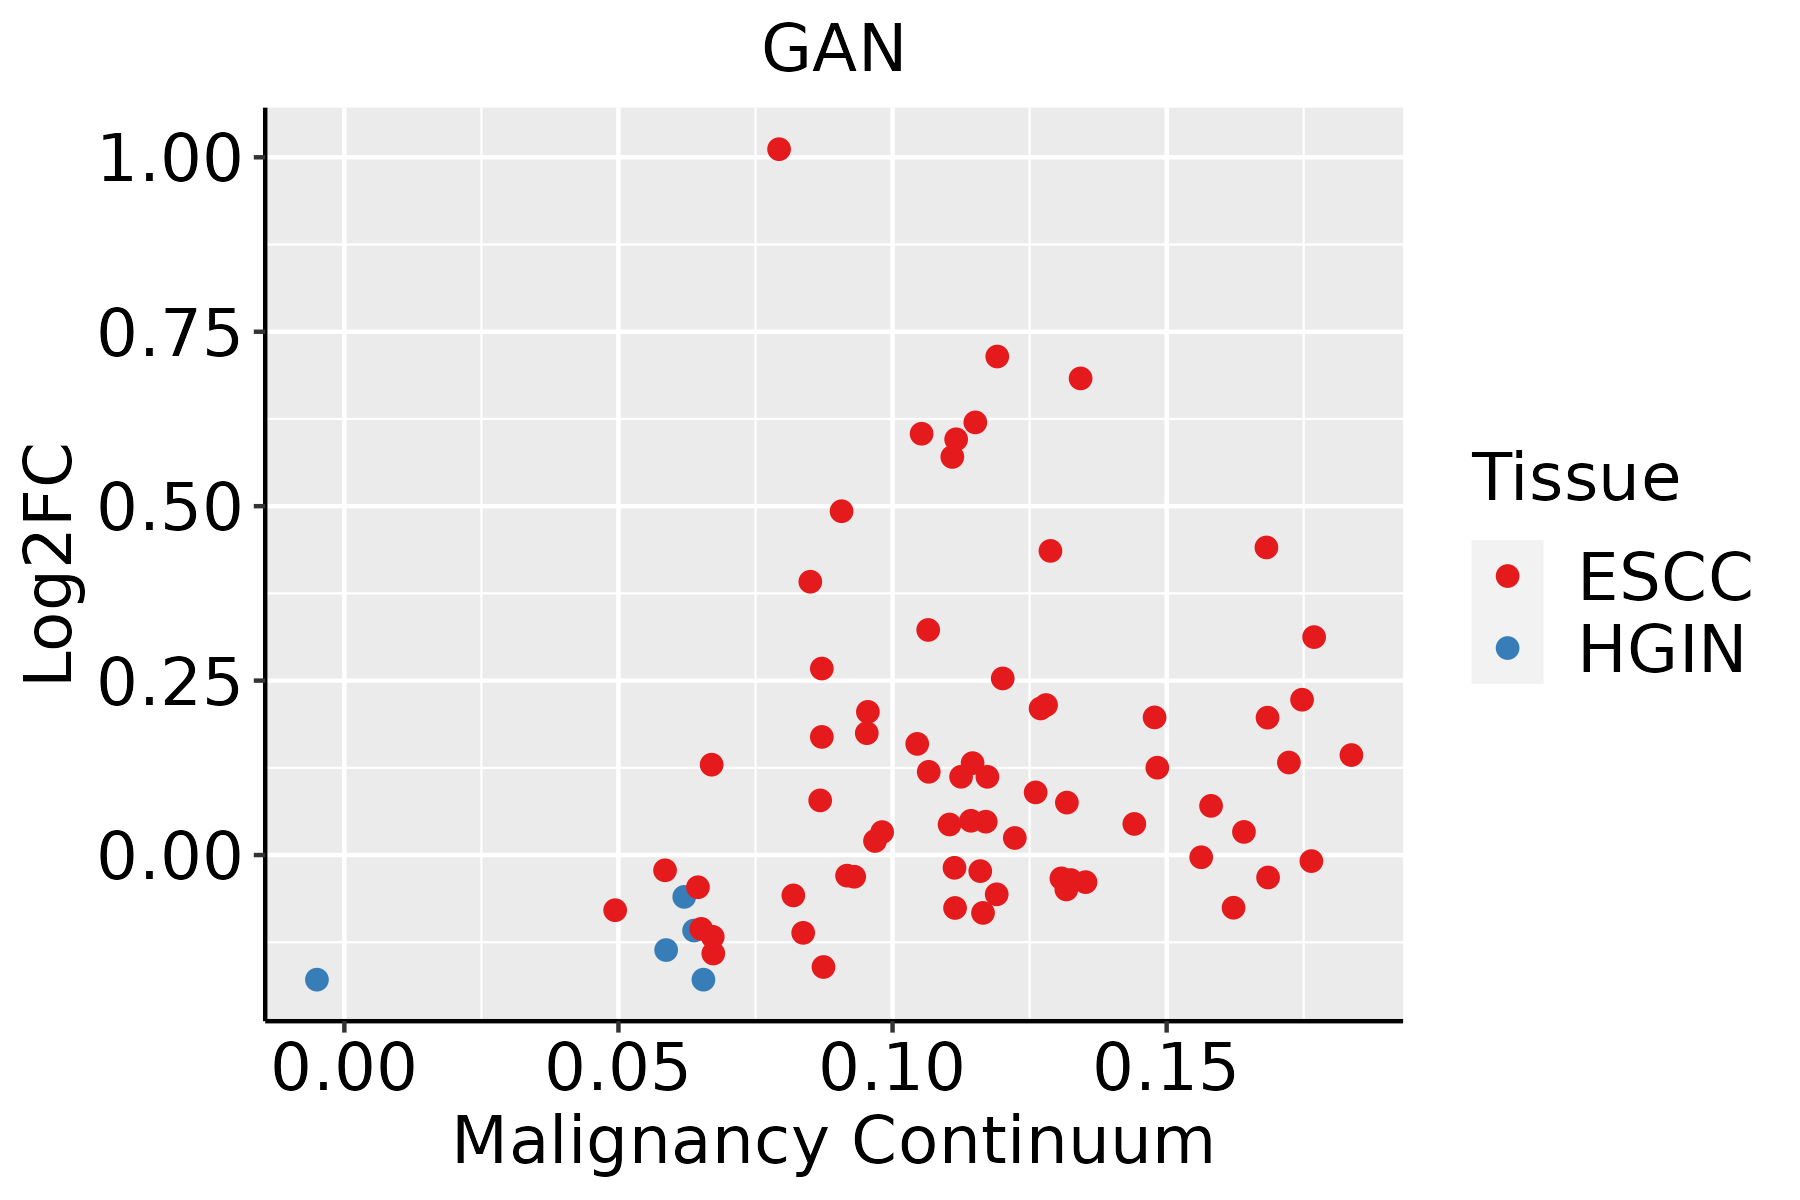 | ESCC: Esophageal squamous cell carcinoma |
| HGIN: High-grade intraepithelial neoplasias | ||
| LGIN: Low-grade intraepithelial neoplasias | ||
| Oral Cavity | 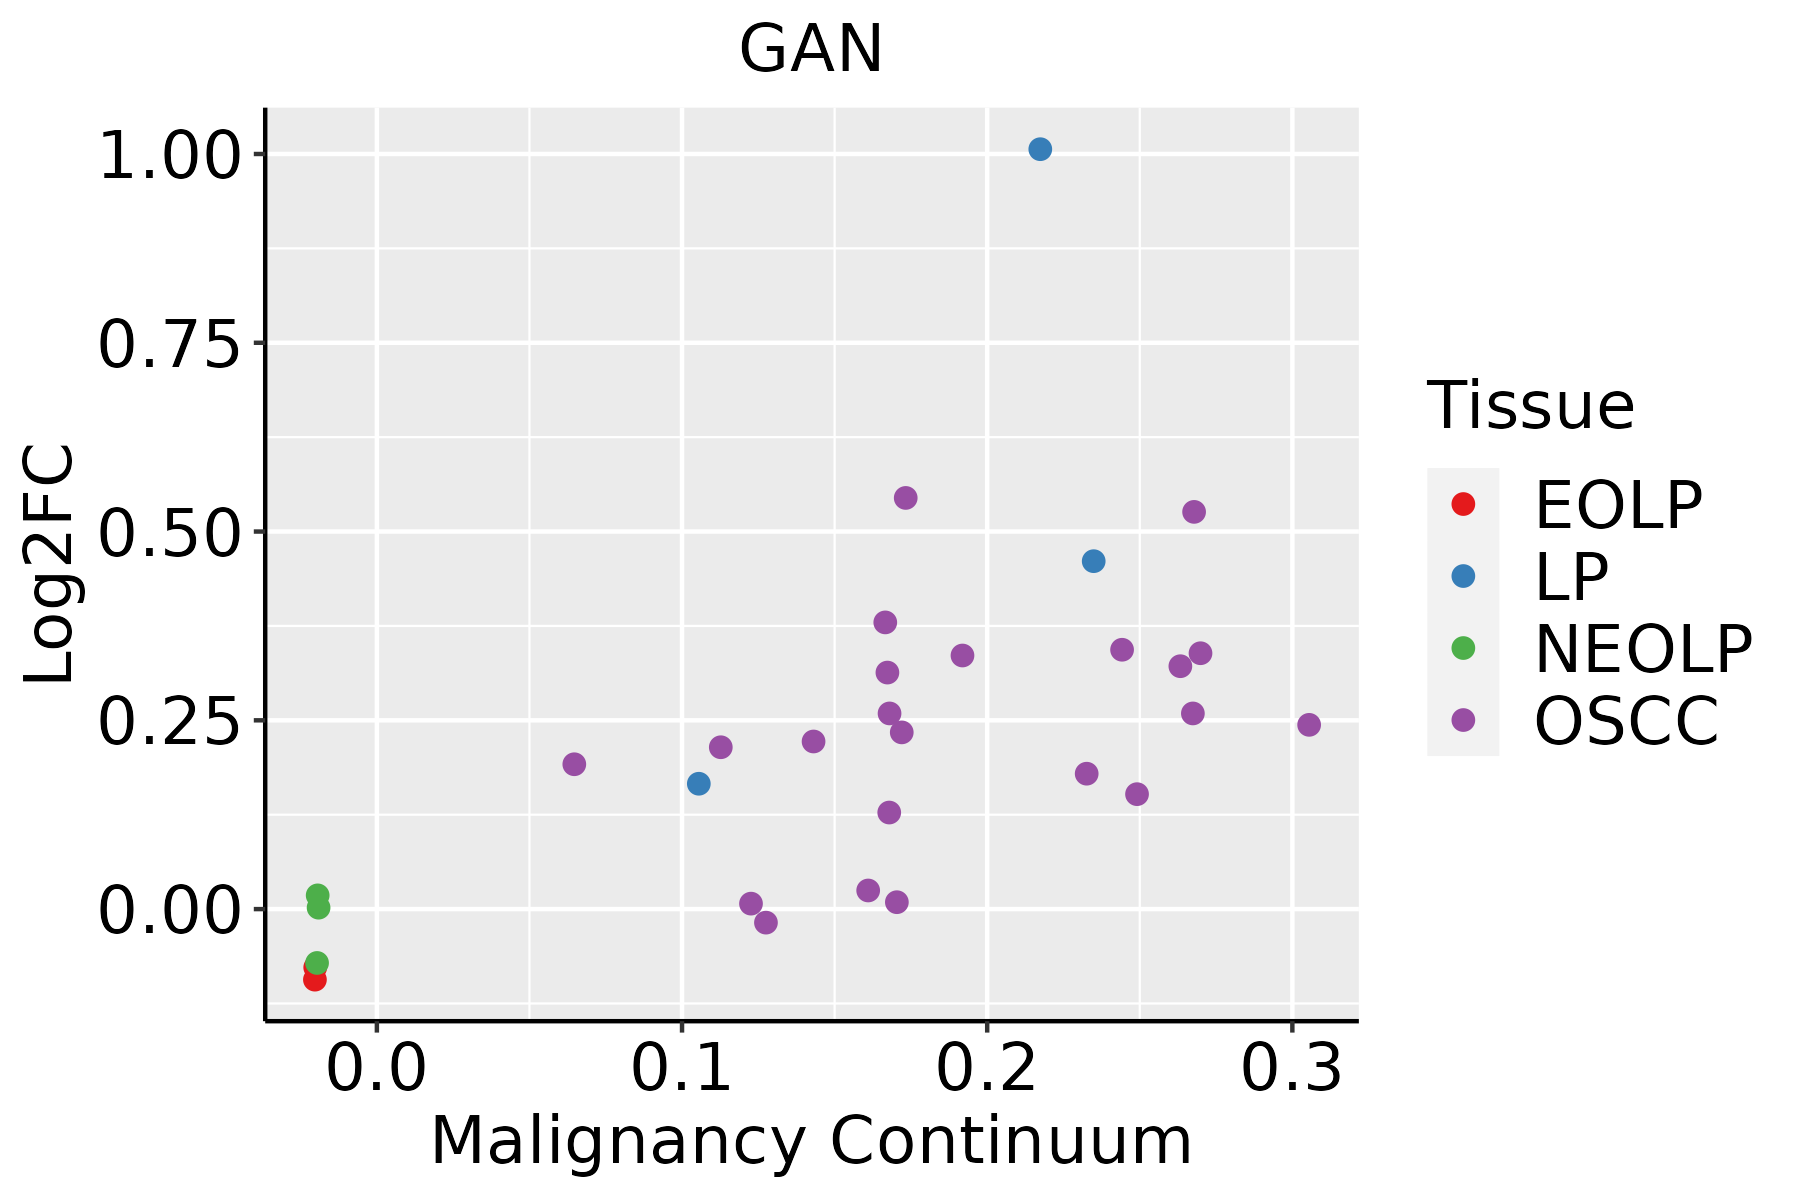 | EOLP: Erosive Oral lichen planus |
| LP: leukoplakia | ||
| NEOLP: Non-erosive oral lichen planus | ||
| OSCC: Oral squamous cell carcinoma | ||
| Skin |  | AK: Actinic keratosis |
| cSCC: Cutaneous squamous cell carcinoma | ||
| SCCIS:squamous cell carcinoma in situ |
| ∗log2FC in expression of this searched gene in stem-like cells from each diseased tissue sample relative to stem-like cells in normal samples in each tissue plotted against the malignancy continuum. Samples are colored based on if they are from different disease stage. |
Top |
Malignant transformation related pathway analysis |
| Find out the enriched GO biological processes and KEGG pathways involved in transition from healthy to precancer to cancer |
| Tissue | Disease Stage | Enriched GO biological Processes |
| Colorectum | AD |  |
| Colorectum | SER |  |
| Colorectum | MSS |  |
| Colorectum | MSI-H |  |
| Colorectum | FAP |  |
| ∗Top 15 enriched GO BP terms are showed in the bar plot of each disease state in each tissue. Each row represents a significant GO biological process which is colored according to the -log10(p.adjust). |
| Page: 1 2 3 4 5 6 7 8 9 |
| GO ID | Tissue | Disease Stage | Description | Gene Ratio | Bg Ratio | pvalue | p.adjust | Count |
| GO:00091002 | Esophagus | ESCC | glycoprotein metabolic process | 226/8552 | 387/18723 | 2.64e-07 | 3.94e-06 | 226 |
| GO:00442626 | Esophagus | ESCC | cellular carbohydrate metabolic process | 160/8552 | 283/18723 | 1.43e-04 | 9.66e-04 | 160 |
| GO:0009100 | Liver | HCC | glycoprotein metabolic process | 193/7958 | 387/18723 | 1.89e-03 | 9.62e-03 | 193 |
| GO:00091001 | Oral cavity | OSCC | glycoprotein metabolic process | 185/7305 | 387/18723 | 2.37e-04 | 1.54e-03 | 185 |
| GO:00442625 | Oral cavity | OSCC | cellular carbohydrate metabolic process | 130/7305 | 283/18723 | 9.98e-03 | 3.49e-02 | 130 |
| GO:00091003 | Thyroid | PTC | glycoprotein metabolic process | 147/5968 | 387/18723 | 5.87e-03 | 2.64e-02 | 147 |
| GO:000910011 | Thyroid | ATC | glycoprotein metabolic process | 153/6293 | 387/18723 | 7.90e-03 | 3.06e-02 | 153 |
| Page: 1 |
| Pathway ID | Tissue | Disease Stage | Description | Gene Ratio | Bg Ratio | pvalue | p.adjust | qvalue | Count |
| Page: 1 |
Top |
Cell-cell communication analysis |
| Identification of potential cell-cell interactions between two cell types and their ligand-receptor pairs for different disease states |
| Ligand | Receptor | LRpair | Pathway | Tissue | Disease Stage |
| Page: 1 |
Top |
Single-cell gene regulatory network inference analysis |
| Find out the significant the regulons (TFs) and the target genes of each regulon across cell types for different disease states |
| TF | Cell Type | Tissue | Disease Stage | Target Gene | RSS | Regulon Activity |
| ∗The dot plots of a searched regulon are shown for all cell subpopulations in each disease state of each tissue based on the regulon specific score inferred using pySCENIC and by calculating the average expression. |
| Page: 1 |
Top |
Somatic mutation of malignant transformation related genes |
| Annotation of somatic variants for genes involved in malignant transformation |
| Hugo Symbol | Variant Class | Variant Classification | dbSNP RS | HGVSc | HGVSp | HGVSp Short | SWISSPROT | BIOTYPE | SIFT | PolyPhen | Tumor Sample Barcode | Tissue | Histology | Sex | Age | Stage | Therapy Types | Drugs | Outcome |
| GAN | SNV | Missense_Mutation | rs779203584 | c.1055A>G | p.Asn352Ser | p.N352S | Q9H2C0 | protein_coding | deleterious(0.01) | probably_damaging(0.996) | TCGA-WA-A7H4-01 | Oral cavity | head & neck squamous cell carcinoma | Male | >=65 | I/II | Unknown | Unknown | SD |
| GAN | insertion | Frame_Shift_Ins | novel | c.1166_1167insATTCATACACTTAATAAAAA | p.Ser390PhefsTer25 | p.S390Ffs*25 | Q9H2C0 | protein_coding | TCGA-CV-A45U-01 | Oral cavity | head & neck squamous cell carcinoma | Male | <65 | I/II | Unknown | Unknown | PD | ||
| GAN | SNV | Missense_Mutation | c.652N>T | p.Met218Leu | p.M218L | Q9H2C0 | protein_coding | tolerated(0.53) | benign(0) | TCGA-G9-7510-01 | Prostate | prostate adenocarcinoma | Male | >=65 | 8 | Unknown | Unknown | SD | |
| GAN | SNV | Missense_Mutation | c.385A>G | p.Ile129Val | p.I129V | Q9H2C0 | protein_coding | deleterious(0) | possibly_damaging(0.761) | TCGA-BR-8372-01 | Stomach | stomach adenocarcinoma | Male | <65 | III/IV | Chemotherapy | etoposide | CR | |
| GAN | SNV | Missense_Mutation | c.493N>G | p.Ser165Gly | p.S165G | Q9H2C0 | protein_coding | tolerated(0.07) | benign(0.023) | TCGA-CD-A4MG-01 | Stomach | stomach adenocarcinoma | Male | >=65 | I/II | Unknown | Unknown | PD | |
| GAN | SNV | Missense_Mutation | rs780683261 | c.1723N>G | p.Ile575Val | p.I575V | Q9H2C0 | protein_coding | deleterious(0.01) | benign(0.115) | TCGA-CG-5721-01 | Stomach | stomach adenocarcinoma | Male | <65 | III/IV | Unknown | Unknown | SD |
| GAN | SNV | Missense_Mutation | c.1421G>T | p.Gly474Val | p.G474V | Q9H2C0 | protein_coding | deleterious(0) | probably_damaging(0.984) | TCGA-FP-A4BE-01 | Stomach | stomach adenocarcinoma | Male | <65 | I/II | Chemotherapy | 5-fluorouracil | CR | |
| GAN | SNV | Missense_Mutation | rs749359745 | c.751N>G | p.Ile251Val | p.I251V | Q9H2C0 | protein_coding | tolerated(0.46) | benign(0.013) | TCGA-HJ-7597-01 | Stomach | stomach adenocarcinoma | Female | >=65 | I/II | Chemotherapy | fluorouracil | CR |
| GAN | SNV | Missense_Mutation | novel | c.358N>A | p.Leu120Met | p.L120M | Q9H2C0 | protein_coding | deleterious(0.03) | probably_damaging(0.909) | TCGA-VQ-A924-01 | Stomach | stomach adenocarcinoma | Male | >=65 | I/II | Unknown | Unknown | PD |
| GAN | insertion | Frame_Shift_Ins | novel | c.1166_1167insATTCATACACTTAATAAAAA | p.Ser390PhefsTer25 | p.S390Ffs*25 | Q9H2C0 | protein_coding | TCGA-DJ-A3VL-01 | Thyroid | thyroid carcinoma | Male | <65 | I/II | Unknown | Unknown | PD |
| Page: 1 2 3 4 5 6 7 8 |
Top |
Related drugs of malignant transformation related genes |
| Identification of chemicals and drugs interact with genes involved in malignant transfromation |
| (DGIdb 4.0) |
| Entrez ID | Symbol | Category | Interaction Types | Drug Claim Name | Drug Name | PMIDs |
| Page: 1 |

Copyright 2023-Present -The University of Texas Health Science Center at Houston |