
|
|||||
|
 | |
| |
| |
| |
| |
| |
|
Gene: ZNF83 |
Gene summary for ZNF83 |
| Gene information | Species | Human | Gene symbol | ZNF83 | Gene ID | 55769 |
| Gene name | zinc finger protein 83 | |
| Gene Alias | HPF1 | |
| Cytomap | 19q13.41 | |
| Gene Type | protein-coding | GO ID | GO:0006139 | UniProtAcc | A0A024R4L3 |
Top |
Malignant transformation analysis |
| Identification of the aberrant gene expression in precancerous and cancerous lesions by comparing the gene expression of stem-like cells in diseased tissues with normal stem cells |
| Entrez ID | Symbol | Replicates | Species | Organ | Tissue | Adj P-value | Log2FC | Malignancy |
| 55769 | ZNF83 | CA_HPV_1 | Human | Cervix | CC | 1.05e-02 | -1.58e-01 | 0.0264 |
| 55769 | ZNF83 | CCI_1 | Human | Cervix | CC | 8.16e-08 | 1.05e+00 | 0.528 |
| 55769 | ZNF83 | CCI_3 | Human | Cervix | CC | 3.94e-02 | 5.14e-01 | 0.516 |
| 55769 | ZNF83 | Tumor | Human | Cervix | CC | 1.49e-03 | -2.04e-01 | 0.1241 |
| 55769 | ZNF83 | P2T-E | Human | Esophagus | ESCC | 1.11e-16 | 1.64e-01 | 0.1177 |
| 55769 | ZNF83 | P4T-E | Human | Esophagus | ESCC | 6.14e-15 | 2.60e-01 | 0.1323 |
| 55769 | ZNF83 | P8T-E | Human | Esophagus | ESCC | 1.73e-25 | 3.97e-01 | 0.0889 |
| 55769 | ZNF83 | P10T-E | Human | Esophagus | ESCC | 1.41e-21 | 3.83e-01 | 0.116 |
| 55769 | ZNF83 | P11T-E | Human | Esophagus | ESCC | 3.86e-11 | 3.66e-01 | 0.1426 |
| 55769 | ZNF83 | P12T-E | Human | Esophagus | ESCC | 6.48e-12 | 2.48e-01 | 0.1122 |
| 55769 | ZNF83 | P16T-E | Human | Esophagus | ESCC | 1.32e-08 | 1.03e-01 | 0.1153 |
| 55769 | ZNF83 | P17T-E | Human | Esophagus | ESCC | 3.51e-03 | 2.55e-01 | 0.1278 |
| 55769 | ZNF83 | P21T-E | Human | Esophagus | ESCC | 3.64e-12 | 1.68e-01 | 0.1617 |
| 55769 | ZNF83 | P22T-E | Human | Esophagus | ESCC | 2.16e-17 | 2.50e-01 | 0.1236 |
| 55769 | ZNF83 | P24T-E | Human | Esophagus | ESCC | 5.72e-11 | 2.10e-01 | 0.1287 |
| 55769 | ZNF83 | P26T-E | Human | Esophagus | ESCC | 5.90e-14 | 2.53e-01 | 0.1276 |
| 55769 | ZNF83 | P27T-E | Human | Esophagus | ESCC | 1.21e-13 | 1.95e-01 | 0.1055 |
| 55769 | ZNF83 | P30T-E | Human | Esophagus | ESCC | 8.80e-09 | 3.41e-01 | 0.137 |
| 55769 | ZNF83 | P31T-E | Human | Esophagus | ESCC | 1.01e-12 | 1.21e-01 | 0.1251 |
| 55769 | ZNF83 | P36T-E | Human | Esophagus | ESCC | 1.23e-04 | 2.72e-01 | 0.1187 |
| Page: 1 2 3 4 5 |
| Tissue | Expression Dynamics | Abbreviation |
| Cervix | 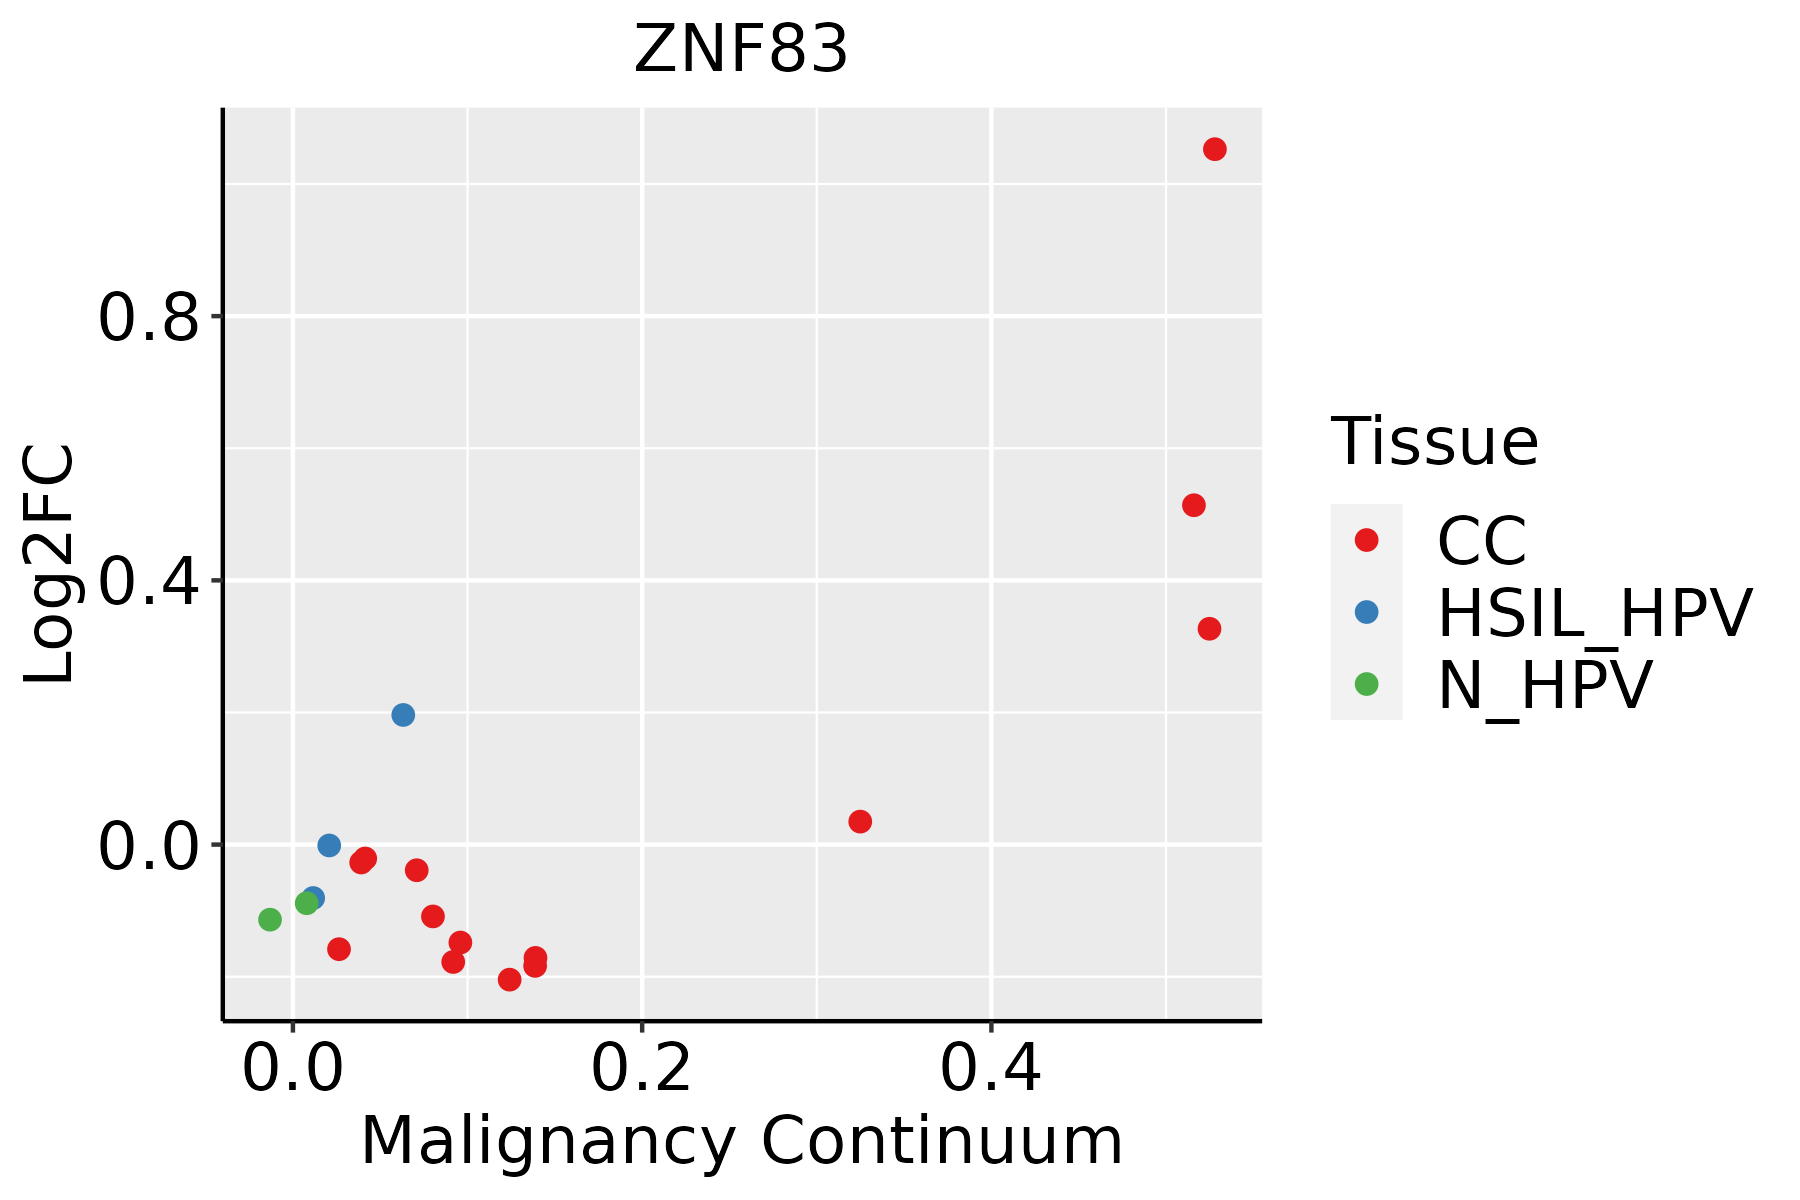 | CC: Cervix cancer |
| HSIL_HPV: HPV-infected high-grade squamous intraepithelial lesions | ||
| N_HPV: HPV-infected normal cervix | ||
| Esophagus |  | ESCC: Esophageal squamous cell carcinoma |
| HGIN: High-grade intraepithelial neoplasias | ||
| LGIN: Low-grade intraepithelial neoplasias | ||
| Liver | 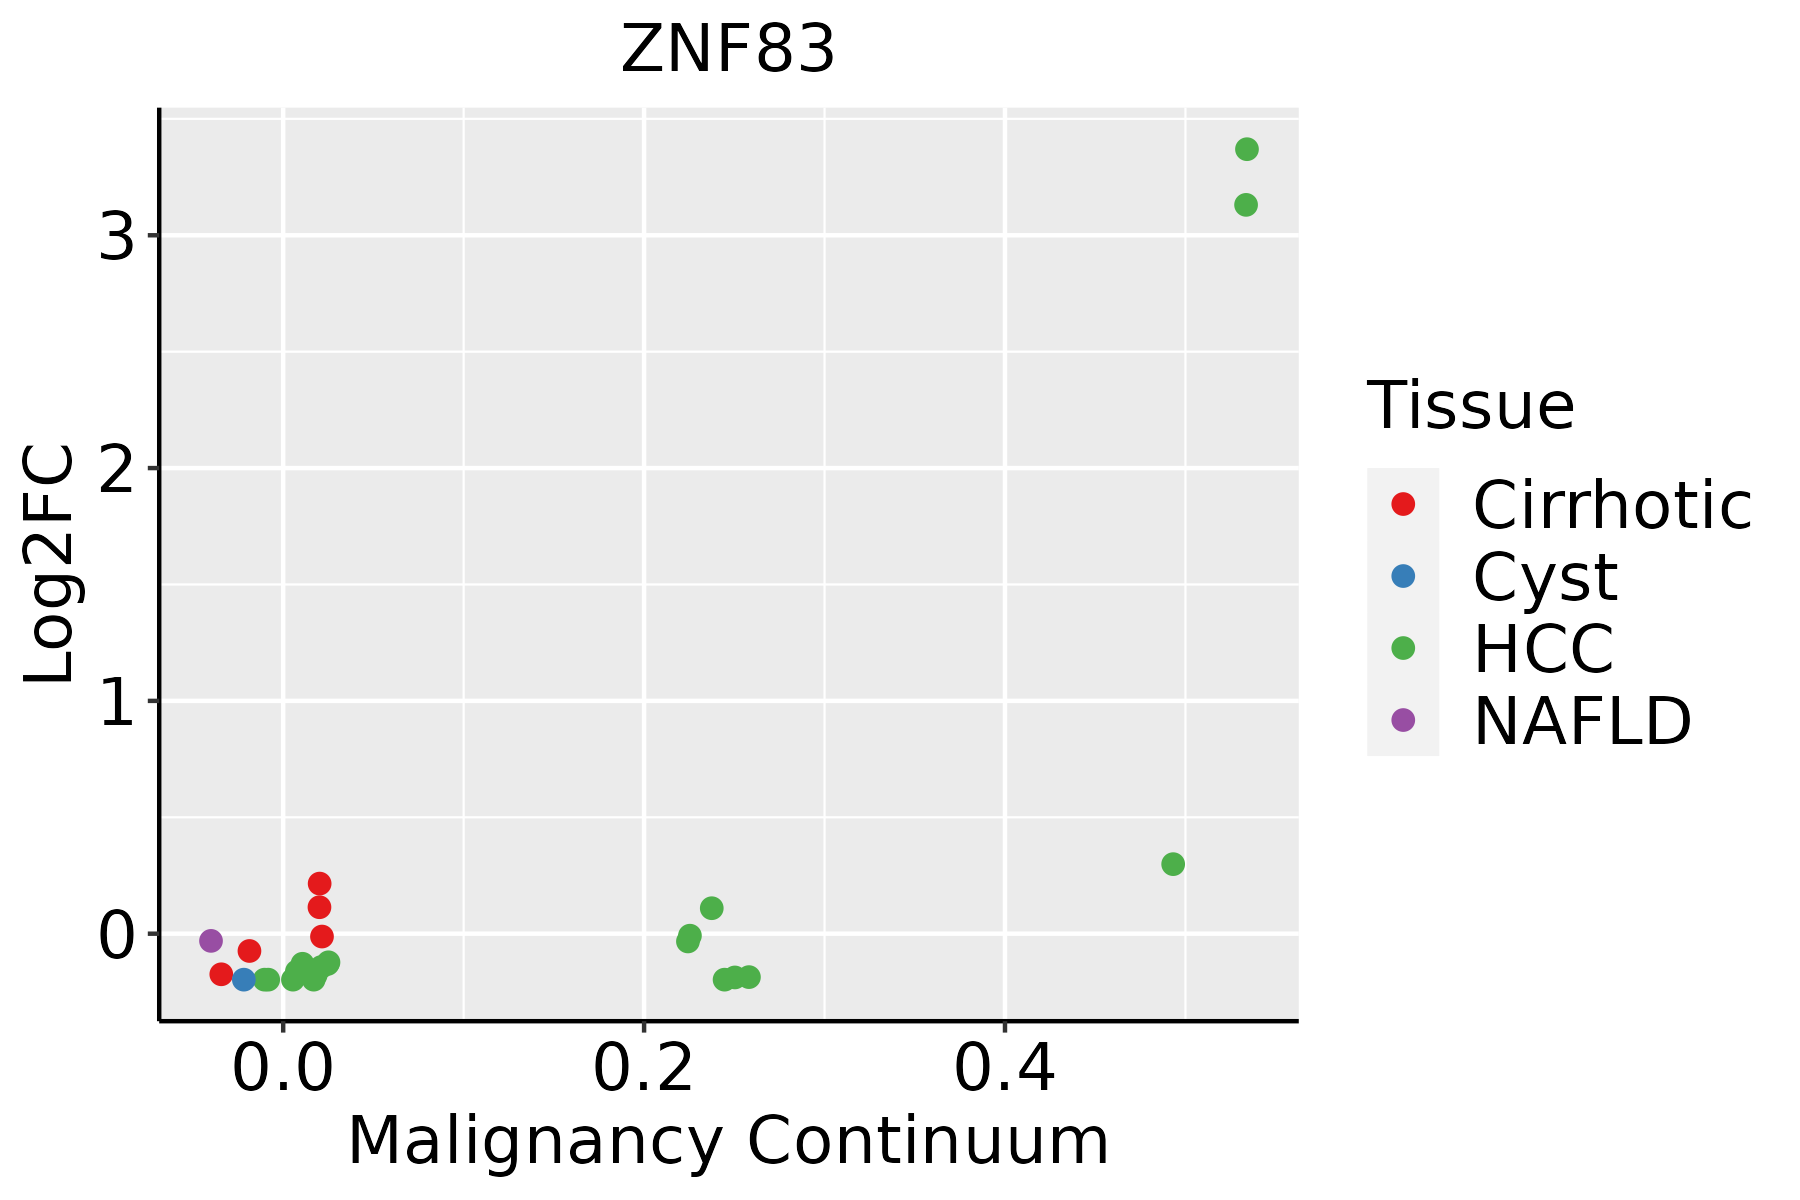 | HCC: Hepatocellular carcinoma |
| NAFLD: Non-alcoholic fatty liver disease | ||
| Lung |  | AAH: Atypical adenomatous hyperplasia |
| AIS: Adenocarcinoma in situ | ||
| IAC: Invasive lung adenocarcinoma | ||
| MIA: Minimally invasive adenocarcinoma | ||
| Prostate | 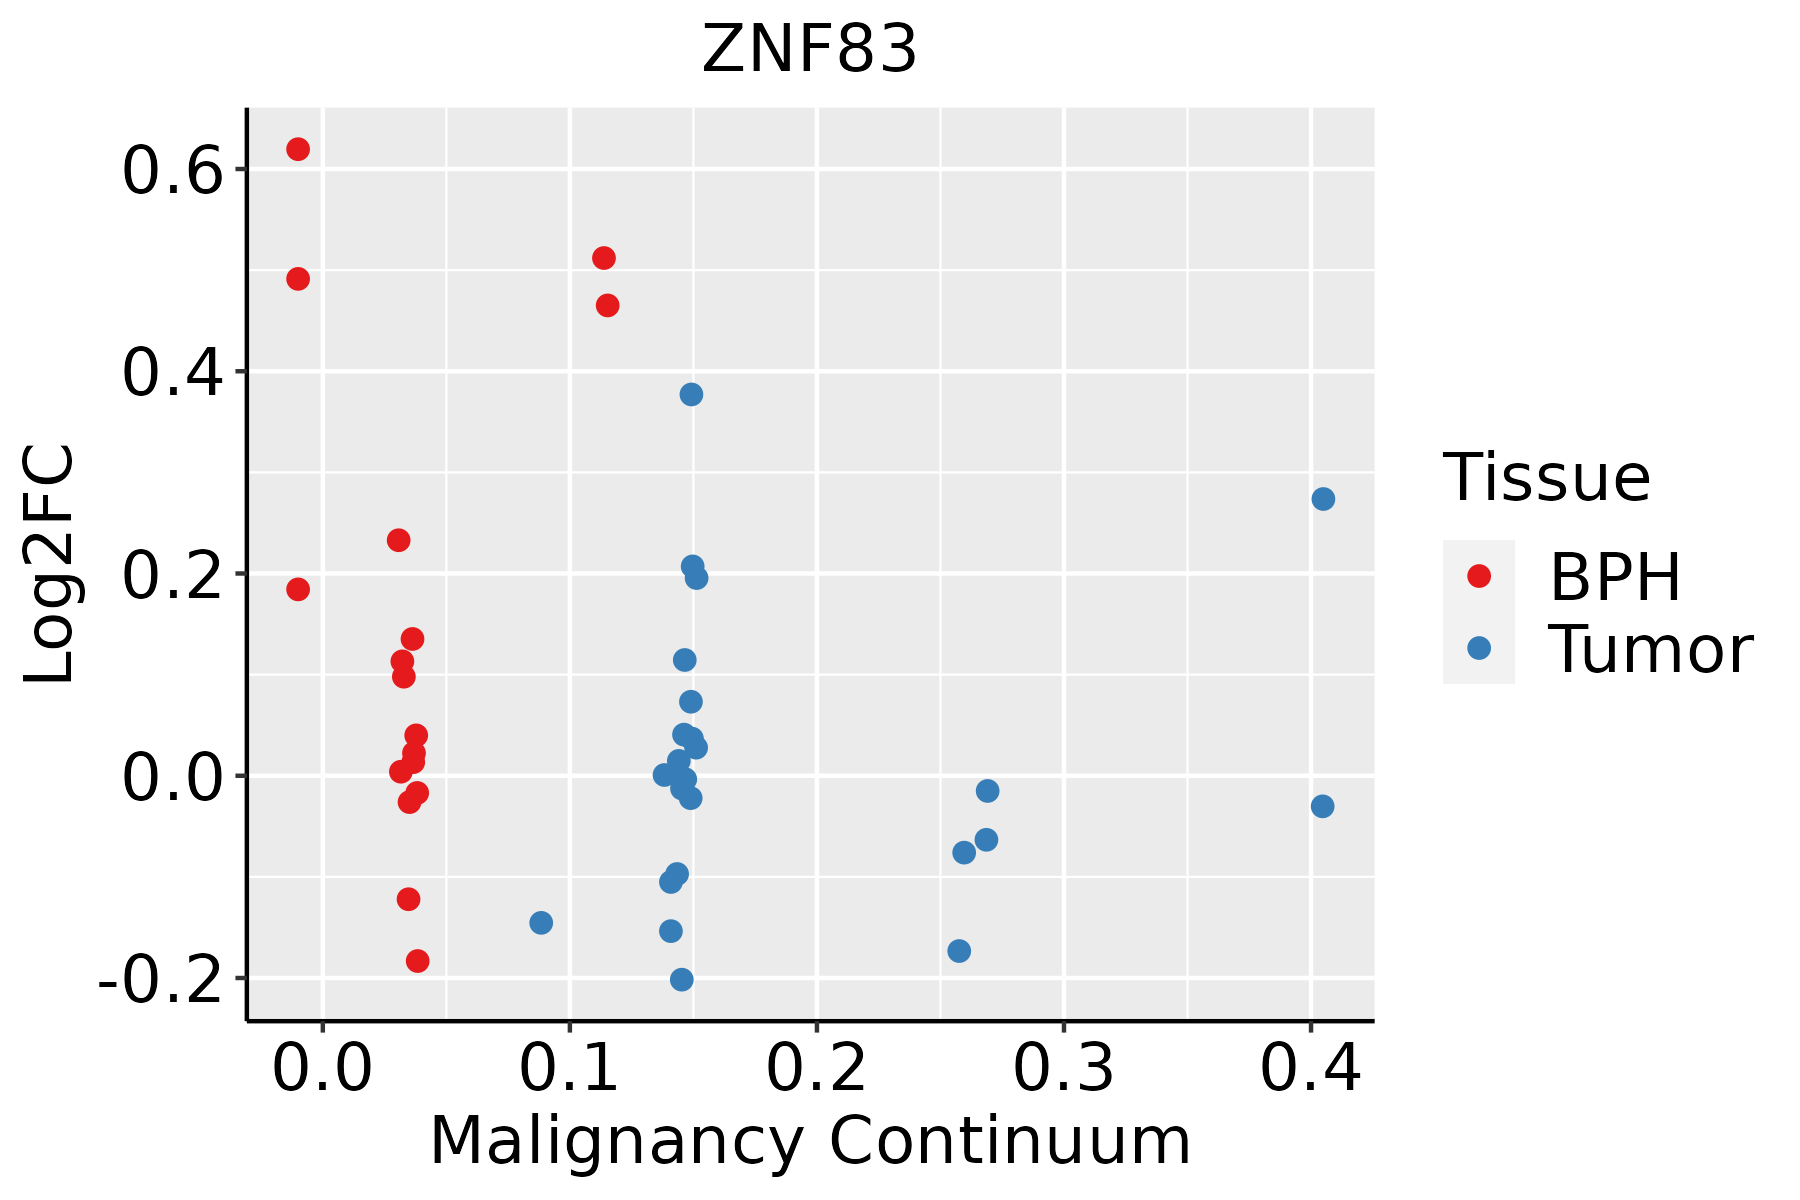 | BPH: Benign Prostatic Hyperplasia |
| Thyroid | 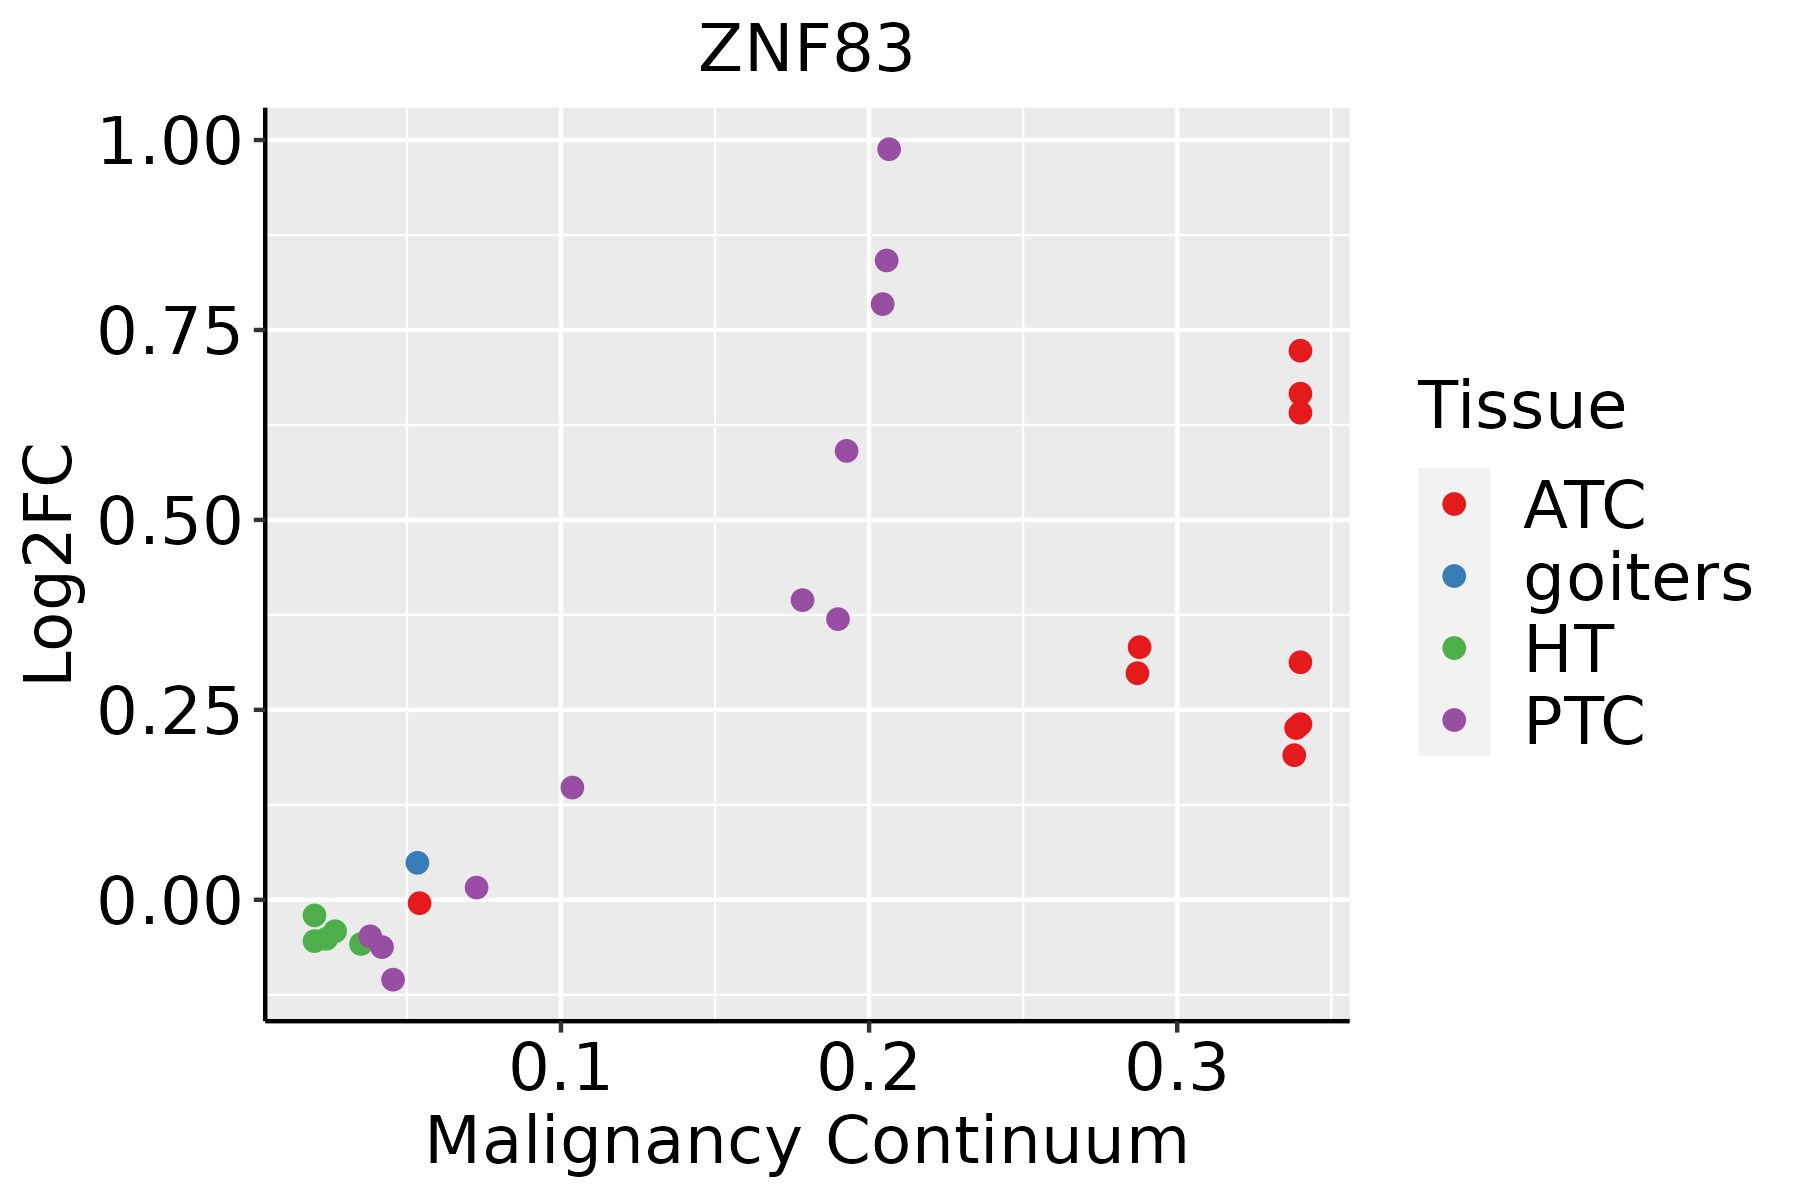 | ATC: Anaplastic thyroid cancer |
| HT: Hashimoto's thyroiditis | ||
| PTC: Papillary thyroid cancer |
| ∗log2FC in expression of this searched gene in stem-like cells from each diseased tissue sample relative to stem-like cells in normal samples in each tissue plotted against the malignancy continuum. Samples are colored based on if they are from different disease stage. |
Top |
Malignant transformation related pathway analysis |
| Find out the enriched GO biological processes and KEGG pathways involved in transition from healthy to precancer to cancer |
| Tissue | Disease Stage | Enriched GO biological Processes |
| Colorectum | AD |  |
| Colorectum | SER |  |
| Colorectum | MSS |  |
| Colorectum | MSI-H |  |
| Colorectum | FAP |  |
| ∗Top 15 enriched GO BP terms are showed in the bar plot of each disease state in each tissue. Each row represents a significant GO biological process which is colored according to the -log10(p.adjust). |
| Page: 1 2 3 4 5 6 7 8 9 |
| GO ID | Tissue | Disease Stage | Description | Gene Ratio | Bg Ratio | pvalue | p.adjust | Count |
| GO:0008380111 | Esophagus | ESCC | RNA splicing | 336/8552 | 434/18723 | 1.74e-42 | 3.67e-39 | 336 |
| GO:004477216 | Esophagus | ESCC | mitotic cell cycle phase transition | 281/8552 | 424/18723 | 4.63e-18 | 4.45e-16 | 281 |
| GO:000734615 | Esophagus | ESCC | regulation of mitotic cell cycle | 293/8552 | 457/18723 | 8.00e-16 | 5.64e-14 | 293 |
| GO:000170119 | Esophagus | ESCC | in utero embryonic development | 243/8552 | 367/18723 | 1.00e-15 | 6.86e-14 | 243 |
| GO:00062604 | Esophagus | ESCC | DNA replication | 181/8552 | 260/18723 | 3.55e-15 | 2.05e-13 | 181 |
| GO:190198713 | Esophagus | ESCC | regulation of cell cycle phase transition | 242/8552 | 390/18723 | 3.86e-11 | 1.26e-09 | 242 |
| GO:190199013 | Esophagus | ESCC | regulation of mitotic cell cycle phase transition | 191/8552 | 299/18723 | 1.35e-10 | 3.94e-09 | 191 |
| GO:00457865 | Esophagus | ESCC | negative regulation of cell cycle | 236/8552 | 385/18723 | 3.62e-10 | 9.93e-09 | 236 |
| GO:00000754 | Esophagus | ESCC | cell cycle checkpoint | 117/8552 | 169/18723 | 4.47e-10 | 1.17e-08 | 117 |
| GO:004277014 | Esophagus | ESCC | signal transduction in response to DNA damage | 117/8552 | 172/18723 | 2.38e-09 | 5.32e-08 | 117 |
| GO:00448394 | Esophagus | ESCC | cell cycle G2/M phase transition | 103/8552 | 148/18723 | 3.09e-09 | 6.67e-08 | 103 |
| GO:00000864 | Esophagus | ESCC | G2/M transition of mitotic cell cycle | 96/8552 | 137/18723 | 6.00e-09 | 1.23e-07 | 96 |
| GO:00070934 | Esophagus | ESCC | mitotic cell cycle checkpoint | 90/8552 | 129/18723 | 2.49e-08 | 4.69e-07 | 90 |
| GO:0061458110 | Esophagus | ESCC | reproductive system development | 247/8552 | 427/18723 | 2.24e-07 | 3.42e-06 | 247 |
| GO:00062612 | Esophagus | ESCC | DNA-dependent DNA replication | 100/8552 | 151/18723 | 2.61e-07 | 3.94e-06 | 100 |
| GO:004860818 | Esophagus | ESCC | reproductive structure development | 245/8552 | 424/18723 | 2.82e-07 | 4.14e-06 | 245 |
| GO:00109484 | Esophagus | ESCC | negative regulation of cell cycle process | 177/8552 | 294/18723 | 3.26e-07 | 4.59e-06 | 177 |
| GO:00315705 | Esophagus | ESCC | DNA integrity checkpoint | 83/8552 | 123/18723 | 8.17e-07 | 1.06e-05 | 83 |
| GO:000182412 | Esophagus | ESCC | blastocyst development | 73/8552 | 106/18723 | 1.13e-06 | 1.40e-05 | 73 |
| GO:00000775 | Esophagus | ESCC | DNA damage checkpoint | 78/8552 | 115/18723 | 1.27e-06 | 1.56e-05 | 78 |
| Page: 1 2 3 4 |
| Pathway ID | Tissue | Disease Stage | Description | Gene Ratio | Bg Ratio | pvalue | p.adjust | qvalue | Count |
| Page: 1 |
Top |
Cell-cell communication analysis |
| Identification of potential cell-cell interactions between two cell types and their ligand-receptor pairs for different disease states |
| Ligand | Receptor | LRpair | Pathway | Tissue | Disease Stage |
| Page: 1 |
Top |
Single-cell gene regulatory network inference analysis |
| Find out the significant the regulons (TFs) and the target genes of each regulon across cell types for different disease states |
| TF | Cell Type | Tissue | Disease Stage | Target Gene | RSS | Regulon Activity |
| ZNF83 | CD8TEREX | Cervix | ADJ | HIST1H3D,HIST1H2BC,SGMS2, etc. | 4.44e-16 |  |
| ZNF83 | CD8TEX | Cervix | CC | HIST1H3D,HIST1H2BC,SGMS2, etc. | 3.05e-03 |  |
| ZNF83 | DC | Cervix | Healthy | HIST1H3D,HIST1H2BC,SGMS2, etc. | 3.63e-02 |  |
| ZNF83 | M2MAC | Cervix | Healthy | HIST1H3D,HIST1H2BC,SGMS2, etc. | 8.76e-03 | |
| ZNF83 | BMEM | Cervix | HSIL_HPV | HIST1H3D,HIST1H2BC,SGMS2, etc. | -4.44e-16 |  |
| ZNF83 | MAST | Cervix | N_HPV | HIST1H3D,HIST1H2BC,SGMS2, etc. | 4.79e-03 |  |
| ZNF83 | M1MAC | Cervix | N_HPV | HIST1H3D,HIST1H2BC,SGMS2, etc. | 0.00e+00 | |
| ZNF83 | MAIT | Cervix | N_HPV | HIST1H3D,HIST1H2BC,SGMS2, etc. | 0.00e+00 | |
| ZNF83 | MVA | Colorectum | ADJ | OTUD7A,NUP85,MYO18A, etc. | 1.08e-02 |  |
| ZNF83 | ICAF | Colorectum | Healthy | OTUD7A,NUP85,MYO18A, etc. | 2.76e-02 |  |
| ∗The dot plots of a searched regulon are shown for all cell subpopulations in each disease state of each tissue based on the regulon specific score inferred using pySCENIC and by calculating the average expression. |
| Page: 1 |
Top |
Somatic mutation of malignant transformation related genes |
| Annotation of somatic variants for genes involved in malignant transformation |
| Hugo Symbol | Variant Class | Variant Classification | dbSNP RS | HGVSc | HGVSp | HGVSp Short | SWISSPROT | BIOTYPE | SIFT | PolyPhen | Tumor Sample Barcode | Tissue | Histology | Sex | Age | Stage | Therapy Types | Drugs | Outcome |
| ZNF83 | SNV | Missense_Mutation | novel | c.749A>C | p.Gln250Pro | p.Q250P | P51522 | protein_coding | tolerated(0.26) | possibly_damaging(0.636) | TCGA-VQ-A8PU-01 | Stomach | stomach adenocarcinoma | Female | >=65 | III/IV | Chemotherapy | fluorouracil | CR |
| ZNF83 | deletion | Frame_Shift_Del | rs771347355 | c.399delN | p.Lys133AsnfsTer120 | p.K133Nfs*120 | P51522 | protein_coding | TCGA-BR-8591-01 | Stomach | stomach adenocarcinoma | Male | >=65 | III/IV | Unknown | Unknown | SD |
| Page: 1 2 3 4 5 6 7 |
Top |
Related drugs of malignant transformation related genes |
| Identification of chemicals and drugs interact with genes involved in malignant transfromation |
| (DGIdb 4.0) |
| Entrez ID | Symbol | Category | Interaction Types | Drug Claim Name | Drug Name | PMIDs |
| Page: 1 |

Copyright 2023-Present -The University of Texas Health Science Center at Houston |