
|
|||||
|
 | |
| |
| |
| |
| |
| |
|
Gene: SLC26A2 |
Gene summary for SLC26A2 |
| Gene information | Species | Human | Gene symbol | SLC26A2 | Gene ID | 1836 |
| Gene name | solute carrier family 26 member 2 | |
| Gene Alias | D5S1708 | |
| Cytomap | 5q32 | |
| Gene Type | protein-coding | GO ID | GO:0001503 | UniProtAcc | P50443 |
Top |
Malignant transformation analysis |
| Identification of the aberrant gene expression in precancerous and cancerous lesions by comparing the gene expression of stem-like cells in diseased tissues with normal stem cells |
| Entrez ID | Symbol | Replicates | Species | Organ | Tissue | Adj P-value | Log2FC | Malignancy |
| 1836 | SLC26A2 | HTA11_3410_2000001011 | Human | Colorectum | AD | 1.01e-42 | -1.10e+00 | 0.0155 |
| 1836 | SLC26A2 | HTA11_2487_2000001011 | Human | Colorectum | SER | 1.00e-03 | 5.37e-01 | -0.1808 |
| 1836 | SLC26A2 | HTA11_2951_2000001011 | Human | Colorectum | AD | 2.39e-09 | -1.19e+00 | 0.0216 |
| 1836 | SLC26A2 | HTA11_1938_2000001011 | Human | Colorectum | AD | 1.78e-11 | -6.06e-01 | -0.0811 |
| 1836 | SLC26A2 | HTA11_78_2000001011 | Human | Colorectum | AD | 6.81e-19 | 1.45e+00 | -0.1088 |
| 1836 | SLC26A2 | HTA11_347_2000001011 | Human | Colorectum | AD | 2.98e-29 | 2.65e+00 | -0.1954 |
| 1836 | SLC26A2 | HTA11_411_2000001011 | Human | Colorectum | SER | 1.80e-05 | 5.13e-01 | -0.2602 |
| 1836 | SLC26A2 | HTA11_83_2000001011 | Human | Colorectum | SER | 3.74e-13 | 1.21e+00 | -0.1526 |
| 1836 | SLC26A2 | HTA11_696_2000001011 | Human | Colorectum | AD | 2.03e-14 | 9.52e-01 | -0.1464 |
| 1836 | SLC26A2 | HTA11_866_2000001011 | Human | Colorectum | AD | 9.35e-06 | 5.05e-01 | -0.1001 |
| 1836 | SLC26A2 | HTA11_1391_2000001011 | Human | Colorectum | AD | 1.35e-04 | -3.36e-01 | -0.059 |
| 1836 | SLC26A2 | HTA11_2992_2000001011 | Human | Colorectum | SER | 1.05e-04 | 6.47e-01 | -0.1706 |
| 1836 | SLC26A2 | HTA11_5212_2000001011 | Human | Colorectum | AD | 1.61e-20 | 1.49e+00 | -0.2061 |
| 1836 | SLC26A2 | HTA11_5216_2000001011 | Human | Colorectum | SER | 1.52e-03 | 4.64e-01 | -0.1462 |
| 1836 | SLC26A2 | HTA11_546_2000001011 | Human | Colorectum | AD | 1.21e-07 | 5.59e-01 | -0.0842 |
| 1836 | SLC26A2 | HTA11_7862_2000001011 | Human | Colorectum | AD | 6.80e-03 | -6.60e-01 | -0.0179 |
| 1836 | SLC26A2 | HTA11_866_3004761011 | Human | Colorectum | AD | 1.64e-35 | -1.08e+00 | 0.096 |
| 1836 | SLC26A2 | HTA11_4255_2000001011 | Human | Colorectum | SER | 5.41e-07 | -1.07e+00 | 0.0446 |
| 1836 | SLC26A2 | HTA11_9408_2000001011 | Human | Colorectum | AD | 4.79e-07 | -1.19e+00 | 0.0451 |
| 1836 | SLC26A2 | HTA11_8622_2000001021 | Human | Colorectum | SER | 1.24e-14 | -1.21e+00 | 0.0528 |
| Page: 1 2 3 4 5 6 7 |
| Tissue | Expression Dynamics | Abbreviation |
| Colorectum (GSE201348) |  | FAP: Familial adenomatous polyposis |
| CRC: Colorectal cancer | ||
| Colorectum (HTA11) |  | AD: Adenomas |
| SER: Sessile serrated lesions | ||
| MSI-H: Microsatellite-high colorectal cancer | ||
| MSS: Microsatellite stable colorectal cancer | ||
| Esophagus | 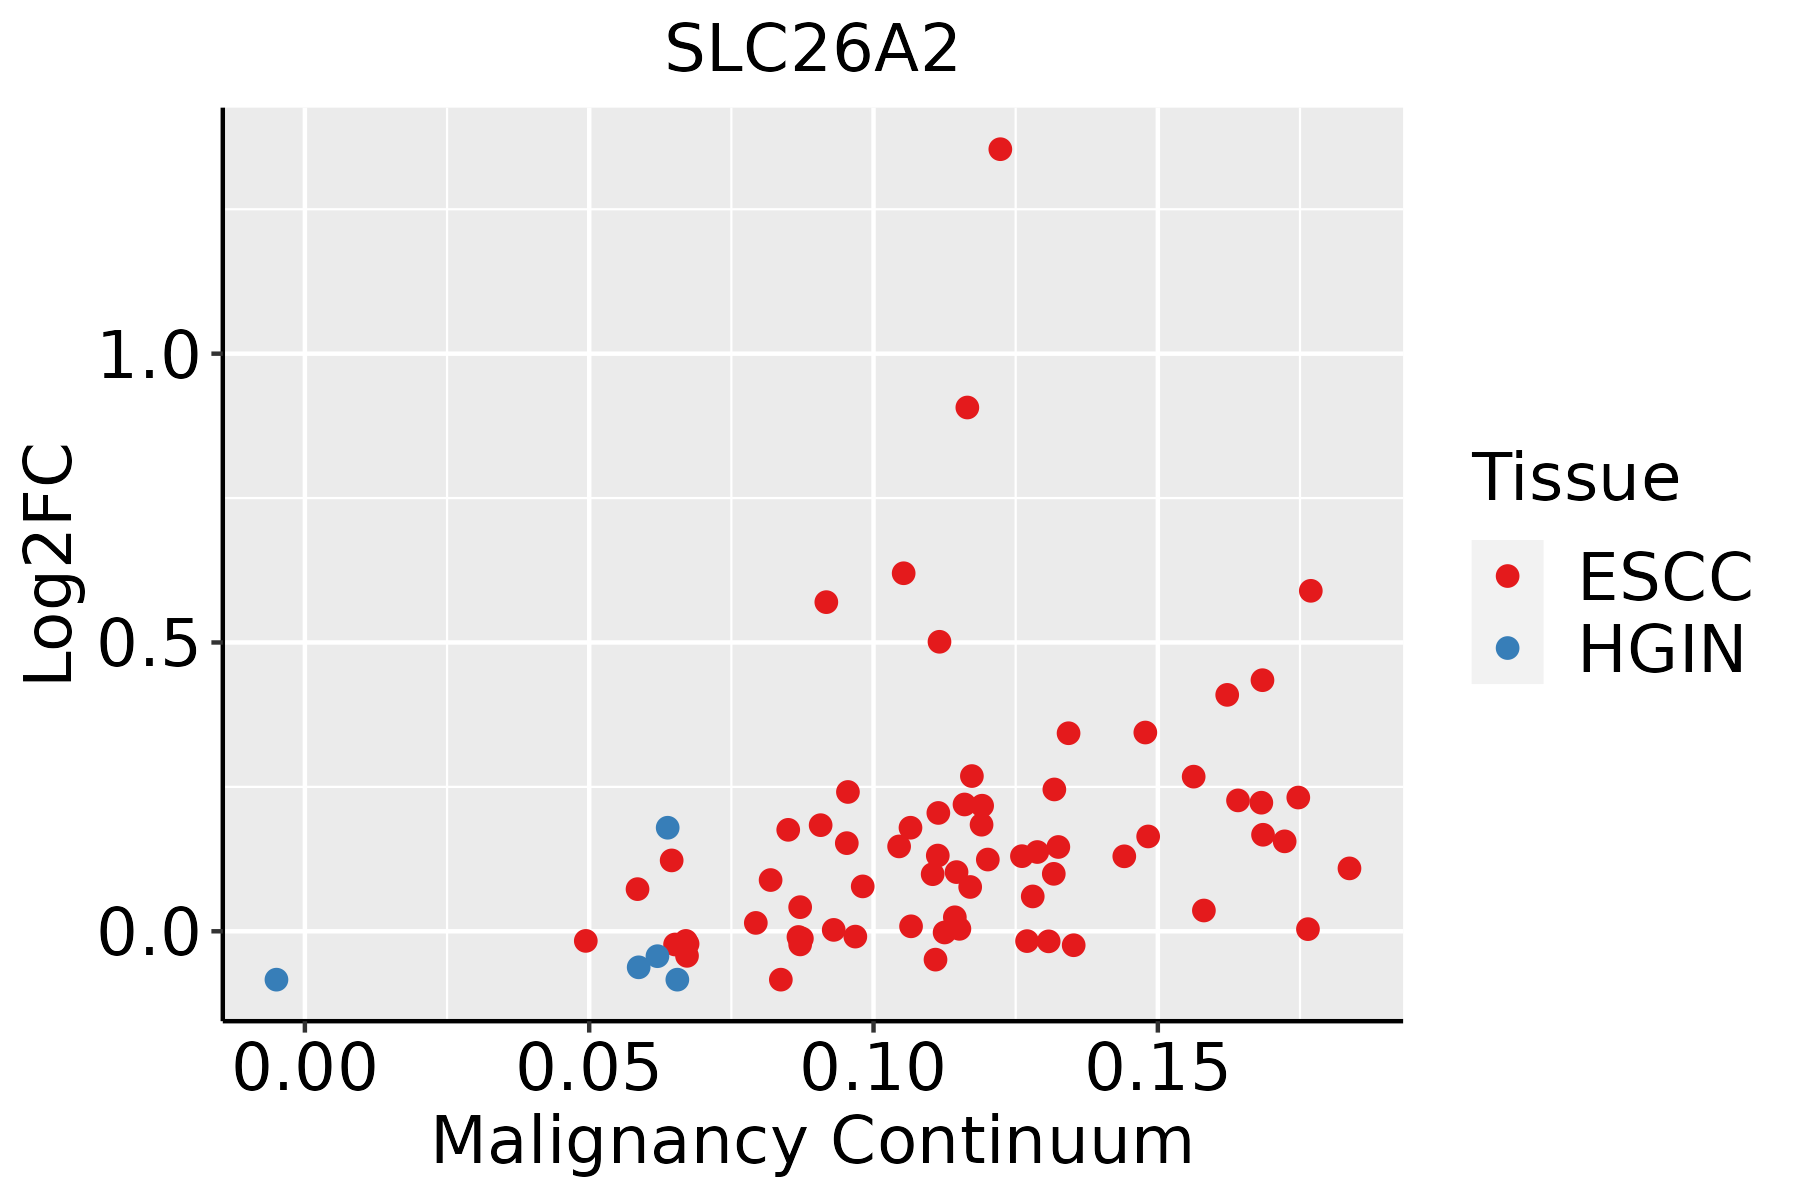 | ESCC: Esophageal squamous cell carcinoma |
| HGIN: High-grade intraepithelial neoplasias | ||
| LGIN: Low-grade intraepithelial neoplasias | ||
| Liver | 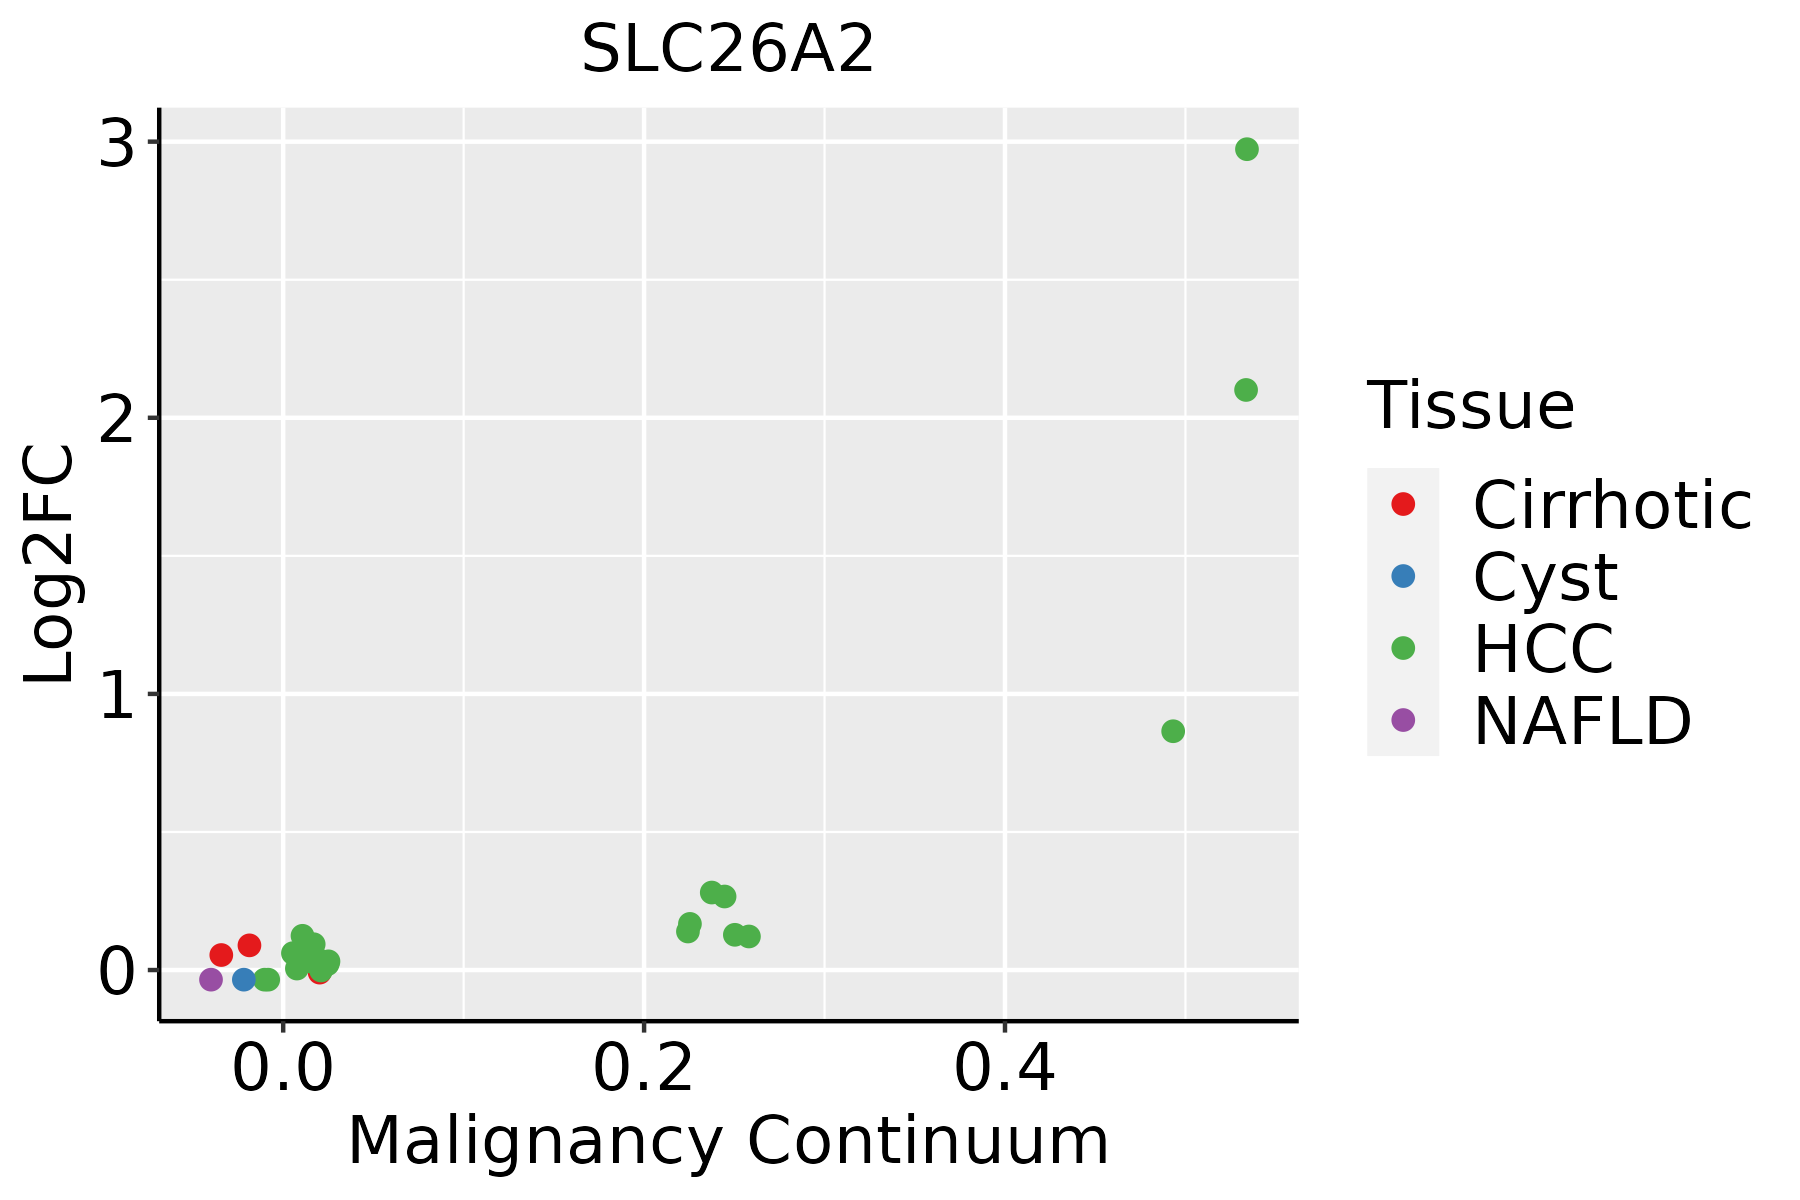 | HCC: Hepatocellular carcinoma |
| NAFLD: Non-alcoholic fatty liver disease | ||
| Oral Cavity |  | EOLP: Erosive Oral lichen planus |
| LP: leukoplakia | ||
| NEOLP: Non-erosive oral lichen planus | ||
| OSCC: Oral squamous cell carcinoma | ||
| Thyroid | 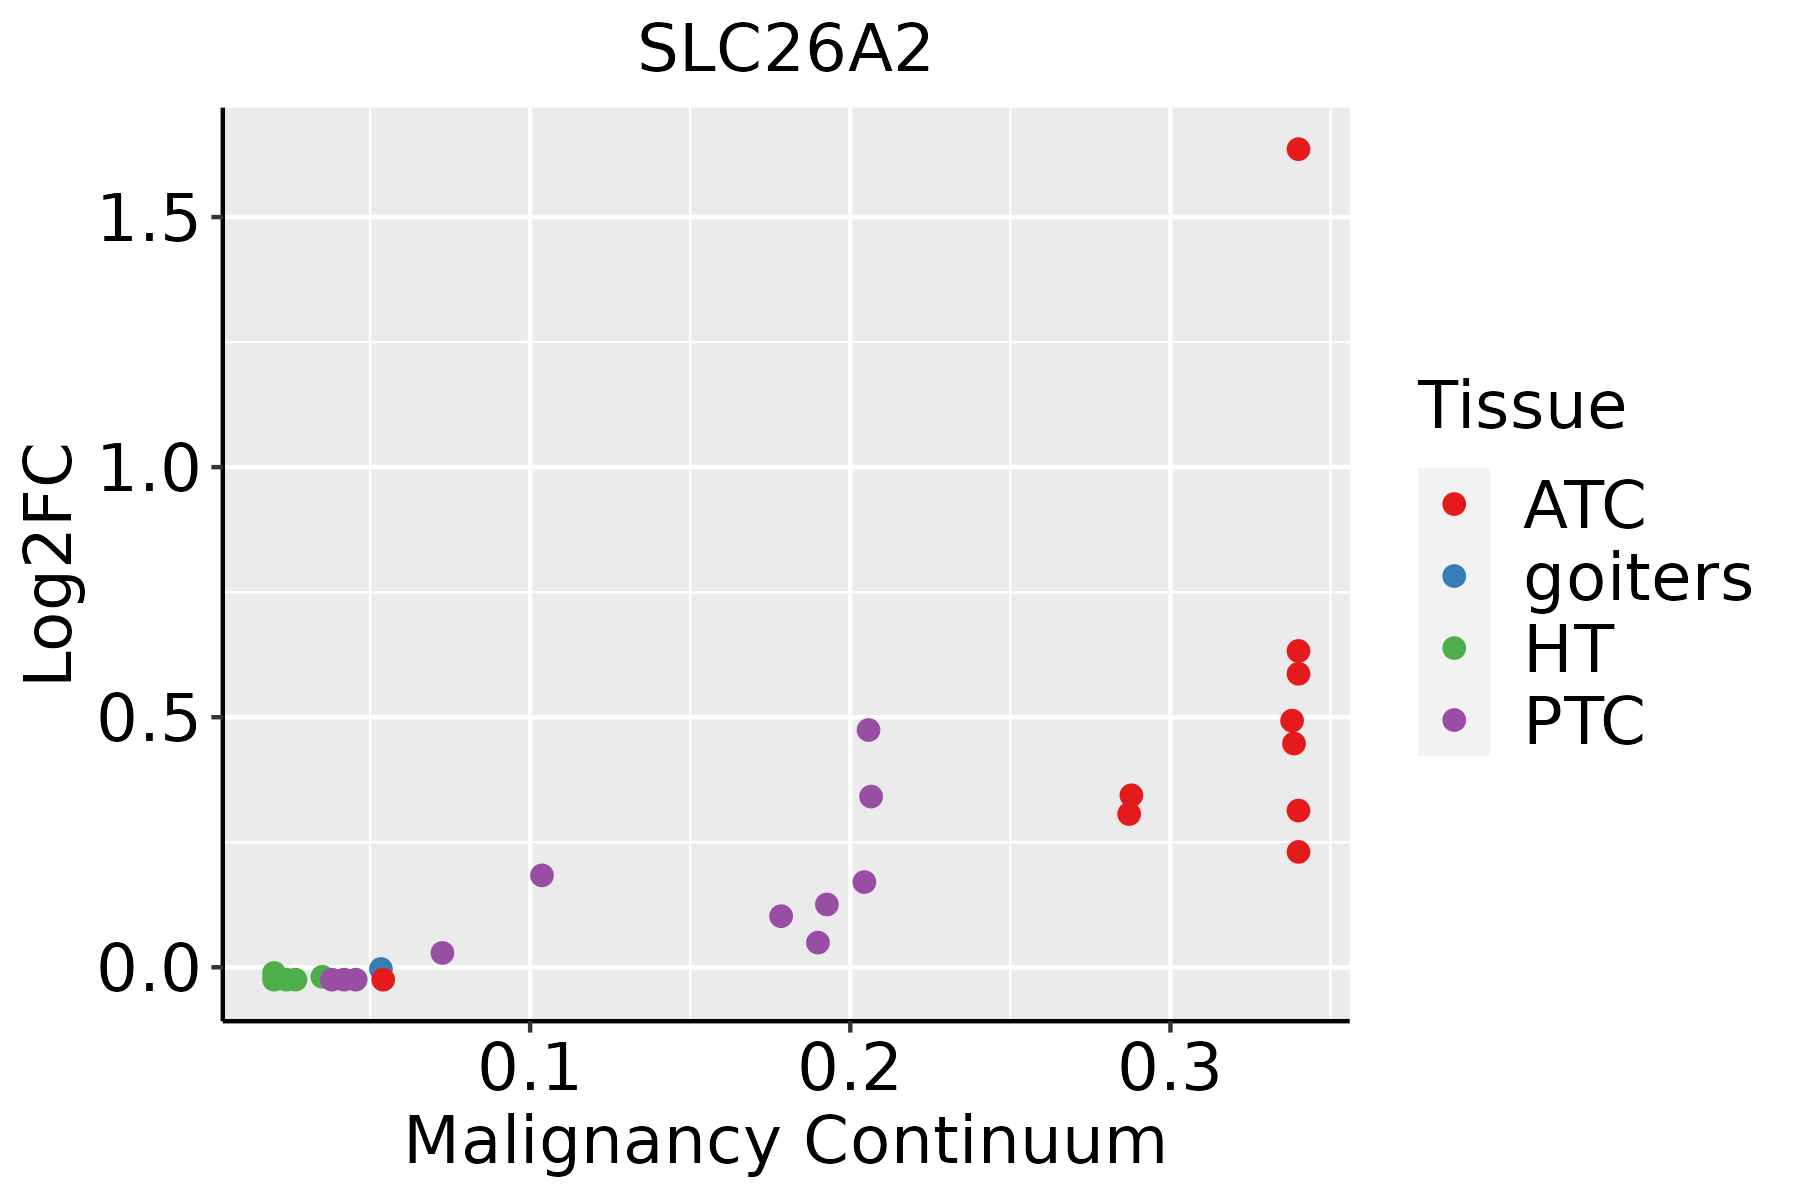 | ATC: Anaplastic thyroid cancer |
| HT: Hashimoto's thyroiditis | ||
| PTC: Papillary thyroid cancer |
| ∗log2FC in expression of this searched gene in stem-like cells from each diseased tissue sample relative to stem-like cells in normal samples in each tissue plotted against the malignancy continuum. Samples are colored based on if they are from different disease stage. |
Top |
Malignant transformation related pathway analysis |
| Find out the enriched GO biological processes and KEGG pathways involved in transition from healthy to precancer to cancer |
| Tissue | Disease Stage | Enriched GO biological Processes |
| Colorectum | AD |  |
| Colorectum | SER |  |
| Colorectum | MSS |  |
| Colorectum | MSI-H |  |
| Colorectum | FAP |  |
| ∗Top 15 enriched GO BP terms are showed in the bar plot of each disease state in each tissue. Each row represents a significant GO biological process which is colored according to the -log10(p.adjust). |
| Page: 1 2 3 4 5 6 7 8 9 |
| GO ID | Tissue | Disease Stage | Description | Gene Ratio | Bg Ratio | pvalue | p.adjust | Count |
| GO:0009150 | Colorectum | AD | purine ribonucleotide metabolic process | 142/3918 | 368/18723 | 4.29e-15 | 1.17e-12 | 142 |
| GO:0006163 | Colorectum | AD | purine nucleotide metabolic process | 149/3918 | 396/18723 | 1.08e-14 | 2.80e-12 | 149 |
| GO:0072521 | Colorectum | AD | purine-containing compound metabolic process | 153/3918 | 416/18723 | 4.34e-14 | 1.01e-11 | 153 |
| GO:0009259 | Colorectum | AD | ribonucleotide metabolic process | 144/3918 | 385/18723 | 5.25e-14 | 1.13e-11 | 144 |
| GO:0019693 | Colorectum | AD | ribose phosphate metabolic process | 145/3918 | 396/18723 | 3.01e-13 | 5.71e-11 | 145 |
| GO:0009117 | Colorectum | AD | nucleotide metabolic process | 168/3918 | 489/18723 | 2.20e-12 | 3.36e-10 | 168 |
| GO:0006753 | Colorectum | AD | nucleoside phosphate metabolic process | 169/3918 | 497/18723 | 4.99e-12 | 6.98e-10 | 169 |
| GO:0009152 | Colorectum | AD | purine ribonucleotide biosynthetic process | 64/3918 | 169/18723 | 3.09e-07 | 1.22e-05 | 64 |
| GO:0009260 | Colorectum | AD | ribonucleotide biosynthetic process | 66/3918 | 182/18723 | 1.25e-06 | 4.02e-05 | 66 |
| GO:0046390 | Colorectum | AD | ribose phosphate biosynthetic process | 67/3918 | 190/18723 | 3.21e-06 | 9.05e-05 | 67 |
| GO:0006164 | Colorectum | AD | purine nucleotide biosynthetic process | 66/3918 | 191/18723 | 8.22e-06 | 1.97e-04 | 66 |
| GO:0072522 | Colorectum | AD | purine-containing compound biosynthetic process | 68/3918 | 200/18723 | 1.12e-05 | 2.55e-04 | 68 |
| GO:1901293 | Colorectum | AD | nucleoside phosphate biosynthetic process | 80/3918 | 256/18723 | 6.31e-05 | 1.05e-03 | 80 |
| GO:0006790 | Colorectum | AD | sulfur compound metabolic process | 101/3918 | 339/18723 | 6.46e-05 | 1.07e-03 | 101 |
| GO:0009165 | Colorectum | AD | nucleotide biosynthetic process | 79/3918 | 254/18723 | 8.33e-05 | 1.30e-03 | 79 |
| GO:0033865 | Colorectum | AD | nucleoside bisphosphate metabolic process | 42/3918 | 128/18723 | 1.12e-03 | 1.02e-02 | 42 |
| GO:0033875 | Colorectum | AD | ribonucleoside bisphosphate metabolic process | 42/3918 | 128/18723 | 1.12e-03 | 1.02e-02 | 42 |
| GO:0034032 | Colorectum | AD | purine nucleoside bisphosphate metabolic process | 42/3918 | 128/18723 | 1.12e-03 | 1.02e-02 | 42 |
| GO:0034035 | Colorectum | AD | purine ribonucleoside bisphosphate metabolic process | 11/3918 | 21/18723 | 1.43e-03 | 1.22e-02 | 11 |
| GO:0050427 | Colorectum | AD | 3'-phosphoadenosine 5'-phosphosulfate metabolic process | 11/3918 | 21/18723 | 1.43e-03 | 1.22e-02 | 11 |
| Page: 1 2 3 4 5 6 7 8 9 |
| Pathway ID | Tissue | Disease Stage | Description | Gene Ratio | Bg Ratio | pvalue | p.adjust | qvalue | Count |
| hsa05208 | Colorectum | AD | Chemical carcinogenesis - reactive oxygen species | 126/2092 | 223/8465 | 1.01e-24 | 1.68e-22 | 1.07e-22 | 126 |
| hsa052081 | Colorectum | AD | Chemical carcinogenesis - reactive oxygen species | 126/2092 | 223/8465 | 1.01e-24 | 1.68e-22 | 1.07e-22 | 126 |
| hsa052082 | Colorectum | SER | Chemical carcinogenesis - reactive oxygen species | 103/1580 | 223/8465 | 1.60e-21 | 7.57e-20 | 5.50e-20 | 103 |
| hsa052083 | Colorectum | SER | Chemical carcinogenesis - reactive oxygen species | 103/1580 | 223/8465 | 1.60e-21 | 7.57e-20 | 5.50e-20 | 103 |
| hsa052084 | Colorectum | MSS | Chemical carcinogenesis - reactive oxygen species | 118/1875 | 223/8465 | 2.71e-24 | 4.54e-22 | 2.78e-22 | 118 |
| hsa052085 | Colorectum | MSS | Chemical carcinogenesis - reactive oxygen species | 118/1875 | 223/8465 | 2.71e-24 | 4.54e-22 | 2.78e-22 | 118 |
| hsa052086 | Colorectum | MSI-H | Chemical carcinogenesis - reactive oxygen species | 65/797 | 223/8465 | 1.78e-17 | 6.41e-16 | 5.37e-16 | 65 |
| hsa052087 | Colorectum | MSI-H | Chemical carcinogenesis - reactive oxygen species | 65/797 | 223/8465 | 1.78e-17 | 6.41e-16 | 5.37e-16 | 65 |
| hsa052088 | Colorectum | FAP | Chemical carcinogenesis - reactive oxygen species | 78/1404 | 223/8465 | 1.08e-11 | 1.80e-09 | 1.09e-09 | 78 |
| hsa052089 | Colorectum | FAP | Chemical carcinogenesis - reactive oxygen species | 78/1404 | 223/8465 | 1.08e-11 | 1.80e-09 | 1.09e-09 | 78 |
| hsa0520810 | Colorectum | CRC | Chemical carcinogenesis - reactive oxygen species | 43/1091 | 223/8465 | 3.96e-03 | 2.36e-02 | 1.60e-02 | 43 |
| hsa0520811 | Colorectum | CRC | Chemical carcinogenesis - reactive oxygen species | 43/1091 | 223/8465 | 3.96e-03 | 2.36e-02 | 1.60e-02 | 43 |
| hsa05208211 | Esophagus | ESCC | Chemical carcinogenesis - reactive oxygen species | 168/4205 | 223/8465 | 1.83e-15 | 6.81e-14 | 3.49e-14 | 168 |
| hsa05208310 | Esophagus | ESCC | Chemical carcinogenesis - reactive oxygen species | 168/4205 | 223/8465 | 1.83e-15 | 6.81e-14 | 3.49e-14 | 168 |
| hsa0520842 | Liver | HCC | Chemical carcinogenesis - reactive oxygen species | 167/4020 | 223/8465 | 2.85e-17 | 1.91e-15 | 1.06e-15 | 167 |
| hsa0520852 | Liver | HCC | Chemical carcinogenesis - reactive oxygen species | 167/4020 | 223/8465 | 2.85e-17 | 1.91e-15 | 1.06e-15 | 167 |
| hsa0520830 | Oral cavity | OSCC | Chemical carcinogenesis - reactive oxygen species | 150/3704 | 223/8465 | 6.45e-13 | 1.20e-11 | 6.11e-12 | 150 |
| hsa05208114 | Oral cavity | OSCC | Chemical carcinogenesis - reactive oxygen species | 150/3704 | 223/8465 | 6.45e-13 | 1.20e-11 | 6.11e-12 | 150 |
| Page: 1 |
Top |
Cell-cell communication analysis |
| Identification of potential cell-cell interactions between two cell types and their ligand-receptor pairs for different disease states |
| Ligand | Receptor | LRpair | Pathway | Tissue | Disease Stage |
| Page: 1 |
Top |
Single-cell gene regulatory network inference analysis |
| Find out the significant the regulons (TFs) and the target genes of each regulon across cell types for different disease states |
| TF | Cell Type | Tissue | Disease Stage | Target Gene | RSS | Regulon Activity |
| ∗The dot plots of a searched regulon are shown for all cell subpopulations in each disease state of each tissue based on the regulon specific score inferred using pySCENIC and by calculating the average expression. |
| Page: 1 |
Top |
Somatic mutation of malignant transformation related genes |
| Annotation of somatic variants for genes involved in malignant transformation |
| Hugo Symbol | Variant Class | Variant Classification | dbSNP RS | HGVSc | HGVSp | HGVSp Short | SWISSPROT | BIOTYPE | SIFT | PolyPhen | Tumor Sample Barcode | Tissue | Histology | Sex | Age | Stage | Therapy Types | Drugs | Outcome |
| SLC26A2 | SNV | Missense_Mutation | rs868052713 | c.1108C>T | p.Pro370Ser | p.P370S | P50443 | protein_coding | deleterious(0.02) | possibly_damaging(0.842) | TCGA-ZG-A9M4-01 | Prostate | prostate adenocarcinoma | Male | >=65 | 9 | Unknown | Unknown | SD |
| SLC26A2 | deletion | Frame_Shift_Del | rs774842972 | c.692delN | p.Tyr232IlefsTer3 | p.Y232Ifs*3 | P50443 | protein_coding | TCGA-V1-A8WV-01 | Prostate | prostate adenocarcinoma | Male | <65 | 9 | Hormone Therapy | lhrh | CR | ||
| SLC26A2 | SNV | Missense_Mutation | c.1846N>A | p.Ala616Thr | p.A616T | P50443 | protein_coding | deleterious(0.05) | benign(0.038) | TCGA-BR-6452-01 | Stomach | stomach adenocarcinoma | Female | >=65 | I/II | Unknown | Unknown | SD | |
| SLC26A2 | SNV | Missense_Mutation | rs376837549 | c.2011C>T | p.Arg671Cys | p.R671C | P50443 | protein_coding | tolerated(0.19) | benign(0.081) | TCGA-CG-4469-01 | Stomach | stomach adenocarcinoma | Male | >=65 | III/IV | Chemotherapy | cisplatin | SD |
| SLC26A2 | insertion | Frame_Shift_Ins | rs769859976 | c.431_432insT | p.Ala147CysfsTer28 | p.A147Cfs*28 | P50443 | protein_coding | TCGA-D7-A6EY-01 | Stomach | stomach adenocarcinoma | Female | >=65 | III/IV | Unknown | Unknown | PD | ||
| SLC26A2 | insertion | Nonsense_Mutation | novel | c.2172_2173insTGAATTG | p.Gln725Ter | p.Q725* | P50443 | protein_coding | TCGA-EL-A3ZG-01 | Thyroid | thyroid carcinoma | Male | <65 | I/II | Unknown | Unknown | SD |
| Page: 1 2 3 4 5 6 7 |
Top |
Related drugs of malignant transformation related genes |
| Identification of chemicals and drugs interact with genes involved in malignant transfromation |
| (DGIdb 4.0) |
| Entrez ID | Symbol | Category | Interaction Types | Drug Claim Name | Drug Name | PMIDs |
| Page: 1 |

Copyright 2023-Present -The University of Texas Health Science Center at Houston |