
|
|||||
|
 | |
| |
| |
| |
| |
| |
|
Gene: SIK2 |
Gene summary for SIK2 |
| Gene information | Species | Human | Gene symbol | SIK2 | Gene ID | 23235 |
| Gene name | salt inducible kinase 2 | |
| Gene Alias | LOH11CR1I | |
| Cytomap | 11q23.1 | |
| Gene Type | protein-coding | GO ID | GO:0006464 | UniProtAcc | A0A024R3G7 |
Top |
Malignant transformation analysis |
| Identification of the aberrant gene expression in precancerous and cancerous lesions by comparing the gene expression of stem-like cells in diseased tissues with normal stem cells |
| Entrez ID | Symbol | Replicates | Species | Organ | Tissue | Adj P-value | Log2FC | Malignancy |
| 23235 | SIK2 | HTA11_3410_2000001011 | Human | Colorectum | AD | 1.71e-02 | -3.52e-01 | 0.0155 |
| 23235 | SIK2 | HTA11_347_2000001011 | Human | Colorectum | AD | 6.43e-07 | 4.04e-01 | -0.1954 |
| 23235 | SIK2 | HTA11_99999974143_84620 | Human | Colorectum | MSS | 4.48e-09 | -4.24e-01 | 0.3005 |
| 23235 | SIK2 | A015-C-203 | Human | Colorectum | FAP | 5.64e-27 | -5.21e-01 | -0.1294 |
| 23235 | SIK2 | A015-C-204 | Human | Colorectum | FAP | 5.93e-05 | -3.45e-01 | -0.0228 |
| 23235 | SIK2 | A014-C-040 | Human | Colorectum | FAP | 5.51e-05 | -5.58e-01 | -0.1184 |
| 23235 | SIK2 | A002-C-201 | Human | Colorectum | FAP | 2.21e-13 | -3.98e-01 | 0.0324 |
| 23235 | SIK2 | A002-C-203 | Human | Colorectum | FAP | 7.77e-03 | -1.50e-01 | 0.2786 |
| 23235 | SIK2 | A001-C-119 | Human | Colorectum | FAP | 8.85e-04 | -3.36e-01 | -0.1557 |
| 23235 | SIK2 | A001-C-108 | Human | Colorectum | FAP | 1.91e-13 | -3.14e-01 | -0.0272 |
| 23235 | SIK2 | A002-C-205 | Human | Colorectum | FAP | 2.92e-22 | -4.97e-01 | -0.1236 |
| 23235 | SIK2 | A001-C-104 | Human | Colorectum | FAP | 2.44e-02 | -2.17e-01 | 0.0184 |
| 23235 | SIK2 | A015-C-005 | Human | Colorectum | FAP | 9.91e-04 | -2.62e-01 | -0.0336 |
| 23235 | SIK2 | A015-C-006 | Human | Colorectum | FAP | 8.85e-16 | -6.14e-01 | -0.0994 |
| 23235 | SIK2 | A015-C-106 | Human | Colorectum | FAP | 7.25e-11 | -3.18e-01 | -0.0511 |
| 23235 | SIK2 | A002-C-114 | Human | Colorectum | FAP | 2.89e-20 | -6.00e-01 | -0.1561 |
| 23235 | SIK2 | A015-C-104 | Human | Colorectum | FAP | 1.59e-29 | -4.81e-01 | -0.1899 |
| 23235 | SIK2 | A001-C-014 | Human | Colorectum | FAP | 1.09e-12 | -3.45e-01 | 0.0135 |
| 23235 | SIK2 | A002-C-016 | Human | Colorectum | FAP | 3.54e-21 | -4.32e-01 | 0.0521 |
| 23235 | SIK2 | A015-C-002 | Human | Colorectum | FAP | 3.71e-11 | -5.14e-01 | -0.0763 |
| Page: 1 2 3 4 5 |
| Tissue | Expression Dynamics | Abbreviation |
| Colorectum (GSE201348) |  | FAP: Familial adenomatous polyposis |
| CRC: Colorectal cancer | ||
| Colorectum (HTA11) | 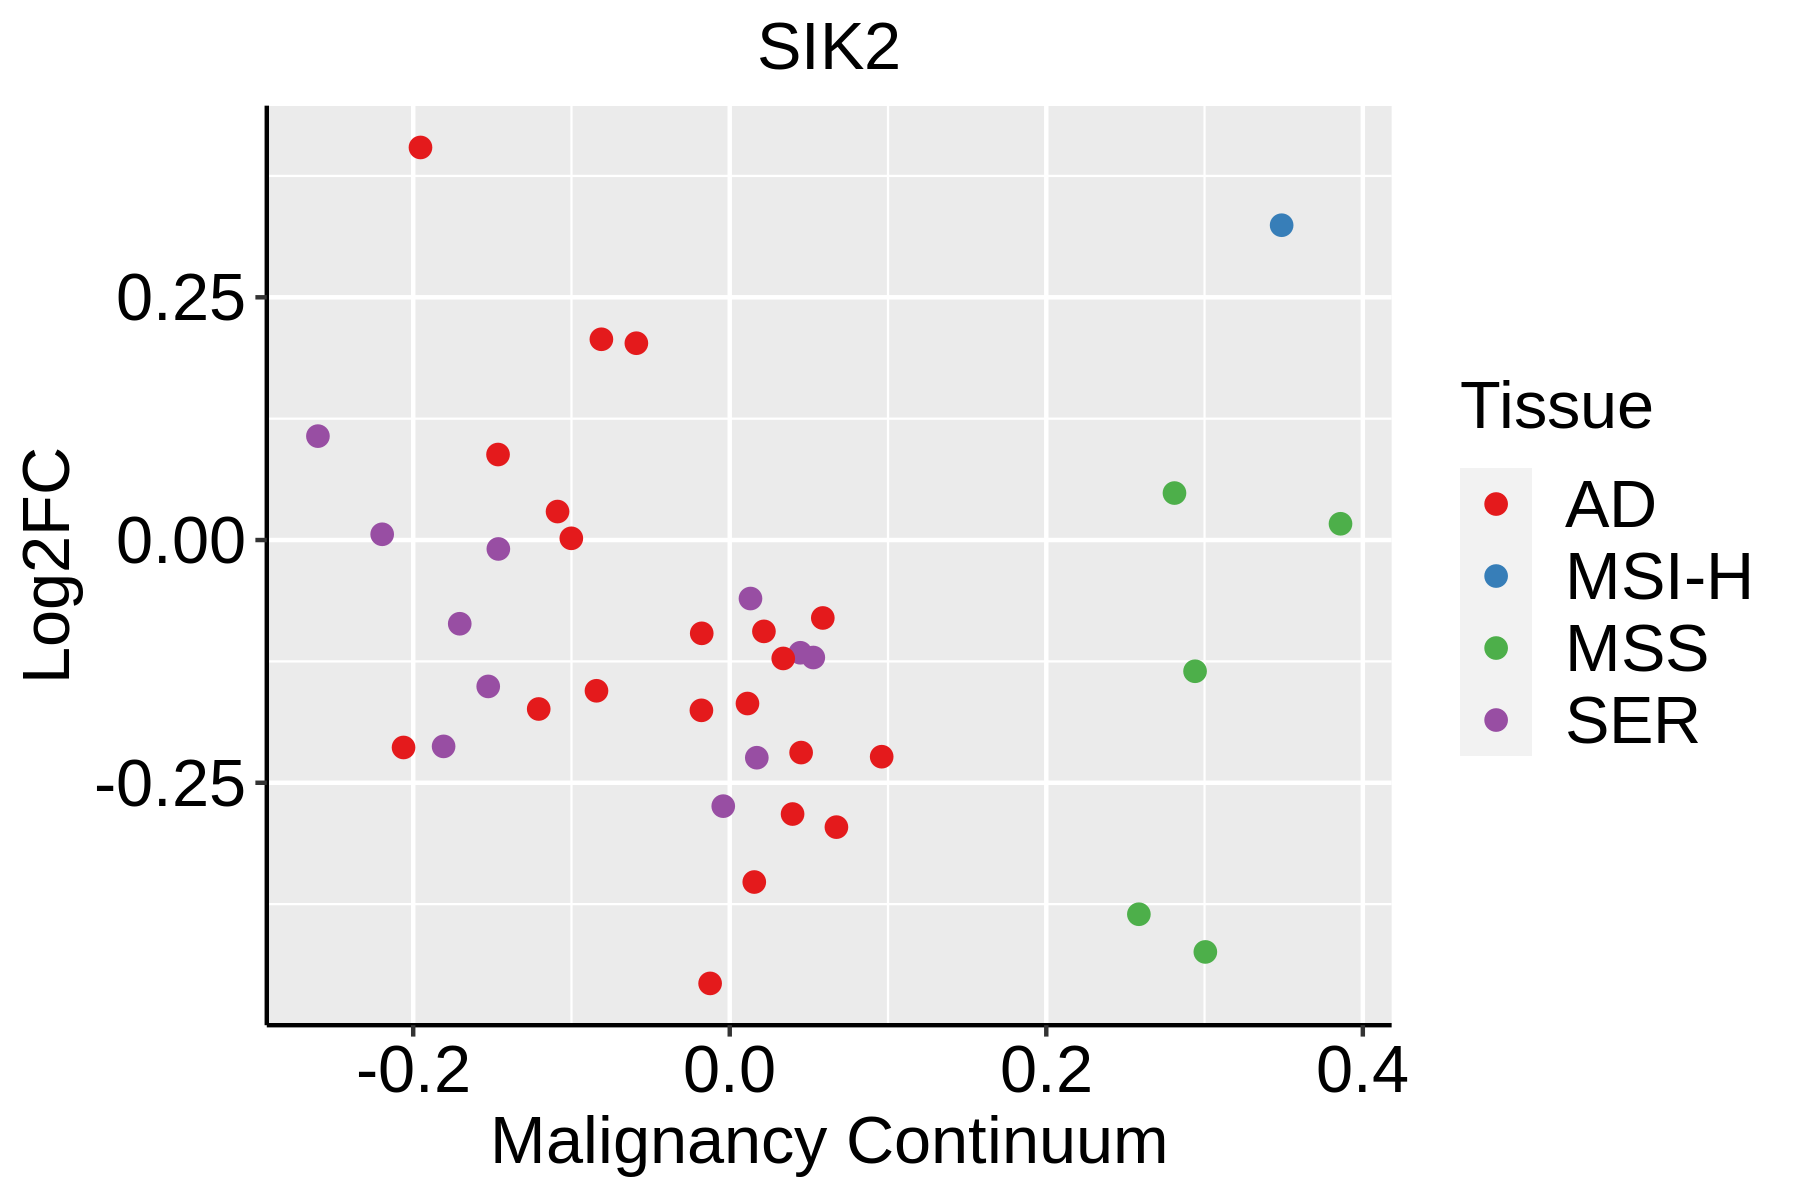 | AD: Adenomas |
| SER: Sessile serrated lesions | ||
| MSI-H: Microsatellite-high colorectal cancer | ||
| MSS: Microsatellite stable colorectal cancer | ||
| Endometrium | 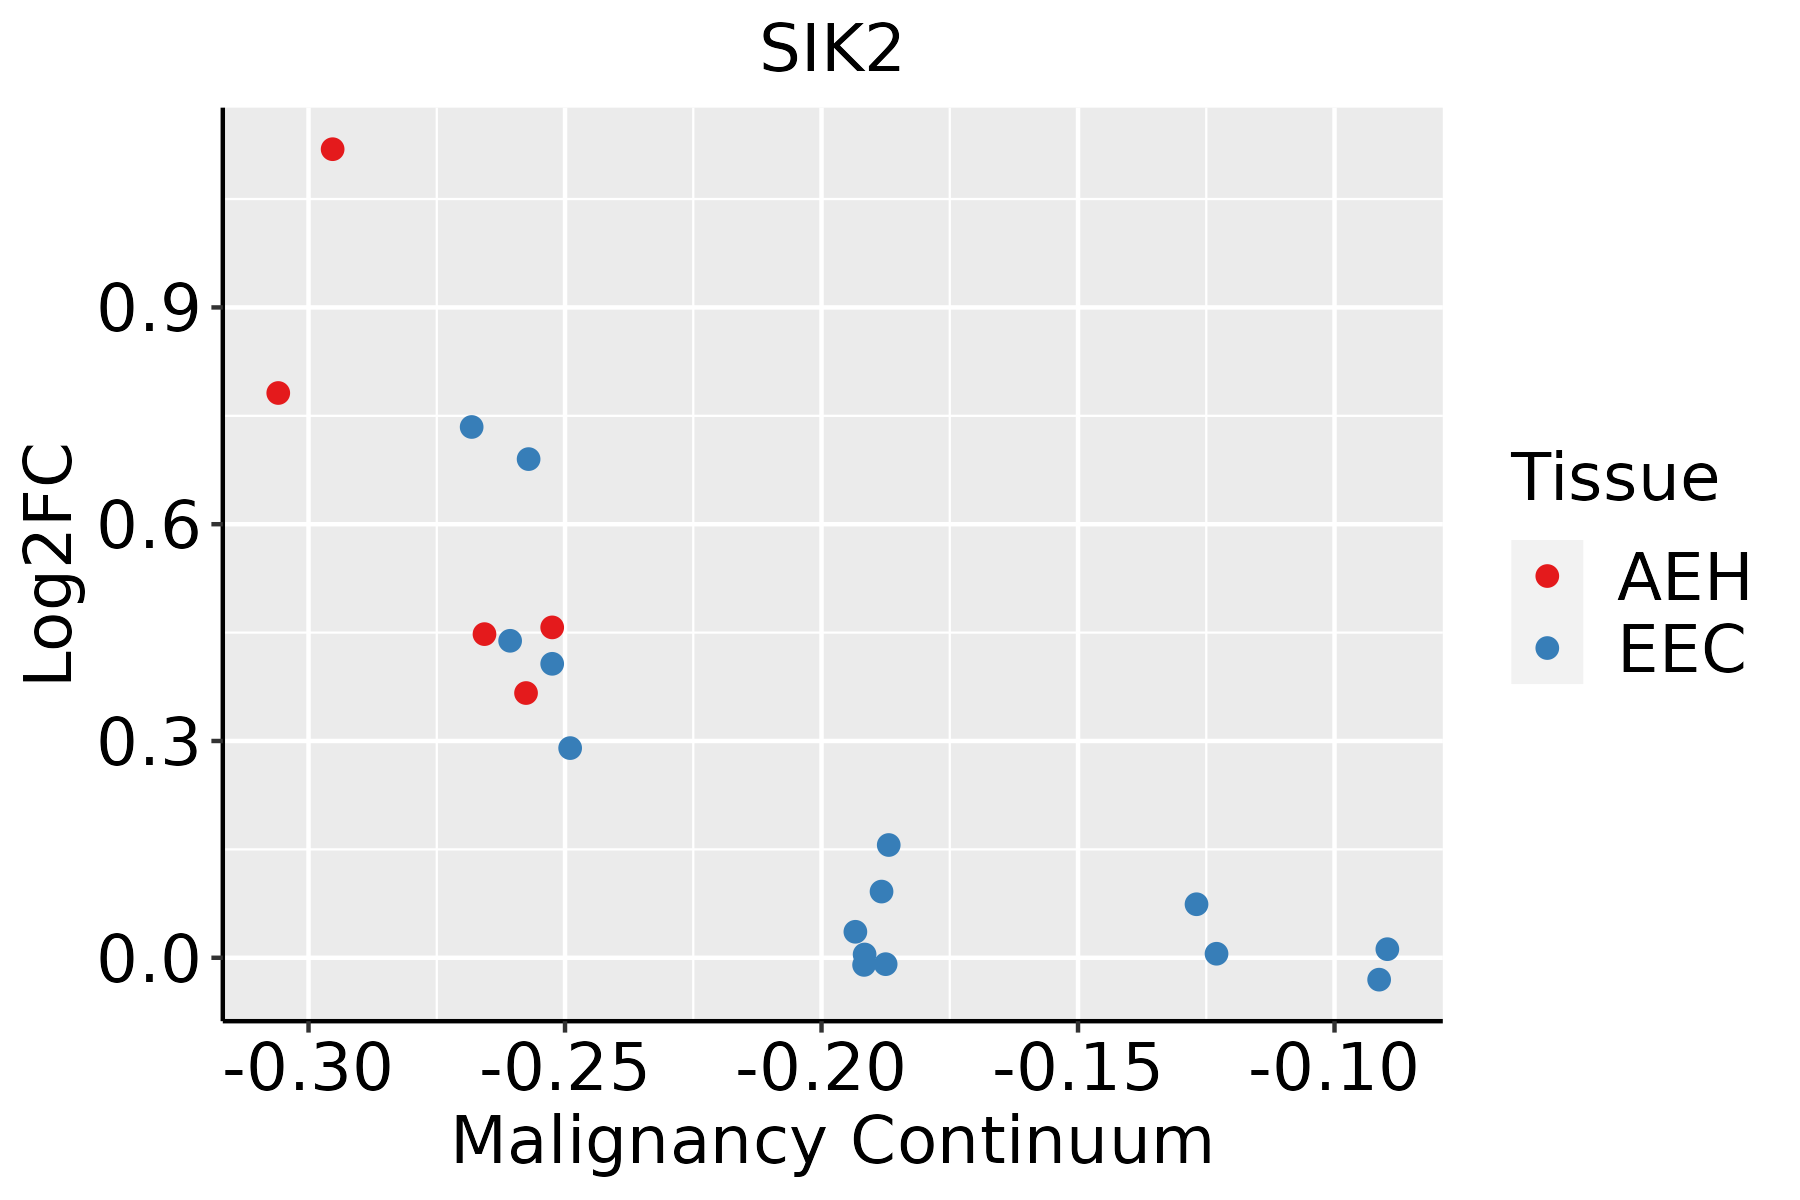 | AEH: Atypical endometrial hyperplasia |
| EEC: Endometrioid Cancer | ||
| Liver | 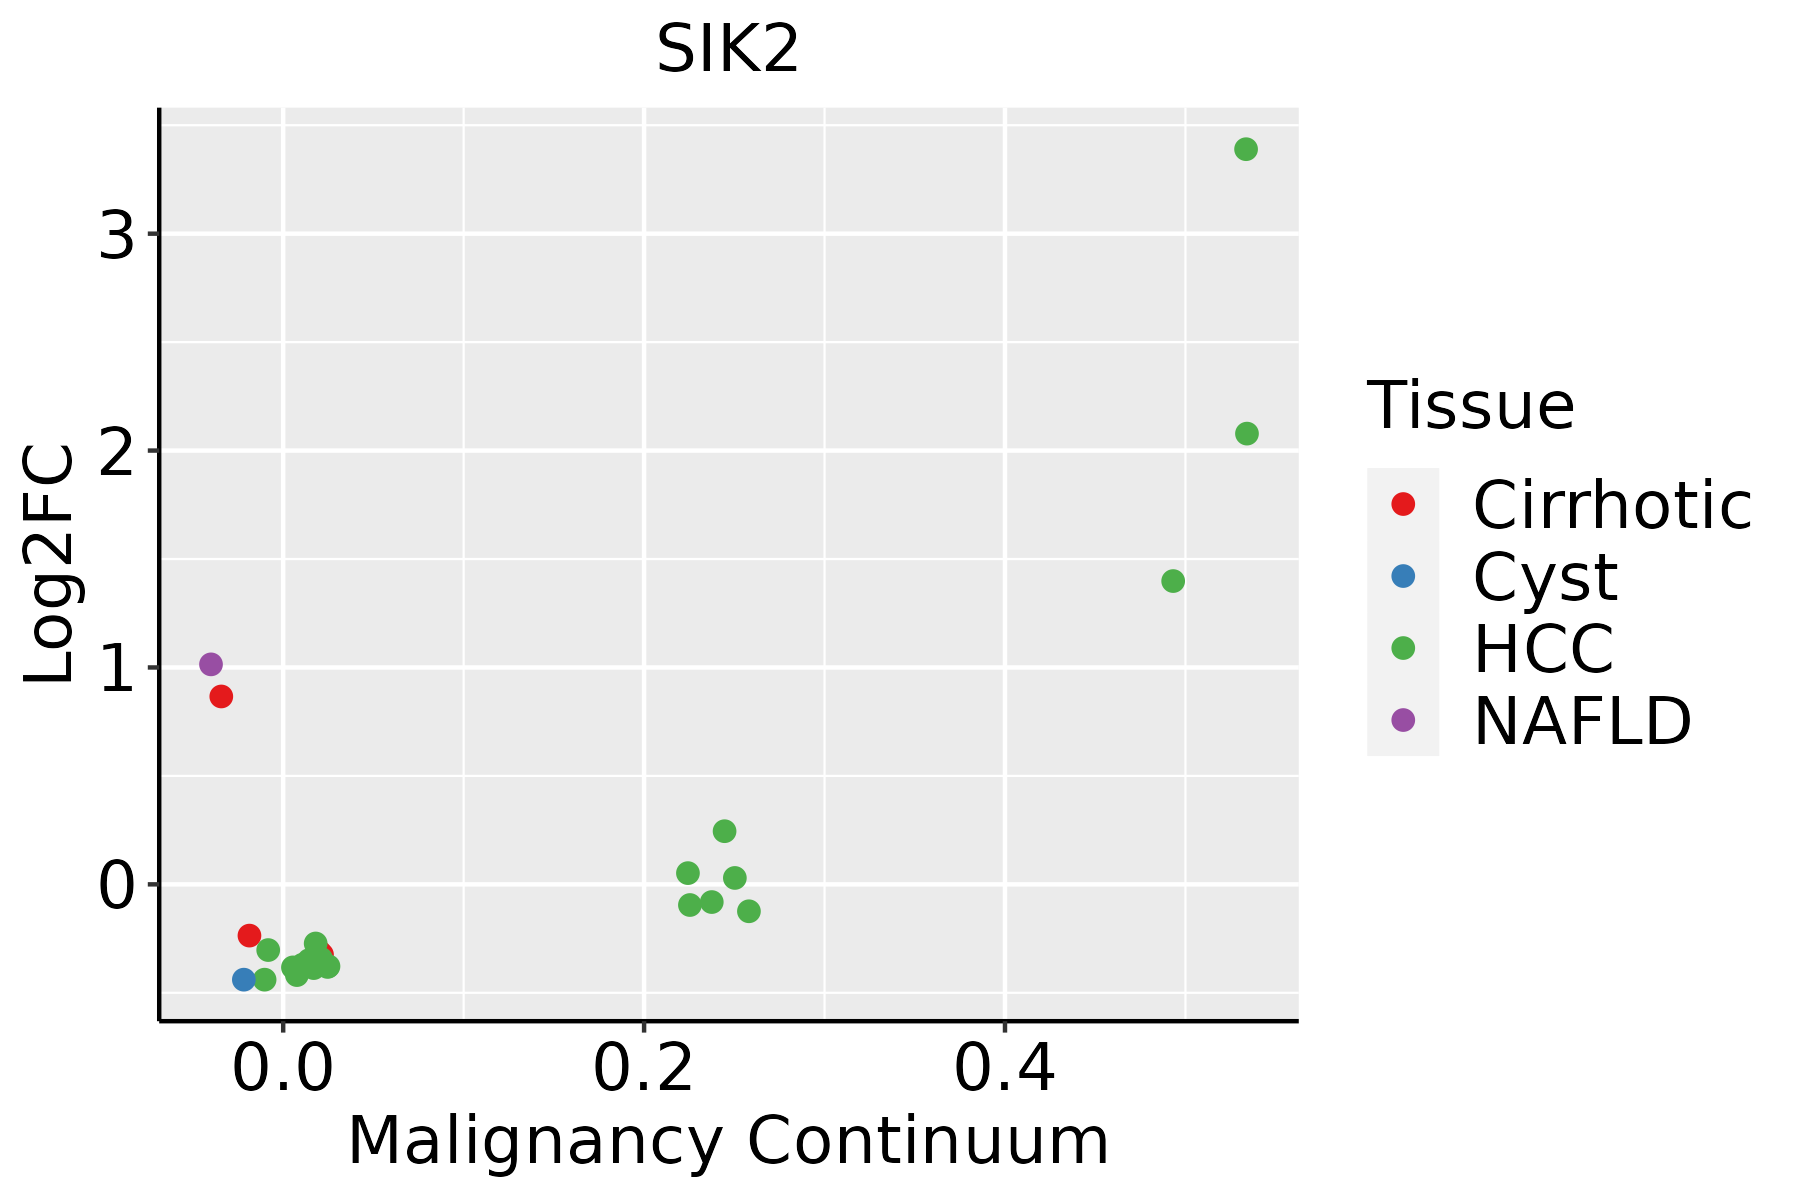 | HCC: Hepatocellular carcinoma |
| NAFLD: Non-alcoholic fatty liver disease | ||
| Lung |  | AAH: Atypical adenomatous hyperplasia |
| AIS: Adenocarcinoma in situ | ||
| IAC: Invasive lung adenocarcinoma | ||
| MIA: Minimally invasive adenocarcinoma |
| ∗log2FC in expression of this searched gene in stem-like cells from each diseased tissue sample relative to stem-like cells in normal samples in each tissue plotted against the malignancy continuum. Samples are colored based on if they are from different disease stage. |
Top |
Malignant transformation related pathway analysis |
| Find out the enriched GO biological processes and KEGG pathways involved in transition from healthy to precancer to cancer |
| Tissue | Disease Stage | Enriched GO biological Processes |
| Colorectum | AD |  |
| Colorectum | SER |  |
| Colorectum | MSS |  |
| Colorectum | MSI-H |  |
| Colorectum | FAP |  |
| ∗Top 15 enriched GO BP terms are showed in the bar plot of each disease state in each tissue. Each row represents a significant GO biological process which is colored according to the -log10(p.adjust). |
| Page: 1 2 3 4 5 6 7 8 9 |
| GO ID | Tissue | Disease Stage | Description | Gene Ratio | Bg Ratio | pvalue | p.adjust | Count |
| GO:0032868 | Colorectum | AD | response to insulin | 91/3918 | 264/18723 | 2.02e-07 | 8.48e-06 | 91 |
| GO:1901653 | Colorectum | AD | cellular response to peptide | 114/3918 | 359/18723 | 8.32e-07 | 2.88e-05 | 114 |
| GO:0032869 | Colorectum | AD | cellular response to insulin stimulus | 72/3918 | 203/18723 | 1.10e-06 | 3.68e-05 | 72 |
| GO:0071375 | Colorectum | AD | cellular response to peptide hormone stimulus | 95/3918 | 290/18723 | 1.50e-06 | 4.66e-05 | 95 |
| GO:0043434 | Colorectum | AD | response to peptide hormone | 126/3918 | 414/18723 | 2.70e-06 | 7.86e-05 | 126 |
| GO:0031667 | Colorectum | AD | response to nutrient levels | 138/3918 | 474/18723 | 1.22e-05 | 2.68e-04 | 138 |
| GO:0046777 | Colorectum | AD | protein autophosphorylation | 74/3918 | 227/18723 | 2.48e-05 | 4.76e-04 | 74 |
| GO:0042594 | Colorectum | AD | response to starvation | 63/3918 | 197/18723 | 1.77e-04 | 2.38e-03 | 63 |
| GO:0071496 | Colorectum | AD | cellular response to external stimulus | 94/3918 | 320/18723 | 1.98e-04 | 2.64e-03 | 94 |
| GO:0009267 | Colorectum | AD | cellular response to starvation | 51/3918 | 156/18723 | 3.90e-04 | 4.44e-03 | 51 |
| GO:0031668 | Colorectum | AD | cellular response to extracellular stimulus | 71/3918 | 246/18723 | 1.86e-03 | 1.52e-02 | 71 |
| GO:0031669 | Colorectum | AD | cellular response to nutrient levels | 63/3918 | 215/18723 | 2.19e-03 | 1.73e-02 | 63 |
| GO:00316672 | Colorectum | MSS | response to nutrient levels | 125/3467 | 474/18723 | 1.24e-05 | 2.88e-04 | 125 |
| GO:00467772 | Colorectum | MSS | protein autophosphorylation | 63/3467 | 227/18723 | 3.96e-04 | 4.91e-03 | 63 |
| GO:00425942 | Colorectum | MSS | response to starvation | 56/3467 | 197/18723 | 4.25e-04 | 5.21e-03 | 56 |
| GO:00434342 | Colorectum | MSS | response to peptide hormone | 104/3467 | 414/18723 | 4.58e-04 | 5.43e-03 | 104 |
| GO:19016532 | Colorectum | MSS | cellular response to peptide | 91/3467 | 359/18723 | 7.38e-04 | 7.88e-03 | 91 |
| GO:00714962 | Colorectum | MSS | cellular response to external stimulus | 82/3467 | 320/18723 | 9.30e-04 | 9.44e-03 | 82 |
| GO:00328692 | Colorectum | MSS | cellular response to insulin stimulus | 56/3467 | 203/18723 | 9.41e-04 | 9.50e-03 | 56 |
| GO:00713752 | Colorectum | MSS | cellular response to peptide hormone stimulus | 75/3467 | 290/18723 | 1.14e-03 | 1.12e-02 | 75 |
| Page: 1 2 3 4 5 6 7 |
| Pathway ID | Tissue | Disease Stage | Description | Gene Ratio | Bg Ratio | pvalue | p.adjust | qvalue | Count |
| hsa04922 | Colorectum | AD | Glucagon signaling pathway | 41/2092 | 107/8465 | 1.18e-03 | 7.75e-03 | 4.94e-03 | 41 |
| hsa049221 | Colorectum | AD | Glucagon signaling pathway | 41/2092 | 107/8465 | 1.18e-03 | 7.75e-03 | 4.94e-03 | 41 |
| hsa049226 | Colorectum | FAP | Glucagon signaling pathway | 32/1404 | 107/8465 | 4.08e-04 | 3.10e-03 | 1.89e-03 | 32 |
| hsa049227 | Colorectum | FAP | Glucagon signaling pathway | 32/1404 | 107/8465 | 4.08e-04 | 3.10e-03 | 1.89e-03 | 32 |
| hsa049228 | Colorectum | CRC | Glucagon signaling pathway | 24/1091 | 107/8465 | 4.21e-03 | 2.47e-02 | 1.67e-02 | 24 |
| hsa049229 | Colorectum | CRC | Glucagon signaling pathway | 24/1091 | 107/8465 | 4.21e-03 | 2.47e-02 | 1.67e-02 | 24 |
| hsa0492210 | Liver | NAFLD | Glucagon signaling pathway | 24/1043 | 107/8465 | 2.33e-03 | 2.46e-02 | 1.99e-02 | 24 |
| hsa0492211 | Liver | NAFLD | Glucagon signaling pathway | 24/1043 | 107/8465 | 2.33e-03 | 2.46e-02 | 1.99e-02 | 24 |
| hsa0492221 | Liver | Cirrhotic | Glucagon signaling pathway | 43/2530 | 107/8465 | 1.42e-02 | 4.35e-02 | 2.68e-02 | 43 |
| hsa0492231 | Liver | Cirrhotic | Glucagon signaling pathway | 43/2530 | 107/8465 | 1.42e-02 | 4.35e-02 | 2.68e-02 | 43 |
| hsa0492241 | Liver | HCC | Glucagon signaling pathway | 64/4020 | 107/8465 | 6.70e-03 | 1.87e-02 | 1.04e-02 | 64 |
| hsa0492251 | Liver | HCC | Glucagon signaling pathway | 64/4020 | 107/8465 | 6.70e-03 | 1.87e-02 | 1.04e-02 | 64 |
| Page: 1 |
Top |
Cell-cell communication analysis |
| Identification of potential cell-cell interactions between two cell types and their ligand-receptor pairs for different disease states |
| Ligand | Receptor | LRpair | Pathway | Tissue | Disease Stage |
| Page: 1 |
Top |
Single-cell gene regulatory network inference analysis |
| Find out the significant the regulons (TFs) and the target genes of each regulon across cell types for different disease states |
| TF | Cell Type | Tissue | Disease Stage | Target Gene | RSS | Regulon Activity |
| ∗The dot plots of a searched regulon are shown for all cell subpopulations in each disease state of each tissue based on the regulon specific score inferred using pySCENIC and by calculating the average expression. |
| Page: 1 |
Top |
Somatic mutation of malignant transformation related genes |
| Annotation of somatic variants for genes involved in malignant transformation |
| Hugo Symbol | Variant Class | Variant Classification | dbSNP RS | HGVSc | HGVSp | HGVSp Short | SWISSPROT | BIOTYPE | SIFT | PolyPhen | Tumor Sample Barcode | Tissue | Histology | Sex | Age | Stage | Therapy Types | Drugs | Outcome |
| SIK2 | deletion | In_Frame_Del | novel | c.2665_2667delNNN | p.Gln889del | p.Q889del | Q9H0K1 | protein_coding | TCGA-NK-A5CR-01 | Lung | lung squamous cell carcinoma | Male | >=65 | I/II | Unknown | Unknown | SD | ||
| SIK2 | SNV | Missense_Mutation | novel | c.1223N>T | p.Ala408Val | p.A408V | Q9H0K1 | protein_coding | tolerated(0.11) | benign(0.022) | TCGA-F7-A624-01 | Oral cavity | head & neck squamous cell carcinoma | Male | >=65 | I/II | Unknown | Unknown | SD |
| SIK2 | SNV | Missense_Mutation | rs749241959 | c.1387N>A | p.Glu463Lys | p.E463K | Q9H0K1 | protein_coding | deleterious(0.01) | benign(0.028) | TCGA-IQ-A61E-01 | Oral cavity | head & neck squamous cell carcinoma | Female | <65 | III/IV | Chemotherapy | cisplatin | CR |
| SIK2 | SNV | Missense_Mutation | rs200775925 | c.407N>A | p.Arg136Gln | p.R136Q | Q9H0K1 | protein_coding | tolerated(0.07) | benign(0.274) | TCGA-V1-A8WW-01 | Prostate | prostate adenocarcinoma | Male | <65 | 9 | Hormone Therapy | lhrh | SD |
| SIK2 | SNV | Missense_Mutation | c.509G>A | p.Gly170Asp | p.G170D | Q9H0K1 | protein_coding | deleterious(0.03) | possibly_damaging(0.567) | TCGA-XK-AAIW-01 | Prostate | prostate adenocarcinoma | Male | >=65 | 9 | Unknown | Unknown | PD | |
| SIK2 | SNV | Missense_Mutation | c.2101N>C | p.Cys701Arg | p.C701R | Q9H0K1 | protein_coding | deleterious(0) | probably_damaging(0.915) | TCGA-BR-6452-01 | Stomach | stomach adenocarcinoma | Female | >=65 | I/II | Unknown | Unknown | SD | |
| SIK2 | SNV | Missense_Mutation | c.2078C>T | p.Ala693Val | p.A693V | Q9H0K1 | protein_coding | tolerated(0.07) | benign(0.073) | TCGA-BR-8591-01 | Stomach | stomach adenocarcinoma | Male | >=65 | III/IV | Unknown | Unknown | SD | |
| SIK2 | SNV | Missense_Mutation | c.2329G>A | p.Val777Ile | p.V777I | Q9H0K1 | protein_coding | deleterious_low_confidence(0.04) | benign(0.084) | TCGA-CD-8536-01 | Stomach | stomach adenocarcinoma | Male | >=65 | I/II | Chemotherapy | epirubicin | CR | |
| SIK2 | SNV | Missense_Mutation | c.1861N>C | p.Tyr621His | p.Y621H | Q9H0K1 | protein_coding | tolerated(0.19) | possibly_damaging(0.758) | TCGA-CG-5723-01 | Stomach | stomach adenocarcinoma | Male | >=65 | I/II | Unknown | Unknown | SD | |
| SIK2 | SNV | Missense_Mutation | novel | c.2465A>C | p.Gln822Pro | p.Q822P | Q9H0K1 | protein_coding | tolerated_low_confidence(0.24) | benign(0) | TCGA-HU-8602-01 | Stomach | stomach adenocarcinoma | Female | <65 | I/II | Chemotherapy | xeloda | CR |
| Page: 1 2 3 4 5 6 7 8 |
Top |
Related drugs of malignant transformation related genes |
| Identification of chemicals and drugs interact with genes involved in malignant transfromation |
| (DGIdb 4.0) |
| Entrez ID | Symbol | Category | Interaction Types | Drug Claim Name | Drug Name | PMIDs |
| 23235 | SIK2 | SERINE THREONINE KINASE, KINASE, DRUGGABLE GENOME, ENZYME | inhibitor | 340590212 | ||
| 23235 | SIK2 | SERINE THREONINE KINASE, KINASE, DRUGGABLE GENOME, ENZYME | PF-562271 | PF-00562271 | ||
| 23235 | SIK2 | SERINE THREONINE KINASE, KINASE, DRUGGABLE GENOME, ENZYME | inhibitor | 178102336 | BOSUTINIB | |
| 23235 | SIK2 | SERINE THREONINE KINASE, KINASE, DRUGGABLE GENOME, ENZYME | inhibitor | 249565729 | ||
| 23235 | SIK2 | SERINE THREONINE KINASE, KINASE, DRUGGABLE GENOME, ENZYME | TAMATINIB | R-406 | ||
| 23235 | SIK2 | SERINE THREONINE KINASE, KINASE, DRUGGABLE GENOME, ENZYME | JNJ-7706621 | JNJ-7706621 | ||
| 23235 | SIK2 | SERINE THREONINE KINASE, KINASE, DRUGGABLE GENOME, ENZYME | DASATINIB | DASATINIB | ||
| 23235 | SIK2 | SERINE THREONINE KINASE, KINASE, DRUGGABLE GENOME, ENZYME | DOVITINIB | DOVITINIB | ||
| 23235 | SIK2 | SERINE THREONINE KINASE, KINASE, DRUGGABLE GENOME, ENZYME | GEFITINIB | GEFITINIB | ||
| 23235 | SIK2 | SERINE THREONINE KINASE, KINASE, DRUGGABLE GENOME, ENZYME | SB-203580 | SB-203580 |
| Page: 1 2 |

Copyright 2023-Present -The University of Texas Health Science Center at Houston |