
|
|||||
|
 | |
| |
| |
| |
| |
| |
|
Gene: SGSM3 |
Gene summary for SGSM3 |
| Gene information | Species | Human | Gene symbol | SGSM3 | Gene ID | 27352 |
| Gene name | small G protein signaling modulator 3 | |
| Gene Alias | CIP85 | |
| Cytomap | 22q13.1 | |
| Gene Type | protein-coding | GO ID | GO:0006807 | UniProtAcc | B4DVE3 |
Top |
Malignant transformation analysis |
| Identification of the aberrant gene expression in precancerous and cancerous lesions by comparing the gene expression of stem-like cells in diseased tissues with normal stem cells |
| Entrez ID | Symbol | Replicates | Species | Organ | Tissue | Adj P-value | Log2FC | Malignancy |
| 27352 | SGSM3 | HTA11_2487_2000001011 | Human | Colorectum | SER | 3.15e-09 | 3.02e-01 | -0.1808 |
| 27352 | SGSM3 | HTA11_1938_2000001011 | Human | Colorectum | AD | 5.30e-05 | 2.46e-01 | -0.0811 |
| 27352 | SGSM3 | HTA11_78_2000001011 | Human | Colorectum | AD | 6.87e-04 | 2.26e-01 | -0.1088 |
| 27352 | SGSM3 | HTA11_347_2000001011 | Human | Colorectum | AD | 2.35e-11 | 2.39e-01 | -0.1954 |
| 27352 | SGSM3 | HTA11_2112_2000001011 | Human | Colorectum | SER | 3.73e-07 | 7.66e-01 | -0.2196 |
| 27352 | SGSM3 | HTA11_3361_2000001011 | Human | Colorectum | AD | 4.18e-08 | 3.78e-01 | -0.1207 |
| 27352 | SGSM3 | HTA11_83_2000001011 | Human | Colorectum | SER | 2.92e-06 | 3.41e-01 | -0.1526 |
| 27352 | SGSM3 | HTA11_696_2000001011 | Human | Colorectum | AD | 4.03e-13 | 3.13e-01 | -0.1464 |
| 27352 | SGSM3 | HTA11_866_2000001011 | Human | Colorectum | AD | 3.96e-11 | 2.21e-01 | -0.1001 |
| 27352 | SGSM3 | HTA11_1391_2000001011 | Human | Colorectum | AD | 1.35e-12 | 3.52e-01 | -0.059 |
| 27352 | SGSM3 | HTA11_5216_2000001011 | Human | Colorectum | SER | 3.59e-03 | 3.32e-01 | -0.1462 |
| 27352 | SGSM3 | HTA11_866_3004761011 | Human | Colorectum | AD | 1.84e-10 | 2.52e-01 | 0.096 |
| 27352 | SGSM3 | HTA11_4255_2000001011 | Human | Colorectum | SER | 1.54e-03 | 3.05e-01 | 0.0446 |
| 27352 | SGSM3 | HTA11_6801_2000001011 | Human | Colorectum | SER | 2.33e-03 | 3.85e-01 | 0.0171 |
| 27352 | SGSM3 | HTA11_10711_2000001011 | Human | Colorectum | AD | 6.57e-07 | 2.54e-01 | 0.0338 |
| 27352 | SGSM3 | HTA11_7696_3000711011 | Human | Colorectum | AD | 9.71e-09 | 2.11e-01 | 0.0674 |
| 27352 | SGSM3 | HTA11_99999970781_79442 | Human | Colorectum | MSS | 2.00e-06 | 2.03e-01 | 0.294 |
| 27352 | SGSM3 | HTA11_99999971662_82457 | Human | Colorectum | MSS | 6.52e-09 | 2.75e-01 | 0.3859 |
| 27352 | SGSM3 | HTA11_99999974143_84620 | Human | Colorectum | MSS | 2.57e-03 | 1.71e-01 | 0.3005 |
| 27352 | SGSM3 | LZE4T | Human | Esophagus | ESCC | 1.44e-03 | 4.09e-02 | 0.0811 |
| Page: 1 2 3 4 5 6 |
| Tissue | Expression Dynamics | Abbreviation |
| Colorectum (GSE201348) |  | FAP: Familial adenomatous polyposis |
| CRC: Colorectal cancer | ||
| Colorectum (HTA11) | 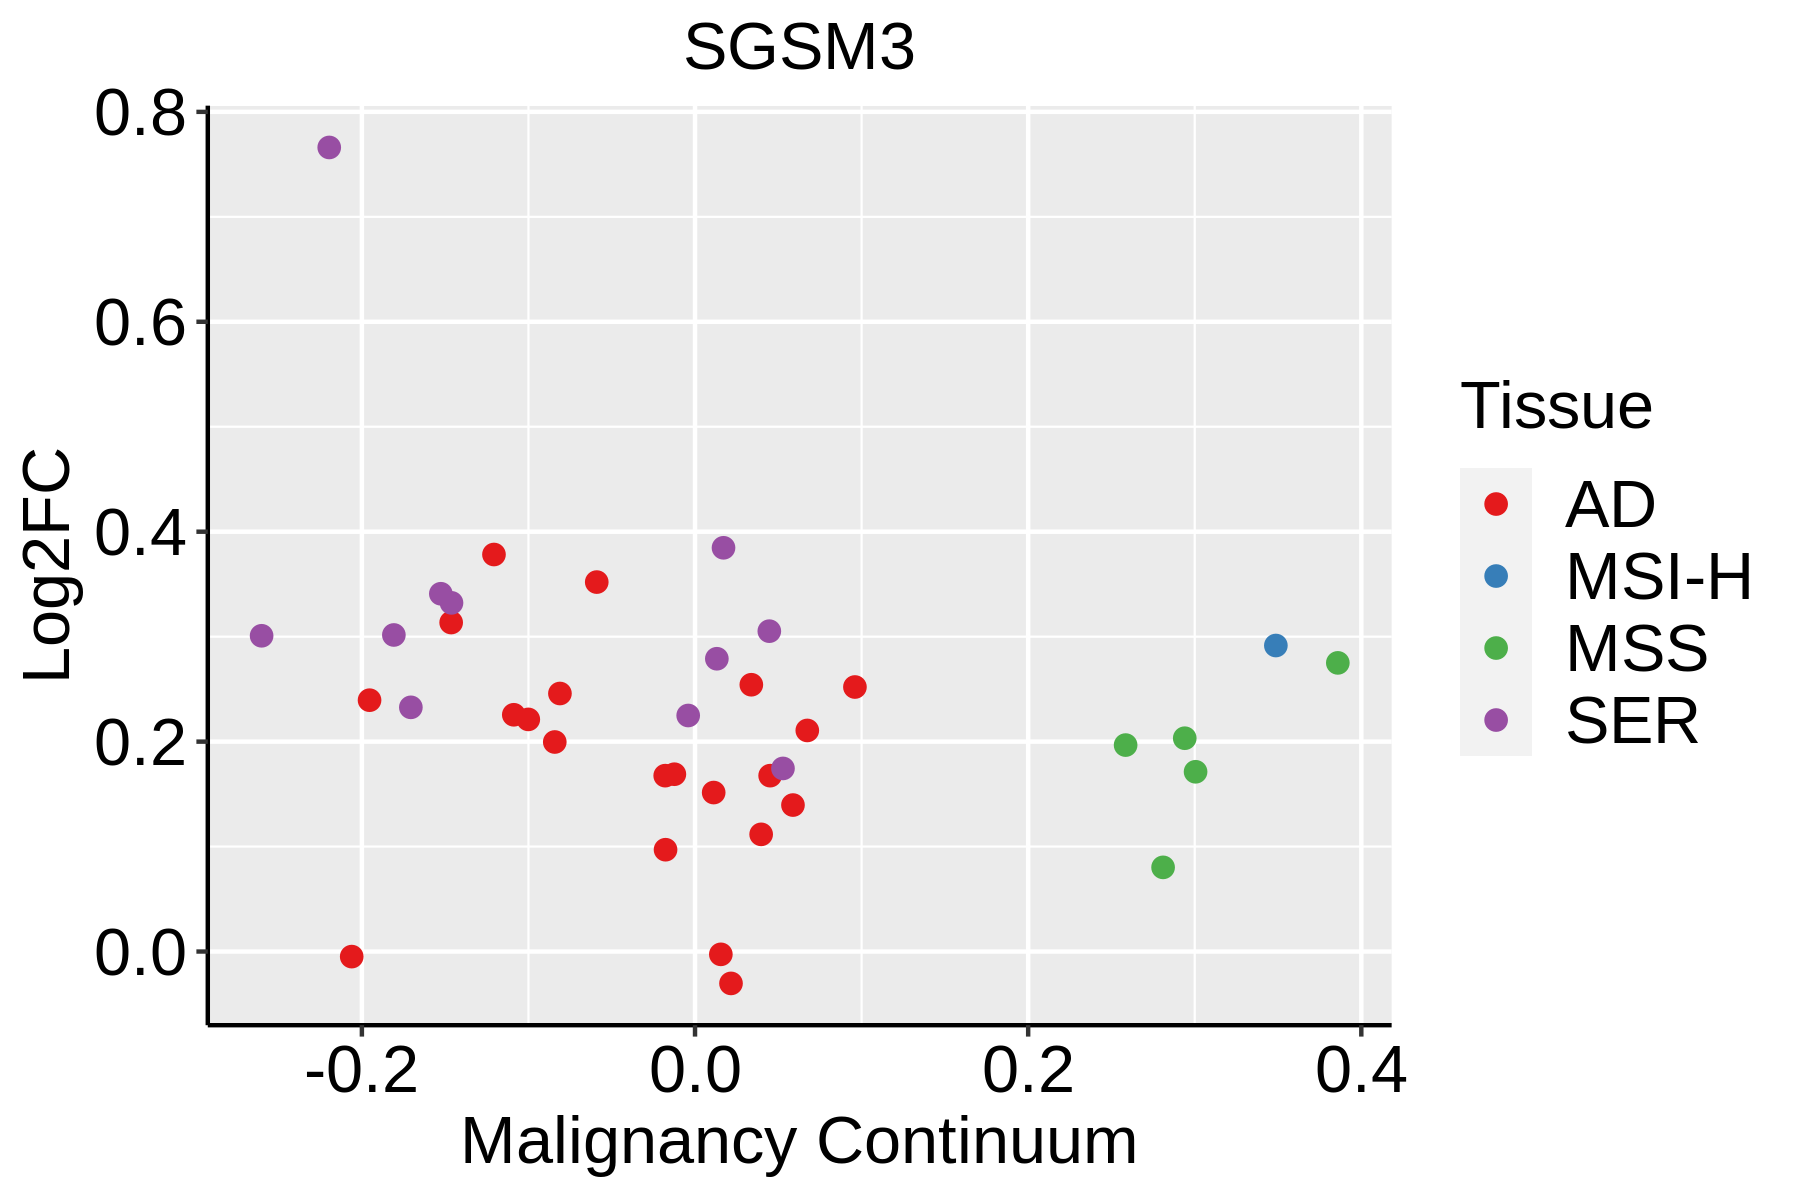 | AD: Adenomas |
| SER: Sessile serrated lesions | ||
| MSI-H: Microsatellite-high colorectal cancer | ||
| MSS: Microsatellite stable colorectal cancer | ||
| Esophagus | 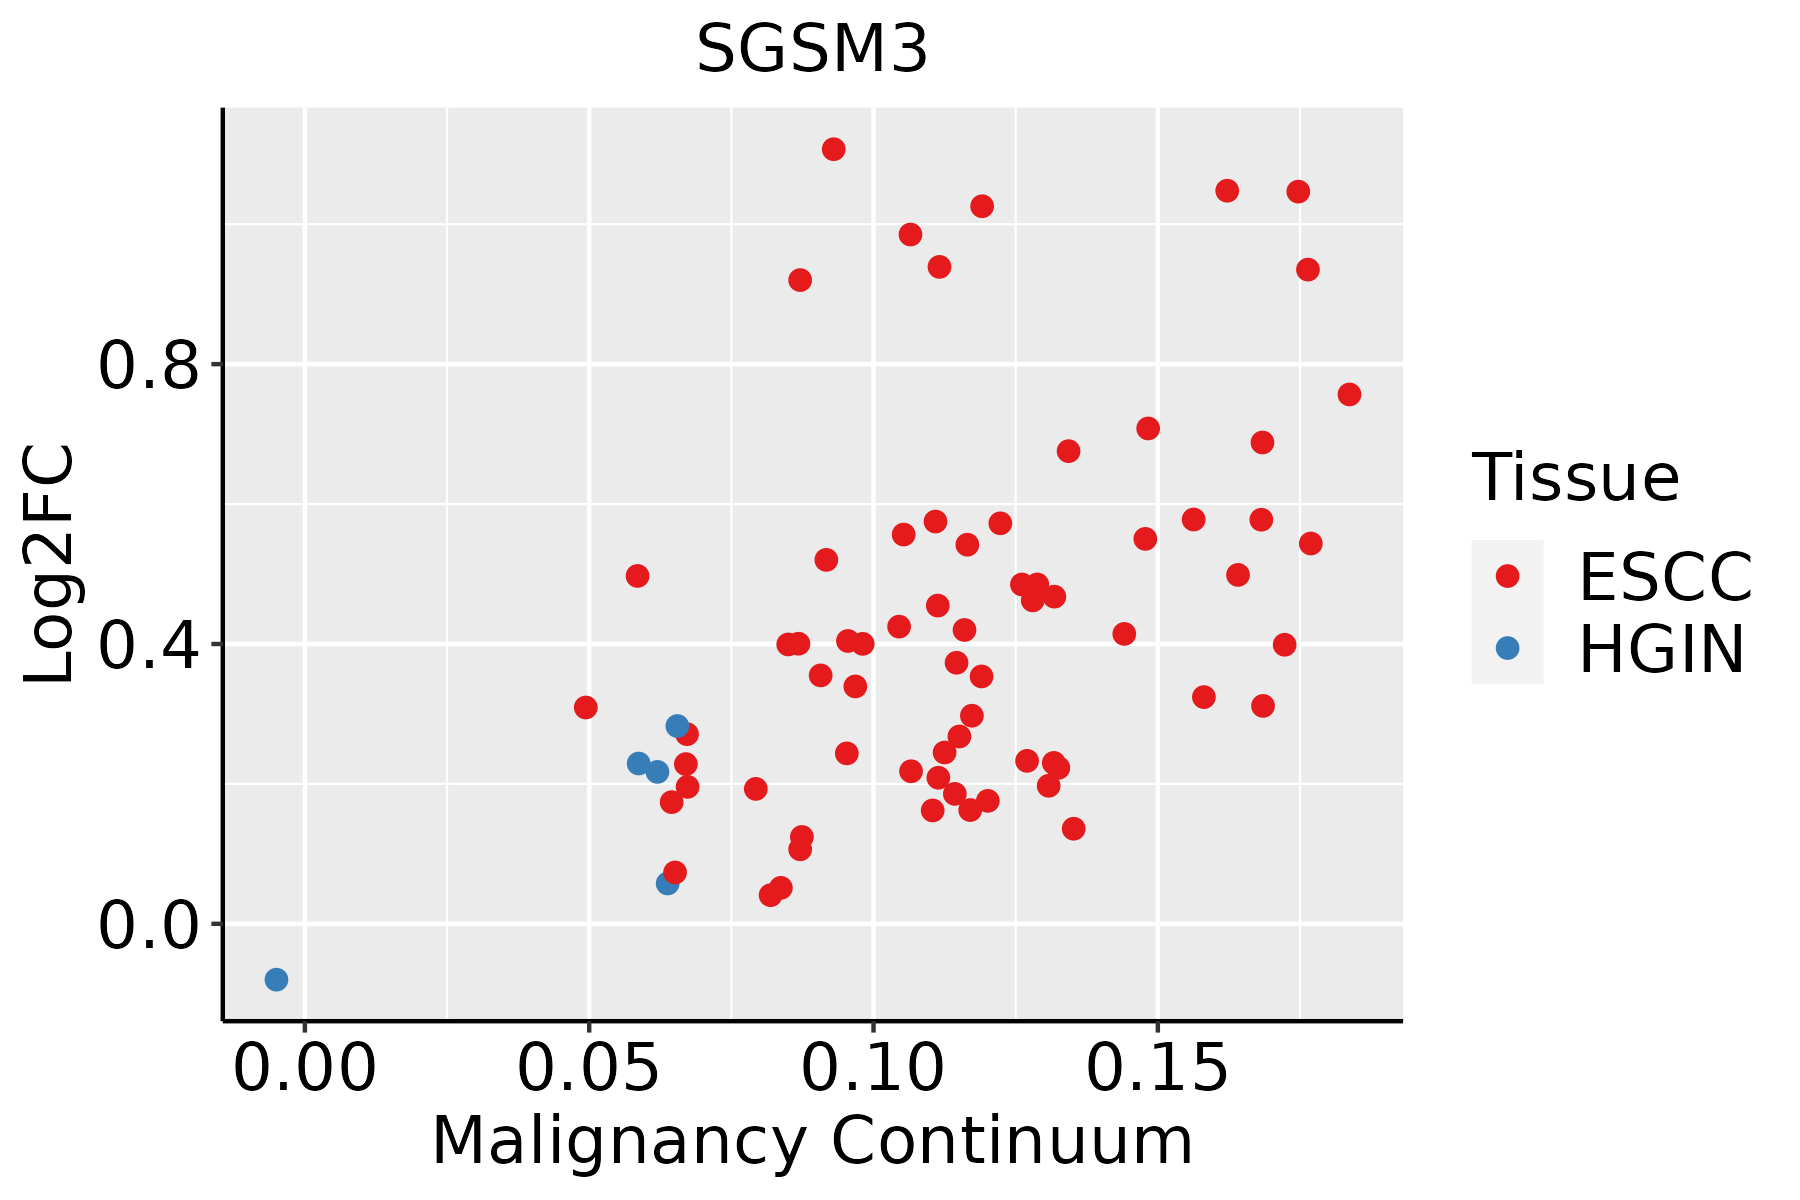 | ESCC: Esophageal squamous cell carcinoma |
| HGIN: High-grade intraepithelial neoplasias | ||
| LGIN: Low-grade intraepithelial neoplasias | ||
| Oral Cavity | 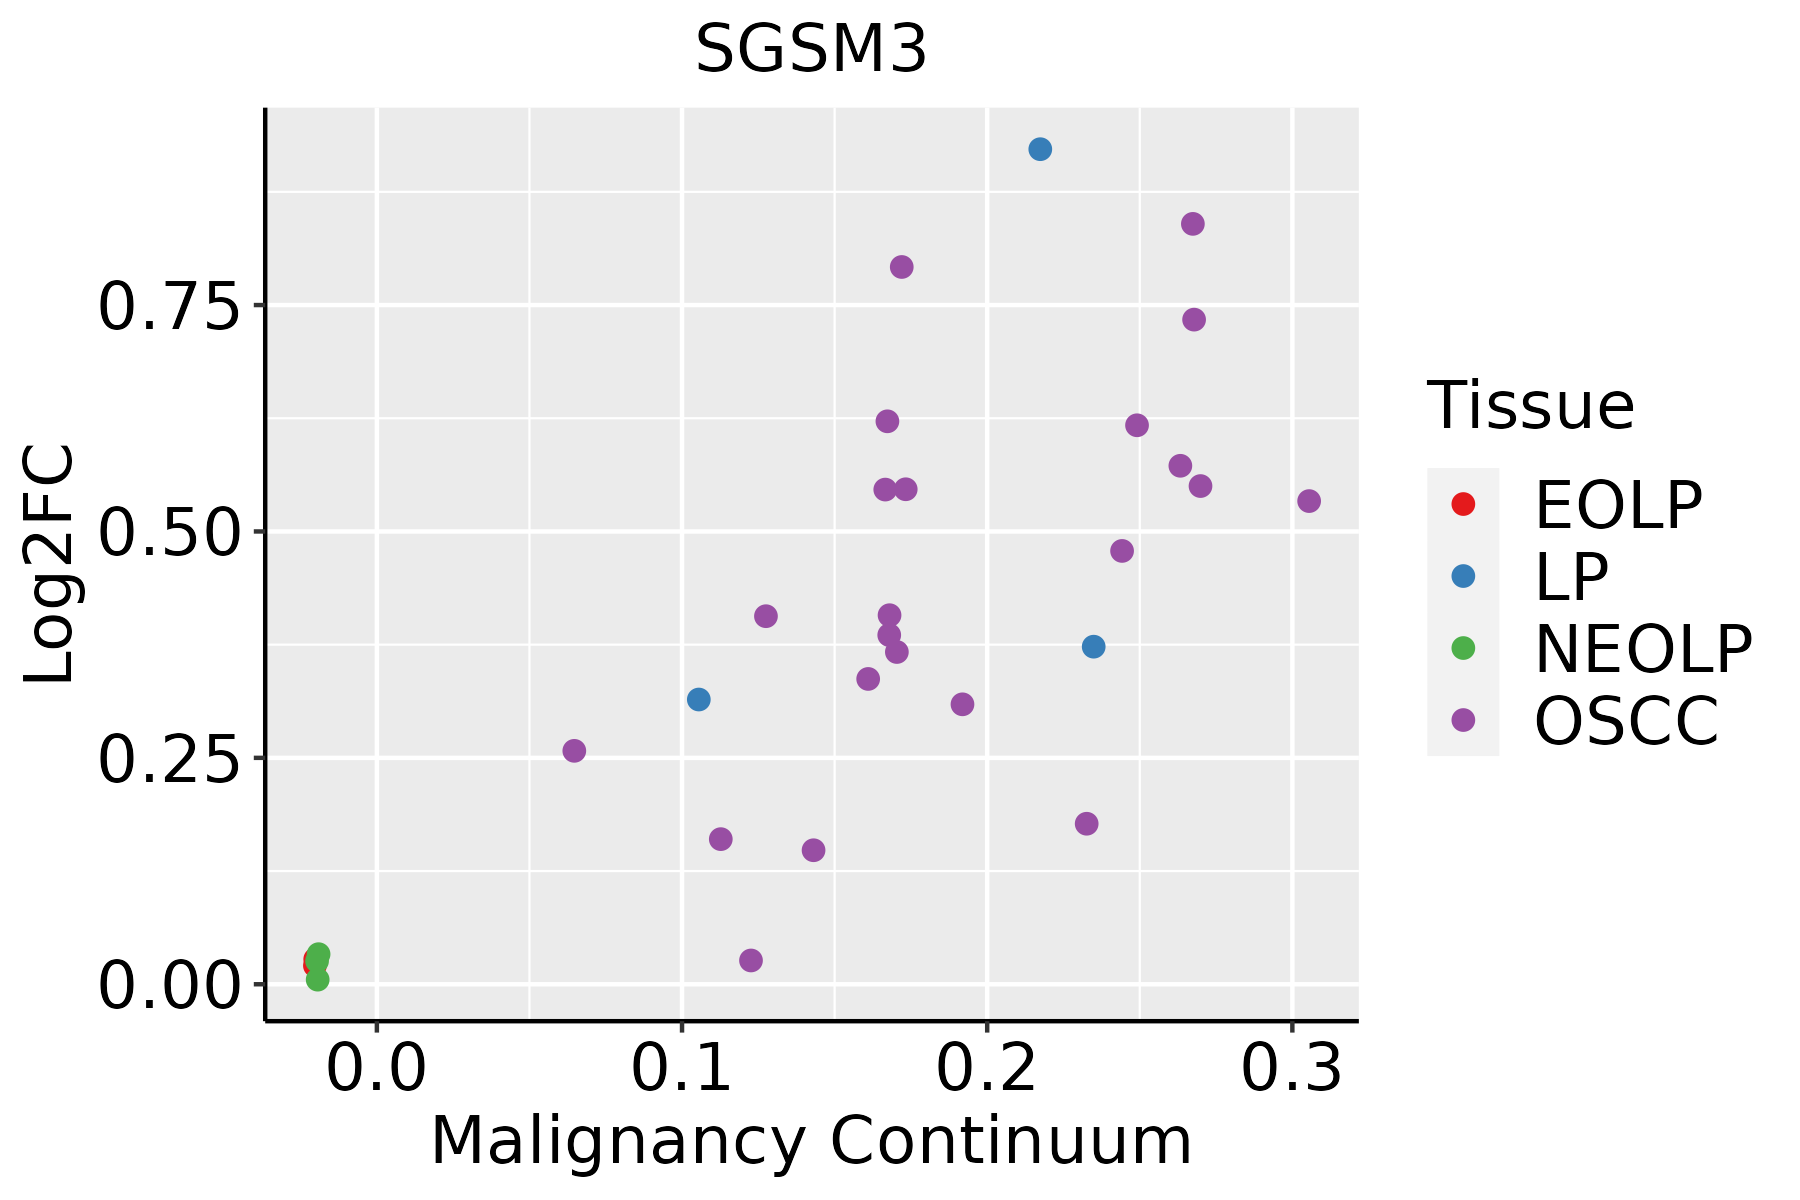 | EOLP: Erosive Oral lichen planus |
| LP: leukoplakia | ||
| NEOLP: Non-erosive oral lichen planus | ||
| OSCC: Oral squamous cell carcinoma | ||
| Prostate | 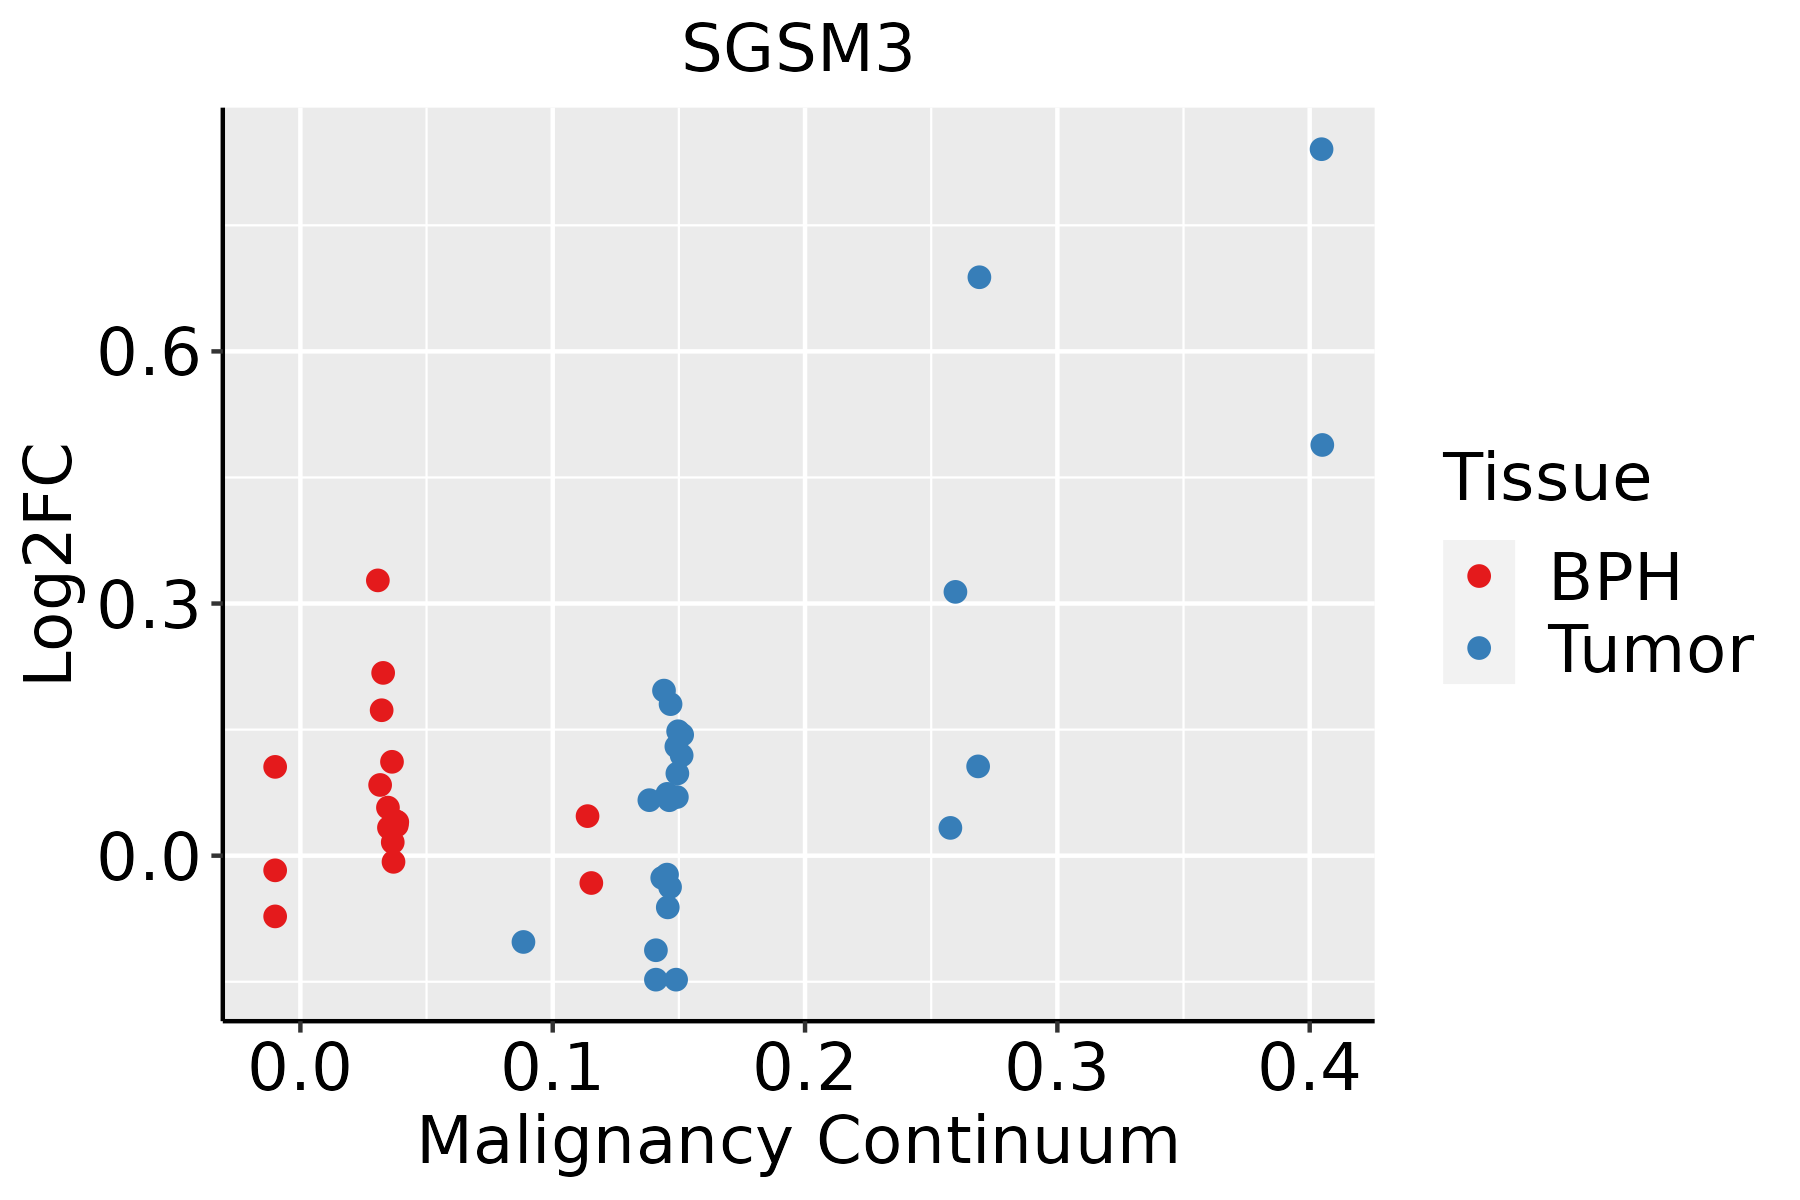 | BPH: Benign Prostatic Hyperplasia |
| Skin |  | AK: Actinic keratosis |
| cSCC: Cutaneous squamous cell carcinoma | ||
| SCCIS:squamous cell carcinoma in situ |
| ∗log2FC in expression of this searched gene in stem-like cells from each diseased tissue sample relative to stem-like cells in normal samples in each tissue plotted against the malignancy continuum. Samples are colored based on if they are from different disease stage. |
Top |
Malignant transformation related pathway analysis |
| Find out the enriched GO biological processes and KEGG pathways involved in transition from healthy to precancer to cancer |
| Tissue | Disease Stage | Enriched GO biological Processes |
| Colorectum | AD |  |
| Colorectum | SER |  |
| Colorectum | MSS |  |
| Colorectum | MSI-H |  |
| Colorectum | FAP |  |
| ∗Top 15 enriched GO BP terms are showed in the bar plot of each disease state in each tissue. Each row represents a significant GO biological process which is colored according to the -log10(p.adjust). |
| Page: 1 2 3 4 5 6 7 8 9 |
| GO ID | Tissue | Disease Stage | Description | Gene Ratio | Bg Ratio | pvalue | p.adjust | Count |
| GO:0042176 | Colorectum | AD | regulation of protein catabolic process | 160/3918 | 391/18723 | 1.06e-19 | 7.34e-17 | 160 |
| GO:0009896 | Colorectum | AD | positive regulation of catabolic process | 180/3918 | 492/18723 | 4.33e-16 | 1.94e-13 | 180 |
| GO:0045732 | Colorectum | AD | positive regulation of protein catabolic process | 92/3918 | 231/18723 | 3.85e-11 | 4.47e-09 | 92 |
| GO:0043087 | Colorectum | AD | regulation of GTPase activity | 110/3918 | 348/18723 | 1.64e-06 | 5.03e-05 | 110 |
| GO:0007265 | Colorectum | AD | Ras protein signal transduction | 104/3918 | 337/18723 | 1.01e-05 | 2.35e-04 | 104 |
| GO:0051056 | Colorectum | AD | regulation of small GTPase mediated signal transduction | 94/3918 | 302/18723 | 1.81e-05 | 3.76e-04 | 94 |
| GO:0043547 | Colorectum | AD | positive regulation of GTPase activity | 75/3918 | 255/18723 | 7.95e-04 | 7.91e-03 | 75 |
| GO:0046578 | Colorectum | AD | regulation of Ras protein signal transduction | 56/3918 | 189/18723 | 2.85e-03 | 2.14e-02 | 56 |
| GO:00421761 | Colorectum | SER | regulation of protein catabolic process | 126/2897 | 391/18723 | 5.33e-17 | 2.52e-14 | 126 |
| GO:00457321 | Colorectum | SER | positive regulation of protein catabolic process | 77/2897 | 231/18723 | 9.91e-12 | 1.90e-09 | 77 |
| GO:00098961 | Colorectum | SER | positive regulation of catabolic process | 132/2897 | 492/18723 | 4.16e-11 | 6.72e-09 | 132 |
| GO:00430871 | Colorectum | SER | regulation of GTPase activity | 77/2897 | 348/18723 | 5.90e-04 | 8.07e-03 | 77 |
| GO:00421762 | Colorectum | MSS | regulation of protein catabolic process | 145/3467 | 391/18723 | 2.03e-18 | 1.17e-15 | 145 |
| GO:00098962 | Colorectum | MSS | positive regulation of catabolic process | 163/3467 | 492/18723 | 3.10e-15 | 9.22e-13 | 163 |
| GO:00457322 | Colorectum | MSS | positive regulation of protein catabolic process | 85/3467 | 231/18723 | 3.66e-11 | 4.57e-09 | 85 |
| GO:00430872 | Colorectum | MSS | regulation of GTPase activity | 101/3467 | 348/18723 | 1.00e-06 | 3.46e-05 | 101 |
| GO:00072651 | Colorectum | MSS | Ras protein signal transduction | 91/3467 | 337/18723 | 7.20e-05 | 1.21e-03 | 91 |
| GO:00510561 | Colorectum | MSS | regulation of small GTPase mediated signal transduction | 82/3467 | 302/18723 | 1.31e-04 | 1.99e-03 | 82 |
| GO:00435471 | Colorectum | MSS | positive regulation of GTPase activity | 68/3467 | 255/18723 | 7.97e-04 | 8.38e-03 | 68 |
| GO:004217627 | Esophagus | HGIN | regulation of protein catabolic process | 119/2587 | 391/18723 | 8.09e-18 | 2.43e-15 | 119 |
| Page: 1 2 3 |
| Pathway ID | Tissue | Disease Stage | Description | Gene Ratio | Bg Ratio | pvalue | p.adjust | qvalue | Count |
| Page: 1 |
Top |
Cell-cell communication analysis |
| Identification of potential cell-cell interactions between two cell types and their ligand-receptor pairs for different disease states |
| Ligand | Receptor | LRpair | Pathway | Tissue | Disease Stage |
| Page: 1 |
Top |
Single-cell gene regulatory network inference analysis |
| Find out the significant the regulons (TFs) and the target genes of each regulon across cell types for different disease states |
| TF | Cell Type | Tissue | Disease Stage | Target Gene | RSS | Regulon Activity |
| ∗The dot plots of a searched regulon are shown for all cell subpopulations in each disease state of each tissue based on the regulon specific score inferred using pySCENIC and by calculating the average expression. |
| Page: 1 |
Top |
Somatic mutation of malignant transformation related genes |
| Annotation of somatic variants for genes involved in malignant transformation |
| Hugo Symbol | Variant Class | Variant Classification | dbSNP RS | HGVSc | HGVSp | HGVSp Short | SWISSPROT | BIOTYPE | SIFT | PolyPhen | Tumor Sample Barcode | Tissue | Histology | Sex | Age | Stage | Therapy Types | Drugs | Outcome |
| SGSM3 | insertion | Nonsense_Mutation | novel | c.515_516insAAAA | p.Cys172Ter | p.C172* | Q96HU1 | protein_coding | TCGA-FY-A4B0-01 | Thyroid | thyroid carcinoma | Male | >=65 | I/II | Hormone Therapy | synthroid | SD | ||
| SGSM3 | insertion | Frame_Shift_Ins | novel | c.1908_1909insT | p.Gln637SerfsTer28 | p.Q637Sfs*28 | Q96HU1 | protein_coding | TCGA-FY-A4B0-01 | Thyroid | thyroid carcinoma | Male | >=65 | I/II | Hormone Therapy | synthroid | SD |
| Page: 1 2 3 4 5 6 7 |
Top |
Related drugs of malignant transformation related genes |
| Identification of chemicals and drugs interact with genes involved in malignant transfromation |
| (DGIdb 4.0) |
| Entrez ID | Symbol | Category | Interaction Types | Drug Claim Name | Drug Name | PMIDs |
| 27352 | SGSM3 | NA | Demecolcine | DEMECOLCINE | ||
| 27352 | SGSM3 | NA | RG7304 |
| Page: 1 |

Copyright 2023-Present -The University of Texas Health Science Center at Houston |