
|
|||||
|
 | |
| |
| |
| |
| |
| |
|
Gene: SFRP4 |
Gene summary for SFRP4 |
| Gene information | Species | Human | Gene symbol | SFRP4 | Gene ID | 6424 |
| Gene name | secreted frizzled related protein 4 | |
| Gene Alias | FRP-4 | |
| Cytomap | 7p14.1 | |
| Gene Type | protein-coding | GO ID | GO:0001501 | UniProtAcc | Q6FHJ7 |
Top |
Malignant transformation analysis |
| Identification of the aberrant gene expression in precancerous and cancerous lesions by comparing the gene expression of stem-like cells in diseased tissues with normal stem cells |
| Entrez ID | Symbol | Replicates | Species | Organ | Tissue | Adj P-value | Log2FC | Malignancy |
| 6424 | SFRP4 | AEH-subject1 | Human | Endometrium | AEH | 1.20e-85 | -1.83e+00 | -0.3059 |
| 6424 | SFRP4 | AEH-subject2 | Human | Endometrium | AEH | 1.24e-68 | -1.72e+00 | -0.2525 |
| 6424 | SFRP4 | AEH-subject3 | Human | Endometrium | AEH | 5.47e-38 | -1.12e+00 | -0.2576 |
| 6424 | SFRP4 | AEH-subject4 | Human | Endometrium | AEH | 1.99e-17 | -7.81e-01 | -0.2657 |
| 6424 | SFRP4 | AEH-subject5 | Human | Endometrium | AEH | 9.23e-92 | -1.87e+00 | -0.2953 |
| 6424 | SFRP4 | EEC-subject1 | Human | Endometrium | EEC | 3.63e-79 | -1.79e+00 | -0.2682 |
| 6424 | SFRP4 | EEC-subject2 | Human | Endometrium | EEC | 1.01e-92 | -1.85e+00 | -0.2607 |
| 6424 | SFRP4 | EEC-subject3 | Human | Endometrium | EEC | 1.48e-84 | -1.78e+00 | -0.2525 |
| 6424 | SFRP4 | EEC-subject4 | Human | Endometrium | EEC | 3.71e-82 | -1.81e+00 | -0.2571 |
| 6424 | SFRP4 | EEC-subject5 | Human | Endometrium | EEC | 2.94e-80 | -1.78e+00 | -0.249 |
| 6424 | SFRP4 | GSM5276934 | Human | Endometrium | EEC | 4.88e-22 | -7.25e-01 | -0.0913 |
| 6424 | SFRP4 | GSM5276935 | Human | Endometrium | EEC | 5.77e-96 | -1.88e+00 | -0.123 |
| 6424 | SFRP4 | GSM5276937 | Human | Endometrium | EEC | 1.10e-09 | -4.68e-01 | -0.0897 |
| 6424 | SFRP4 | GSM6177620_NYU_UCEC1_lib1_lib1 | Human | Endometrium | EEC | 6.25e-76 | -1.89e+00 | -0.1869 |
| 6424 | SFRP4 | GSM6177620_NYU_UCEC1_lib2_lib2 | Human | Endometrium | EEC | 5.19e-69 | -1.89e+00 | -0.1875 |
| 6424 | SFRP4 | GSM6177620_NYU_UCEC1_lib3_lib3 | Human | Endometrium | EEC | 3.93e-78 | -1.89e+00 | -0.1883 |
| 6424 | SFRP4 | GSM6177621_NYU_UCEC2_lib1_lib1 | Human | Endometrium | EEC | 2.55e-89 | -1.86e+00 | -0.1934 |
| 6424 | SFRP4 | GSM6177622_NYU_UCEC3_lib1_lib1 | Human | Endometrium | EEC | 5.01e-99 | -1.89e+00 | -0.1917 |
| 6424 | SFRP4 | GSM6177622_NYU_UCEC3_lib2_lib2 | Human | Endometrium | EEC | 1.13e-96 | -1.89e+00 | -0.1916 |
| 6424 | SFRP4 | GSM6177623_NYU_UCEC3_Vis | Human | Endometrium | EEC | 3.75e-59 | -1.56e+00 | -0.1269 |
| Page: 1 2 |
| Tissue | Expression Dynamics | Abbreviation |
| Endometrium | 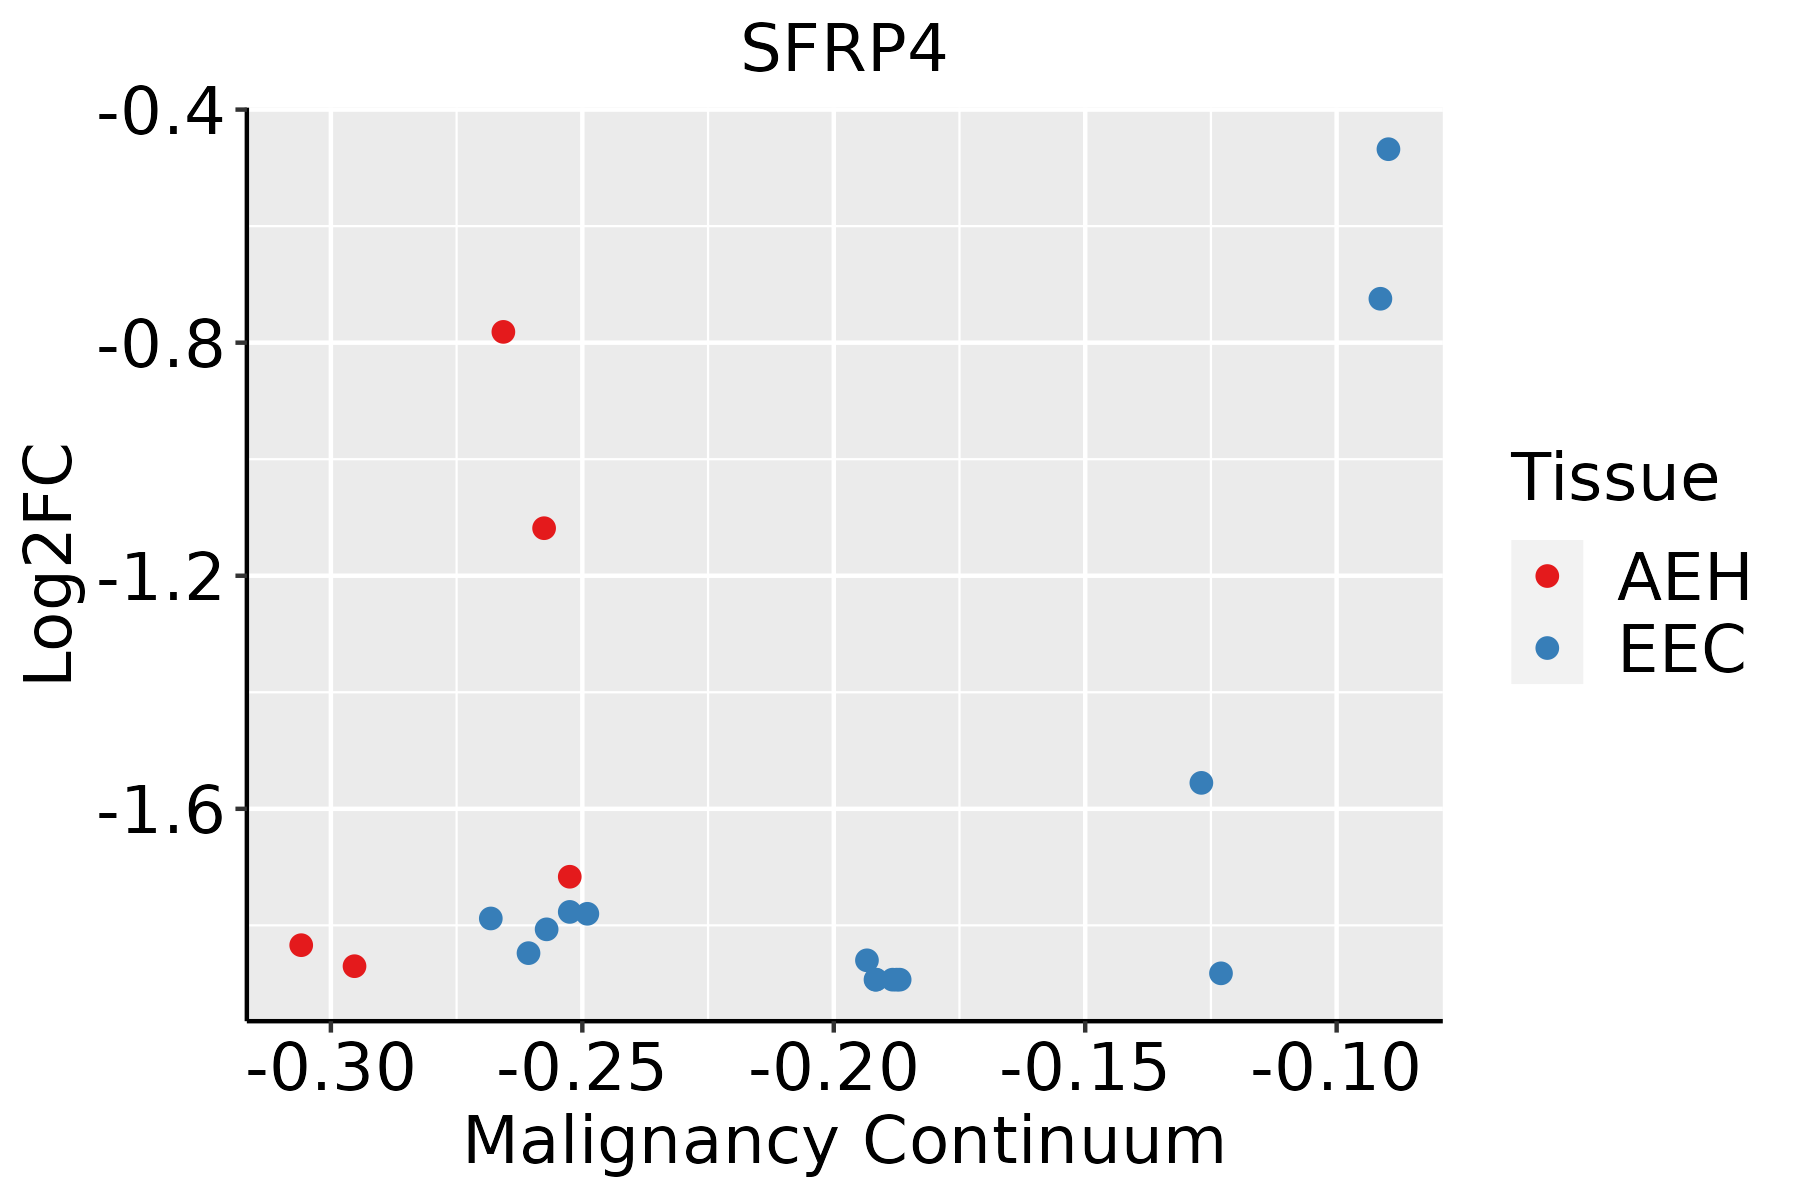 | AEH: Atypical endometrial hyperplasia |
| EEC: Endometrioid Cancer | ||
| Esophagus |  | ESCC: Esophageal squamous cell carcinoma |
| HGIN: High-grade intraepithelial neoplasias | ||
| LGIN: Low-grade intraepithelial neoplasias | ||
| Oral Cavity |  | EOLP: Erosive Oral lichen planus |
| LP: leukoplakia | ||
| NEOLP: Non-erosive oral lichen planus | ||
| OSCC: Oral squamous cell carcinoma | ||
| Thyroid | 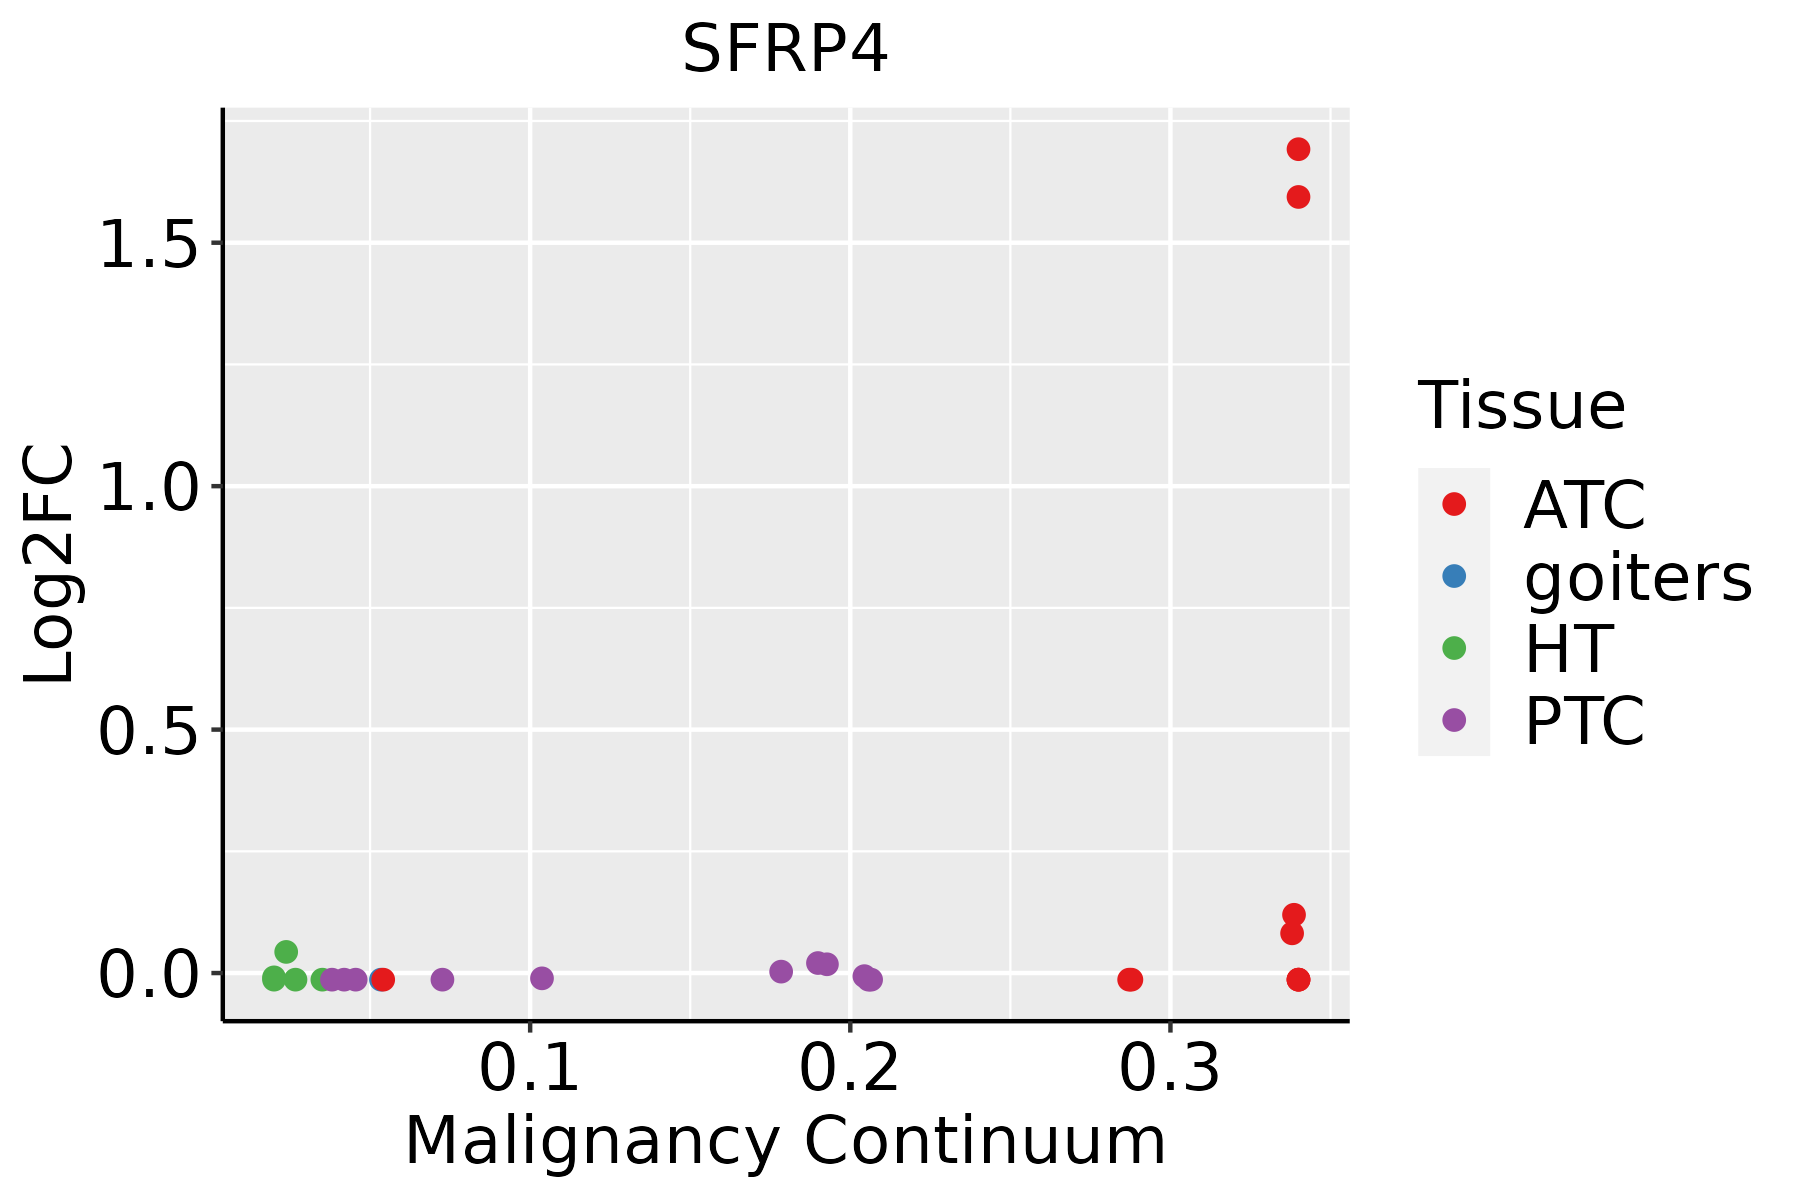 | ATC: Anaplastic thyroid cancer |
| HT: Hashimoto's thyroiditis | ||
| PTC: Papillary thyroid cancer |
| ∗log2FC in expression of this searched gene in stem-like cells from each diseased tissue sample relative to stem-like cells in normal samples in each tissue plotted against the malignancy continuum. Samples are colored based on if they are from different disease stage. |
Top |
Malignant transformation related pathway analysis |
| Find out the enriched GO biological processes and KEGG pathways involved in transition from healthy to precancer to cancer |
| Tissue | Disease Stage | Enriched GO biological Processes |
| Colorectum | AD |  |
| Colorectum | SER |  |
| Colorectum | MSS |  |
| Colorectum | MSI-H |  |
| Colorectum | FAP |  |
| ∗Top 15 enriched GO BP terms are showed in the bar plot of each disease state in each tissue. Each row represents a significant GO biological process which is colored according to the -log10(p.adjust). |
| Page: 1 2 3 4 5 6 7 8 9 |
| GO ID | Tissue | Disease Stage | Description | Gene Ratio | Bg Ratio | pvalue | p.adjust | Count |
| GO:00301118 | Endometrium | AEH | regulation of Wnt signaling pathway | 71/2100 | 328/18723 | 3.31e-08 | 1.87e-06 | 71 |
| GO:00160558 | Endometrium | AEH | Wnt signaling pathway | 85/2100 | 444/18723 | 4.99e-07 | 1.97e-05 | 85 |
| GO:01987388 | Endometrium | AEH | cell-cell signaling by wnt | 85/2100 | 446/18723 | 6.07e-07 | 2.29e-05 | 85 |
| GO:00608288 | Endometrium | AEH | regulation of canonical Wnt signaling pathway | 54/2100 | 253/18723 | 2.22e-06 | 6.56e-05 | 54 |
| GO:00301777 | Endometrium | AEH | positive regulation of Wnt signaling pathway | 34/2100 | 140/18723 | 9.62e-06 | 2.23e-04 | 34 |
| GO:00071787 | Endometrium | AEH | transmembrane receptor protein serine/threonine kinase signaling pathway | 67/2100 | 355/18723 | 1.28e-05 | 2.80e-04 | 67 |
| GO:00482598 | Endometrium | AEH | regulation of receptor-mediated endocytosis | 28/2100 | 110/18723 | 2.28e-05 | 4.35e-04 | 28 |
| GO:00600708 | Endometrium | AEH | canonical Wnt signaling pathway | 58/2100 | 303/18723 | 3.12e-05 | 5.66e-04 | 58 |
| GO:00301009 | Endometrium | AEH | regulation of endocytosis | 44/2100 | 211/18723 | 3.39e-05 | 6.05e-04 | 44 |
| GO:00068988 | Endometrium | AEH | receptor-mediated endocytosis | 49/2100 | 244/18723 | 3.54e-05 | 6.24e-04 | 49 |
| GO:00902637 | Endometrium | AEH | positive regulation of canonical Wnt signaling pathway | 26/2100 | 106/18723 | 8.63e-05 | 1.27e-03 | 26 |
| GO:00482608 | Endometrium | AEH | positive regulation of receptor-mediated endocytosis | 16/2100 | 52/18723 | 1.18e-04 | 1.66e-03 | 16 |
| GO:00510515 | Endometrium | AEH | negative regulation of transport | 79/2100 | 470/18723 | 1.51e-04 | 1.99e-03 | 79 |
| GO:00431128 | Endometrium | AEH | receptor metabolic process | 35/2100 | 166/18723 | 1.64e-04 | 2.15e-03 | 35 |
| GO:00308564 | Endometrium | AEH | regulation of epithelial cell differentiation | 33/2100 | 154/18723 | 1.81e-04 | 2.32e-03 | 33 |
| GO:00458078 | Endometrium | AEH | positive regulation of endocytosis | 24/2100 | 100/18723 | 2.27e-04 | 2.75e-03 | 24 |
| GO:00316237 | Endometrium | AEH | receptor internalization | 26/2100 | 113/18723 | 2.62e-04 | 3.08e-03 | 26 |
| GO:00305092 | Endometrium | AEH | BMP signaling pathway | 32/2100 | 152/18723 | 3.15e-04 | 3.54e-03 | 32 |
| GO:00301785 | Endometrium | AEH | negative regulation of Wnt signaling pathway | 34/2100 | 170/18723 | 5.63e-04 | 5.62e-03 | 34 |
| GO:00020902 | Endometrium | AEH | regulation of receptor internalization | 15/2100 | 56/18723 | 9.88e-04 | 8.90e-03 | 15 |
| Page: 1 2 3 4 5 6 |
| Pathway ID | Tissue | Disease Stage | Description | Gene Ratio | Bg Ratio | pvalue | p.adjust | qvalue | Count |
| hsa0431010 | Endometrium | AEH | Wnt signaling pathway | 37/1197 | 171/8465 | 4.68e-03 | 2.53e-02 | 1.86e-02 | 37 |
| hsa0431013 | Endometrium | AEH | Wnt signaling pathway | 37/1197 | 171/8465 | 4.68e-03 | 2.53e-02 | 1.86e-02 | 37 |
| hsa0431022 | Endometrium | EEC | Wnt signaling pathway | 40/1237 | 171/8465 | 1.37e-03 | 8.99e-03 | 6.70e-03 | 40 |
| hsa0431032 | Endometrium | EEC | Wnt signaling pathway | 40/1237 | 171/8465 | 1.37e-03 | 8.99e-03 | 6.70e-03 | 40 |
| Page: 1 |
Top |
Cell-cell communication analysis |
| Identification of potential cell-cell interactions between two cell types and their ligand-receptor pairs for different disease states |
| Ligand | Receptor | LRpair | Pathway | Tissue | Disease Stage |
| Page: 1 |
Top |
Single-cell gene regulatory network inference analysis |
| Find out the significant the regulons (TFs) and the target genes of each regulon across cell types for different disease states |
| TF | Cell Type | Tissue | Disease Stage | Target Gene | RSS | Regulon Activity |
| ∗The dot plots of a searched regulon are shown for all cell subpopulations in each disease state of each tissue based on the regulon specific score inferred using pySCENIC and by calculating the average expression. |
| Page: 1 |
Top |
Somatic mutation of malignant transformation related genes |
| Annotation of somatic variants for genes involved in malignant transformation |
| Hugo Symbol | Variant Class | Variant Classification | dbSNP RS | HGVSc | HGVSp | HGVSp Short | SWISSPROT | BIOTYPE | SIFT | PolyPhen | Tumor Sample Barcode | Tissue | Histology | Sex | Age | Stage | Therapy Types | Drugs | Outcome |
| SFRP4 | SNV | Missense_Mutation | rs112054297 | c.586N>G | p.Ser196Gly | p.S196G | Q6FHJ7 | protein_coding | tolerated(0.05) | possibly_damaging(0.831) | TCGA-CV-7242-01 | Oral cavity | head & neck squamous cell carcinoma | Female | <65 | I/II | Unknown | Unknown | SD |
| SFRP4 | SNV | Missense_Mutation | novel | c.898G>A | p.Asp300Asn | p.D300N | Q6FHJ7 | protein_coding | tolerated_low_confidence(0.46) | benign(0) | TCGA-D6-6516-01 | Oral cavity | head & neck squamous cell carcinoma | Male | >=65 | I/II | Unknown | Unknown | SD |
| SFRP4 | SNV | Missense_Mutation | rs748182253 | c.785N>A | p.Arg262His | p.R262H | Q6FHJ7 | protein_coding | tolerated(0.16) | possibly_damaging(0.616) | TCGA-HD-7832-01 | Oral cavity | head & neck squamous cell carcinoma | Male | <65 | I/II | Unknown | Unknown | SD |
| SFRP4 | SNV | Missense_Mutation | novel | c.55G>A | p.Val19Met | p.V19M | Q6FHJ7 | protein_coding | tolerated(0.16) | possibly_damaging(0.781) | TCGA-MT-A51X-01 | Oral cavity | head & neck squamous cell carcinoma | Male | <65 | I/II | Unknown | Unknown | SD |
| SFRP4 | SNV | Missense_Mutation | novel | c.85N>G | p.Ile29Val | p.I29V | Q6FHJ7 | protein_coding | tolerated(0.12) | possibly_damaging(0.592) | TCGA-TN-A7HL-01 | Oral cavity | head & neck squamous cell carcinoma | Male | <65 | I/II | Chemotherapy | cisplatin | CR |
| SFRP4 | SNV | Missense_Mutation | c.74N>T | p.Glu25Val | p.E25V | Q6FHJ7 | protein_coding | deleterious(0) | probably_damaging(0.995) | TCGA-BR-4363-01 | Stomach | stomach adenocarcinoma | Female | <65 | III/IV | Unknown | Unknown | SD | |
| SFRP4 | SNV | Missense_Mutation | c.320N>G | p.Asp107Gly | p.D107G | Q6FHJ7 | protein_coding | tolerated(1) | benign(0) | TCGA-BR-8297-01 | Stomach | stomach adenocarcinoma | Male | <65 | III/IV | Chemotherapy | etoposide | SD | |
| SFRP4 | SNV | Missense_Mutation | novel | c.831N>C | p.Arg277Ser | p.R277S | Q6FHJ7 | protein_coding | tolerated(0.07) | benign(0.026) | TCGA-VQ-A8P2-01 | Stomach | stomach adenocarcinoma | Male | >=65 | III/IV | Unspecific | Complete Response | |
| SFRP4 | SNV | Missense_Mutation | rs367982958 | c.212N>T | p.Ala71Val | p.A71V | Q6FHJ7 | protein_coding | deleterious(0.01) | benign(0.16) | TCGA-VQ-A8P2-01 | Stomach | stomach adenocarcinoma | Male | >=65 | III/IV | Unspecific | Complete Response | |
| SFRP4 | SNV | Missense_Mutation | novel | c.293N>C | p.Lys98Thr | p.K98T | Q6FHJ7 | protein_coding | deleterious(0) | probably_damaging(0.985) | TCGA-VQ-A94R-01 | Stomach | stomach adenocarcinoma | Male | <65 | III/IV | Chemotherapy | fluorouracil | PD |
| Page: 1 2 3 4 5 6 7 8 |
Top |
Related drugs of malignant transformation related genes |
| Identification of chemicals and drugs interact with genes involved in malignant transfromation |
| (DGIdb 4.0) |
| Entrez ID | Symbol | Category | Interaction Types | Drug Claim Name | Drug Name | PMIDs |
| Page: 1 |

Copyright 2023-Present -The University of Texas Health Science Center at Houston |