
|
|||||
|
 | |
| |
| |
| |
| |
| |
|
Gene: KMT2B |
Gene summary for KMT2B |
| Gene information | Species | Human | Gene symbol | KMT2B | Gene ID | 9757 |
| Gene name | lysine methyltransferase 2B | |
| Gene Alias | CXXC10 | |
| Cytomap | 19q13.12 | |
| Gene Type | protein-coding | GO ID | GO:0006139 | UniProtAcc | Q9UMN6 |
Top |
Malignant transformation analysis |
| Identification of the aberrant gene expression in precancerous and cancerous lesions by comparing the gene expression of stem-like cells in diseased tissues with normal stem cells |
| Entrez ID | Symbol | Replicates | Species | Organ | Tissue | Adj P-value | Log2FC | Malignancy |
| 9757 | KMT2B | HCC1_Meng | Human | Liver | HCC | 3.58e-30 | 5.75e-02 | 0.0246 |
| 9757 | KMT2B | HCC2_Meng | Human | Liver | HCC | 6.08e-17 | 1.27e-01 | 0.0107 |
| 9757 | KMT2B | HCC1 | Human | Liver | HCC | 2.52e-05 | 3.63e+00 | 0.5336 |
| 9757 | KMT2B | HCC2 | Human | Liver | HCC | 1.30e-08 | 2.47e+00 | 0.5341 |
| 9757 | KMT2B | HCC5 | Human | Liver | HCC | 1.32e-03 | 2.02e+00 | 0.4932 |
| 9757 | KMT2B | Pt14.a | Human | Liver | HCC | 2.79e-02 | 2.38e-01 | 0.0169 |
| 9757 | KMT2B | S014 | Human | Liver | HCC | 8.24e-06 | 3.65e-01 | 0.2254 |
| 9757 | KMT2B | S015 | Human | Liver | HCC | 9.57e-07 | 4.93e-01 | 0.2375 |
| 9757 | KMT2B | S016 | Human | Liver | HCC | 8.71e-05 | 3.20e-01 | 0.2243 |
| 9757 | KMT2B | S028 | Human | Liver | HCC | 7.15e-18 | 6.56e-01 | 0.2503 |
| 9757 | KMT2B | S029 | Human | Liver | HCC | 3.64e-10 | 5.07e-01 | 0.2581 |
| 9757 | KMT2B | male-WTA | Human | Thyroid | PTC | 1.22e-05 | 1.01e-01 | 0.1037 |
| 9757 | KMT2B | PTC01 | Human | Thyroid | PTC | 3.94e-03 | 7.97e-02 | 0.1899 |
| 9757 | KMT2B | PTC03 | Human | Thyroid | PTC | 9.73e-04 | 2.25e-01 | 0.1784 |
| 9757 | KMT2B | PTC04 | Human | Thyroid | PTC | 5.51e-17 | 3.24e-01 | 0.1927 |
| 9757 | KMT2B | PTC05 | Human | Thyroid | PTC | 1.02e-10 | 4.42e-01 | 0.2065 |
| 9757 | KMT2B | PTC06 | Human | Thyroid | PTC | 8.07e-32 | 7.18e-01 | 0.2057 |
| 9757 | KMT2B | PTC07 | Human | Thyroid | PTC | 5.36e-30 | 5.48e-01 | 0.2044 |
| 9757 | KMT2B | ATC09 | Human | Thyroid | ATC | 3.05e-07 | 2.49e-01 | 0.2871 |
| 9757 | KMT2B | ATC12 | Human | Thyroid | ATC | 2.54e-11 | 1.54e-01 | 0.34 |
| Page: 1 2 |
| Tissue | Expression Dynamics | Abbreviation |
| Liver |  | HCC: Hepatocellular carcinoma |
| NAFLD: Non-alcoholic fatty liver disease | ||
| Thyroid | 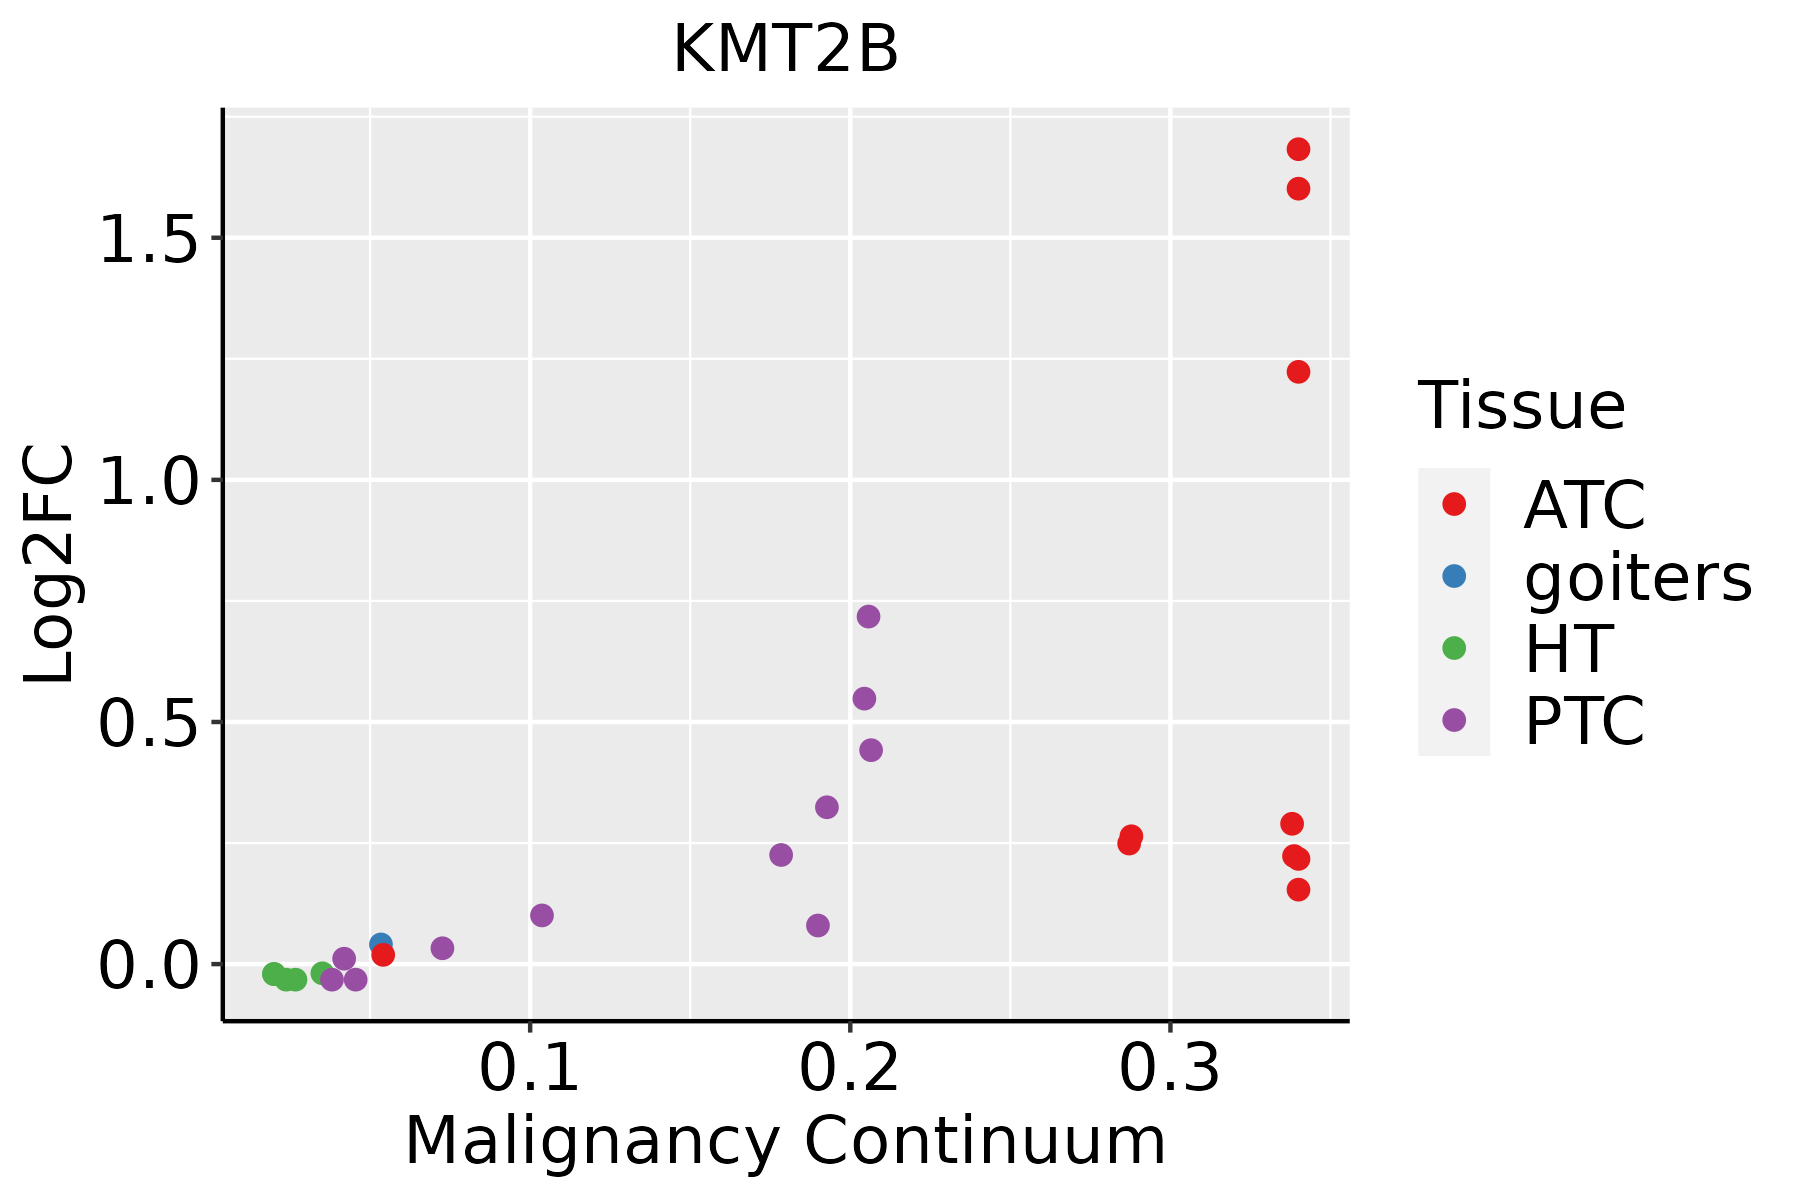 | ATC: Anaplastic thyroid cancer |
| HT: Hashimoto's thyroiditis | ||
| PTC: Papillary thyroid cancer |
| ∗log2FC in expression of this searched gene in stem-like cells from each diseased tissue sample relative to stem-like cells in normal samples in each tissue plotted against the malignancy continuum. Samples are colored based on if they are from different disease stage. |
Top |
Malignant transformation related pathway analysis |
| Find out the enriched GO biological processes and KEGG pathways involved in transition from healthy to precancer to cancer |
| Tissue | Disease Stage | Enriched GO biological Processes |
| Colorectum | AD |  |
| Colorectum | SER |  |
| Colorectum | MSS |  |
| Colorectum | MSI-H |  |
| Colorectum | FAP |  |
| ∗Top 15 enriched GO BP terms are showed in the bar plot of each disease state in each tissue. Each row represents a significant GO biological process which is colored according to the -log10(p.adjust). |
| Page: 1 2 3 4 5 6 7 8 9 |
| GO ID | Tissue | Disease Stage | Description | Gene Ratio | Bg Ratio | pvalue | p.adjust | Count |
| GO:001657021 | Liver | HCC | histone modification | 283/7958 | 463/18723 | 2.68e-16 | 2.33e-14 | 283 |
| GO:00182052 | Liver | HCC | peptidyl-lysine modification | 230/7958 | 376/18723 | 1.51e-13 | 8.32e-12 | 230 |
| GO:00434141 | Liver | HCC | macromolecule methylation | 183/7958 | 316/18723 | 2.00e-08 | 4.72e-07 | 183 |
| GO:0032259 | Liver | HCC | methylation | 206/7958 | 364/18723 | 3.35e-08 | 7.53e-07 | 206 |
| GO:00064792 | Liver | HCC | protein methylation | 111/7958 | 181/18723 | 2.36e-07 | 4.18e-06 | 111 |
| GO:00082132 | Liver | HCC | protein alkylation | 111/7958 | 181/18723 | 2.36e-07 | 4.18e-06 | 111 |
| GO:00165712 | Liver | HCC | histone methylation | 88/7958 | 141/18723 | 1.41e-06 | 2.02e-05 | 88 |
| GO:00349681 | Liver | HCC | histone lysine methylation | 70/7958 | 115/18723 | 5.32e-05 | 5.04e-04 | 70 |
| GO:00180221 | Liver | HCC | peptidyl-lysine methylation | 74/7958 | 131/18723 | 8.46e-04 | 5.06e-03 | 74 |
| GO:0051568 | Liver | HCC | histone H3-K4 methylation | 36/7958 | 59/18723 | 3.15e-03 | 1.46e-02 | 36 |
| GO:001657010 | Thyroid | PTC | histone modification | 235/5968 | 463/18723 | 1.17e-17 | 1.15e-15 | 235 |
| GO:00182059 | Thyroid | PTC | peptidyl-lysine modification | 188/5968 | 376/18723 | 1.34e-13 | 7.09e-12 | 188 |
| GO:001657110 | Thyroid | PTC | histone methylation | 67/5968 | 141/18723 | 7.31e-05 | 6.31e-04 | 67 |
| GO:000647910 | Thyroid | PTC | protein methylation | 82/5968 | 181/18723 | 1.01e-04 | 8.21e-04 | 82 |
| GO:000821310 | Thyroid | PTC | protein alkylation | 82/5968 | 181/18723 | 1.01e-04 | 8.21e-04 | 82 |
| GO:00322594 | Thyroid | PTC | methylation | 146/5968 | 364/18723 | 4.99e-04 | 3.26e-03 | 146 |
| GO:00434145 | Thyroid | PTC | macromolecule methylation | 127/5968 | 316/18723 | 1.02e-03 | 6.07e-03 | 127 |
| GO:003496810 | Thyroid | PTC | histone lysine methylation | 52/5968 | 115/18723 | 1.82e-03 | 9.84e-03 | 52 |
| GO:001657017 | Thyroid | ATC | histone modification | 243/6293 | 463/18723 | 2.23e-17 | 2.27e-15 | 243 |
| GO:001820516 | Thyroid | ATC | peptidyl-lysine modification | 193/6293 | 376/18723 | 6.92e-13 | 3.06e-11 | 193 |
| Page: 1 2 |
| Pathway ID | Tissue | Disease Stage | Description | Gene Ratio | Bg Ratio | pvalue | p.adjust | qvalue | Count |
| hsa0031041 | Liver | HCC | Lysine degradation | 47/4020 | 63/8465 | 1.02e-05 | 7.58e-05 | 4.22e-05 | 47 |
| hsa0031051 | Liver | HCC | Lysine degradation | 47/4020 | 63/8465 | 1.02e-05 | 7.58e-05 | 4.22e-05 | 47 |
| Page: 1 |
Top |
Cell-cell communication analysis |
| Identification of potential cell-cell interactions between two cell types and their ligand-receptor pairs for different disease states |
| Ligand | Receptor | LRpair | Pathway | Tissue | Disease Stage |
| Page: 1 |
Top |
Single-cell gene regulatory network inference analysis |
| Find out the significant the regulons (TFs) and the target genes of each regulon across cell types for different disease states |
| TF | Cell Type | Tissue | Disease Stage | Target Gene | RSS | Regulon Activity |
| ∗The dot plots of a searched regulon are shown for all cell subpopulations in each disease state of each tissue based on the regulon specific score inferred using pySCENIC and by calculating the average expression. |
| Page: 1 |
Top |
Somatic mutation of malignant transformation related genes |
| Annotation of somatic variants for genes involved in malignant transformation |
| Hugo Symbol | Variant Class | Variant Classification | dbSNP RS | HGVSc | HGVSp | HGVSp Short | SWISSPROT | BIOTYPE | SIFT | PolyPhen | Tumor Sample Barcode | Tissue | Histology | Sex | Age | Stage | Therapy Types | Drugs | Outcome |
| KMT2B | SNV | Missense_Mutation | rs750345473 | c.5572N>T | p.Arg1858Cys | p.R1858C | Q9UMN6 | protein_coding | deleterious(0) | probably_damaging(0.928) | TCGA-CM-6162-01 | Colorectum | colon adenocarcinoma | Female | <65 | III/IV | Chemotherapy | oxaliplatin | SD |
| KMT2B | SNV | Missense_Mutation | c.4790G>A | p.Arg1597Gln | p.R1597Q | Q9UMN6 | protein_coding | deleterious(0.01) | probably_damaging(0.992) | TCGA-CM-6171-01 | Colorectum | colon adenocarcinoma | Female | >=65 | I/II | Unknown | Unknown | SD | |
| KMT2B | SNV | Missense_Mutation | c.4622N>T | p.Ala1541Val | p.A1541V | Q9UMN6 | protein_coding | deleterious(0) | probably_damaging(0.994) | TCGA-CM-6674-01 | Colorectum | colon adenocarcinoma | Male | <65 | I/II | Unknown | Unknown | SD | |
| KMT2B | SNV | Missense_Mutation | rs759167832 | c.6994N>T | p.Arg2332Cys | p.R2332C | Q9UMN6 | protein_coding | deleterious(0) | probably_damaging(0.965) | TCGA-D5-6540-01 | Colorectum | colon adenocarcinoma | Male | >=65 | I/II | Unknown | Unknown | SD |
| KMT2B | SNV | Missense_Mutation | c.7216N>A | p.Ala2406Thr | p.A2406T | Q9UMN6 | protein_coding | tolerated(0.31) | benign(0) | TCGA-DM-A1HB-01 | Colorectum | colon adenocarcinoma | Male | >=65 | III/IV | Unknown | Unknown | SD | |
| KMT2B | SNV | Missense_Mutation | c.2908N>T | p.Arg970Trp | p.R970W | Q9UMN6 | protein_coding | deleterious(0) | probably_damaging(0.981) | TCGA-G4-6304-01 | Colorectum | colon adenocarcinoma | Female | >=65 | I/II | Chemotherapy | fluorouracil | PD | |
| KMT2B | SNV | Missense_Mutation | c.4635G>T | p.Gln1545His | p.Q1545H | Q9UMN6 | protein_coding | deleterious(0.01) | possibly_damaging(0.894) | TCGA-G4-6314-01 | Colorectum | colon adenocarcinoma | Female | >=65 | III/IV | Ancillary | leucovorin | SD | |
| KMT2B | SNV | Missense_Mutation | c.7973N>G | p.Asn2658Ser | p.N2658S | Q9UMN6 | protein_coding | deleterious(0) | probably_damaging(0.993) | TCGA-G4-6320-01 | Colorectum | colon adenocarcinoma | Male | >=65 | III/IV | Chemotherapy | oxaliplatin | SD | |
| KMT2B | SNV | Missense_Mutation | c.3904C>T | p.Arg1302Cys | p.R1302C | Q9UMN6 | protein_coding | deleterious(0) | probably_damaging(0.997) | TCGA-G4-6588-01 | Colorectum | colon adenocarcinoma | Female | <65 | I/II | Unknown | Unknown | SD | |
| KMT2B | SNV | Missense_Mutation | c.6743N>C | p.Val2248Ala | p.V2248A | Q9UMN6 | protein_coding | deleterious(0.04) | benign(0.081) | TCGA-NH-A5IV-01 | Colorectum | colon adenocarcinoma | Female | >=65 | I/II | Unknown | Unknown | SD |
| Page: 1 2 3 4 5 6 7 8 9 10 11 12 13 14 15 16 17 18 19 20 21 22 23 24 25 26 27 28 29 30 31 32 33 34 |
Top |
Related drugs of malignant transformation related genes |
| Identification of chemicals and drugs interact with genes involved in malignant transfromation |
| (DGIdb 4.0) |
| Entrez ID | Symbol | Category | Interaction Types | Drug Claim Name | Drug Name | PMIDs |
| Page: 1 |

Copyright 2023-Present -The University of Texas Health Science Center at Houston |