
|
|||||
|
 | |
| |
| |
| |
| |
| |
|
Gene: ITFG1 |
Gene summary for ITFG1 |
| Gene information | Species | Human | Gene symbol | ITFG1 | Gene ID | 81533 |
| Gene name | integrin alpha FG-GAP repeat containing 1 | |
| Gene Alias | 2310047C21Rik | |
| Cytomap | 16q12.1 | |
| Gene Type | protein-coding | GO ID | GO:0005575 | UniProtAcc | B4DXC2 |
Top |
Malignant transformation analysis |
| Identification of the aberrant gene expression in precancerous and cancerous lesions by comparing the gene expression of stem-like cells in diseased tissues with normal stem cells |
| Entrez ID | Symbol | Replicates | Species | Organ | Tissue | Adj P-value | Log2FC | Malignancy |
| 81533 | ITFG1 | CCI_1 | Human | Cervix | CC | 2.44e-08 | 1.10e+00 | 0.528 |
| 81533 | ITFG1 | CCI_2 | Human | Cervix | CC | 8.26e-05 | 8.57e-01 | 0.5249 |
| 81533 | ITFG1 | CCI_3 | Human | Cervix | CC | 1.28e-07 | 1.03e+00 | 0.516 |
| 81533 | ITFG1 | HTA11_3410_2000001011 | Human | Colorectum | AD | 2.66e-26 | -7.28e-01 | 0.0155 |
| 81533 | ITFG1 | HTA11_2487_2000001011 | Human | Colorectum | SER | 5.45e-04 | -4.29e-01 | -0.1808 |
| 81533 | ITFG1 | HTA11_2951_2000001011 | Human | Colorectum | AD | 1.94e-02 | -6.25e-01 | 0.0216 |
| 81533 | ITFG1 | HTA11_3361_2000001011 | Human | Colorectum | AD | 1.28e-13 | -6.11e-01 | -0.1207 |
| 81533 | ITFG1 | HTA11_696_2000001011 | Human | Colorectum | AD | 1.80e-07 | -2.83e-01 | -0.1464 |
| 81533 | ITFG1 | HTA11_5212_2000001011 | Human | Colorectum | AD | 1.20e-02 | -4.71e-01 | -0.2061 |
| 81533 | ITFG1 | HTA11_9341_2000001011 | Human | Colorectum | SER | 1.06e-04 | -8.08e-01 | -0.00410000000000005 |
| 81533 | ITFG1 | HTA11_7862_2000001011 | Human | Colorectum | AD | 4.30e-05 | -4.19e-01 | -0.0179 |
| 81533 | ITFG1 | HTA11_866_3004761011 | Human | Colorectum | AD | 3.11e-21 | -6.12e-01 | 0.096 |
| 81533 | ITFG1 | HTA11_8622_2000001021 | Human | Colorectum | SER | 1.57e-05 | -7.74e-01 | 0.0528 |
| 81533 | ITFG1 | HTA11_10711_2000001011 | Human | Colorectum | AD | 1.07e-07 | -5.44e-01 | 0.0338 |
| 81533 | ITFG1 | HTA11_7696_3000711011 | Human | Colorectum | AD | 1.13e-08 | -4.67e-01 | 0.0674 |
| 81533 | ITFG1 | HTA11_6818_2000001011 | Human | Colorectum | AD | 4.33e-02 | -4.24e-01 | 0.0112 |
| 81533 | ITFG1 | HTA11_6818_2000001021 | Human | Colorectum | AD | 9.18e-04 | -5.09e-01 | 0.0588 |
| 81533 | ITFG1 | HTA11_99999970781_79442 | Human | Colorectum | MSS | 4.62e-16 | -5.06e-01 | 0.294 |
| 81533 | ITFG1 | HTA11_99999971662_82457 | Human | Colorectum | MSS | 1.20e-03 | -3.39e-01 | 0.3859 |
| 81533 | ITFG1 | HTA11_99999973899_84307 | Human | Colorectum | MSS | 7.29e-06 | -5.33e-01 | 0.2585 |
| Page: 1 2 3 4 5 6 7 8 9 10 11 |
| Tissue | Expression Dynamics | Abbreviation |
| Cervix |  | CC: Cervix cancer |
| HSIL_HPV: HPV-infected high-grade squamous intraepithelial lesions | ||
| N_HPV: HPV-infected normal cervix | ||
| Colorectum (GSE201348) |  | FAP: Familial adenomatous polyposis |
| CRC: Colorectal cancer | ||
| Colorectum (HTA11) |  | AD: Adenomas |
| SER: Sessile serrated lesions | ||
| MSI-H: Microsatellite-high colorectal cancer | ||
| MSS: Microsatellite stable colorectal cancer | ||
| Endometrium |  | AEH: Atypical endometrial hyperplasia |
| EEC: Endometrioid Cancer | ||
| Esophagus | 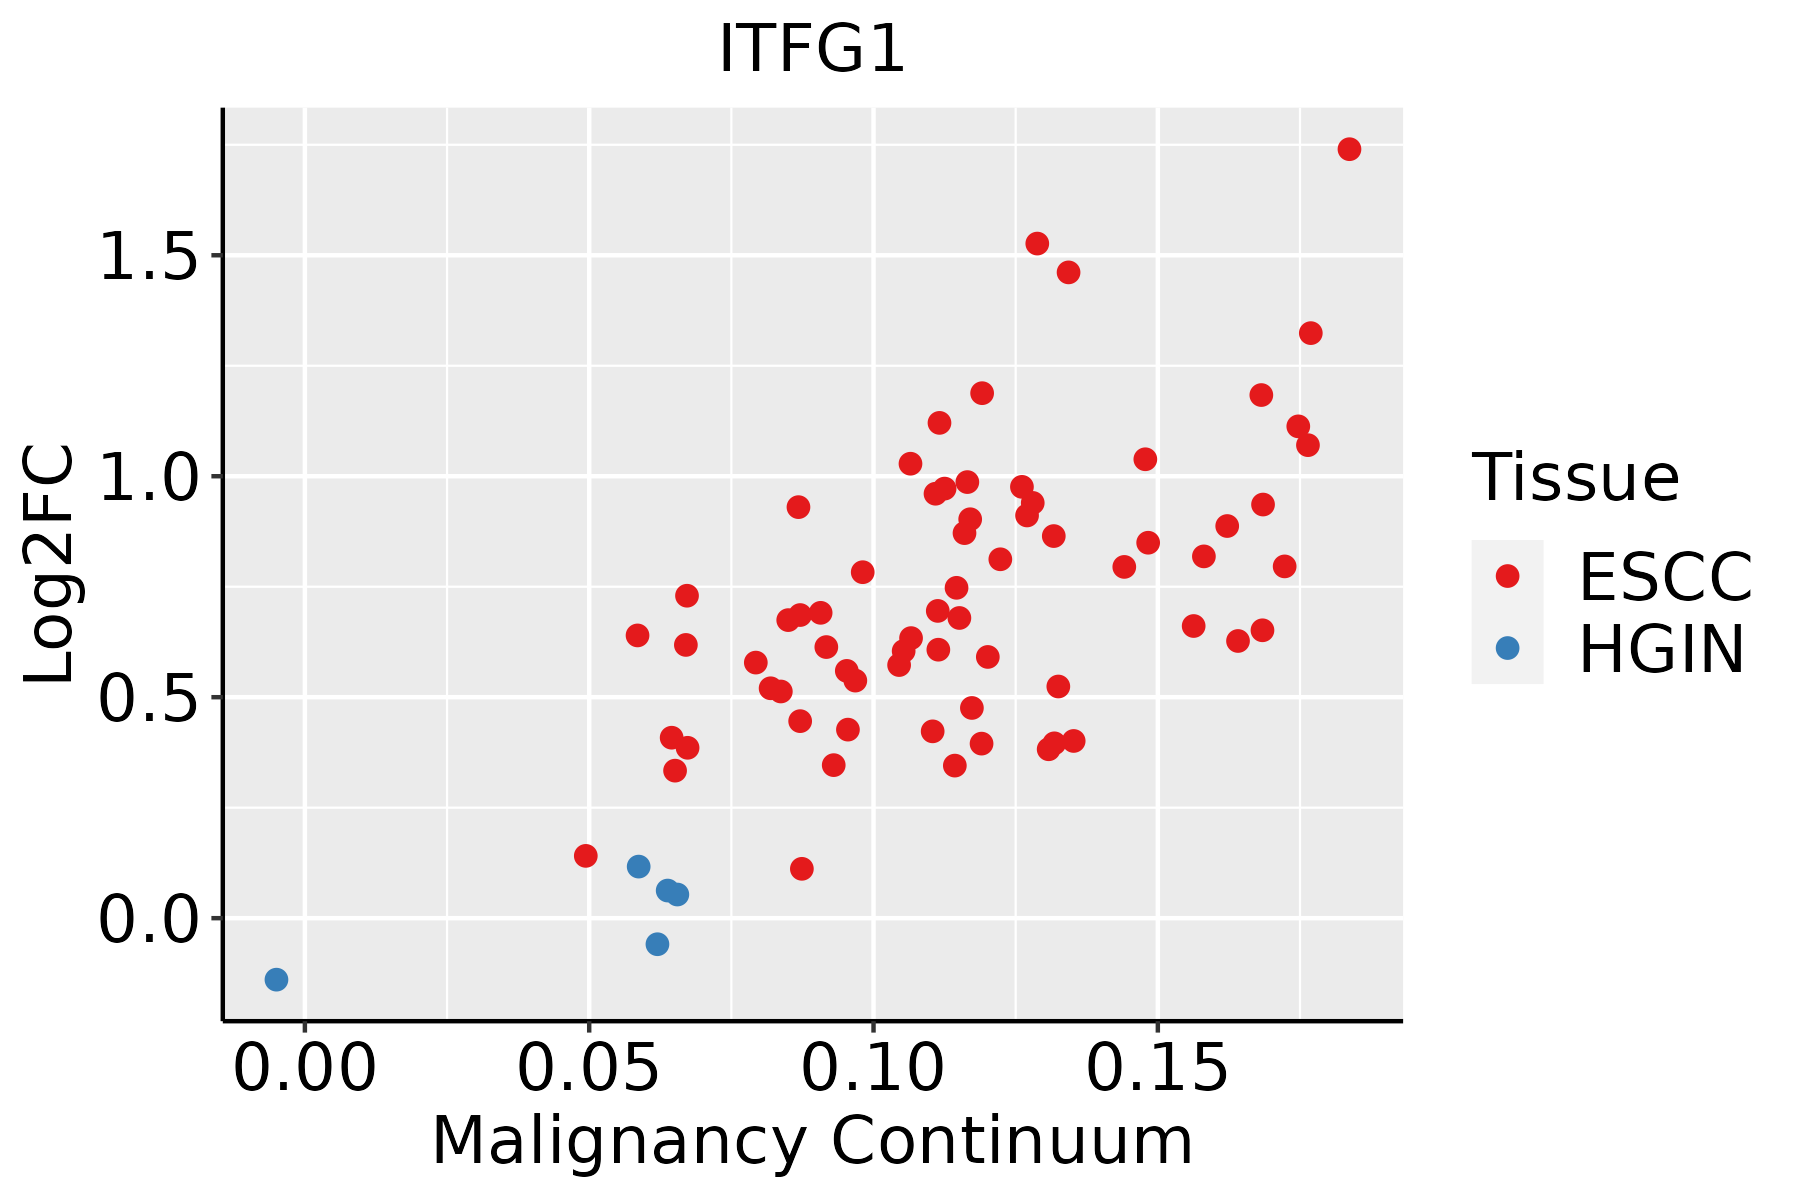 | ESCC: Esophageal squamous cell carcinoma |
| HGIN: High-grade intraepithelial neoplasias | ||
| LGIN: Low-grade intraepithelial neoplasias | ||
| Liver |  | HCC: Hepatocellular carcinoma |
| NAFLD: Non-alcoholic fatty liver disease | ||
| Lung | 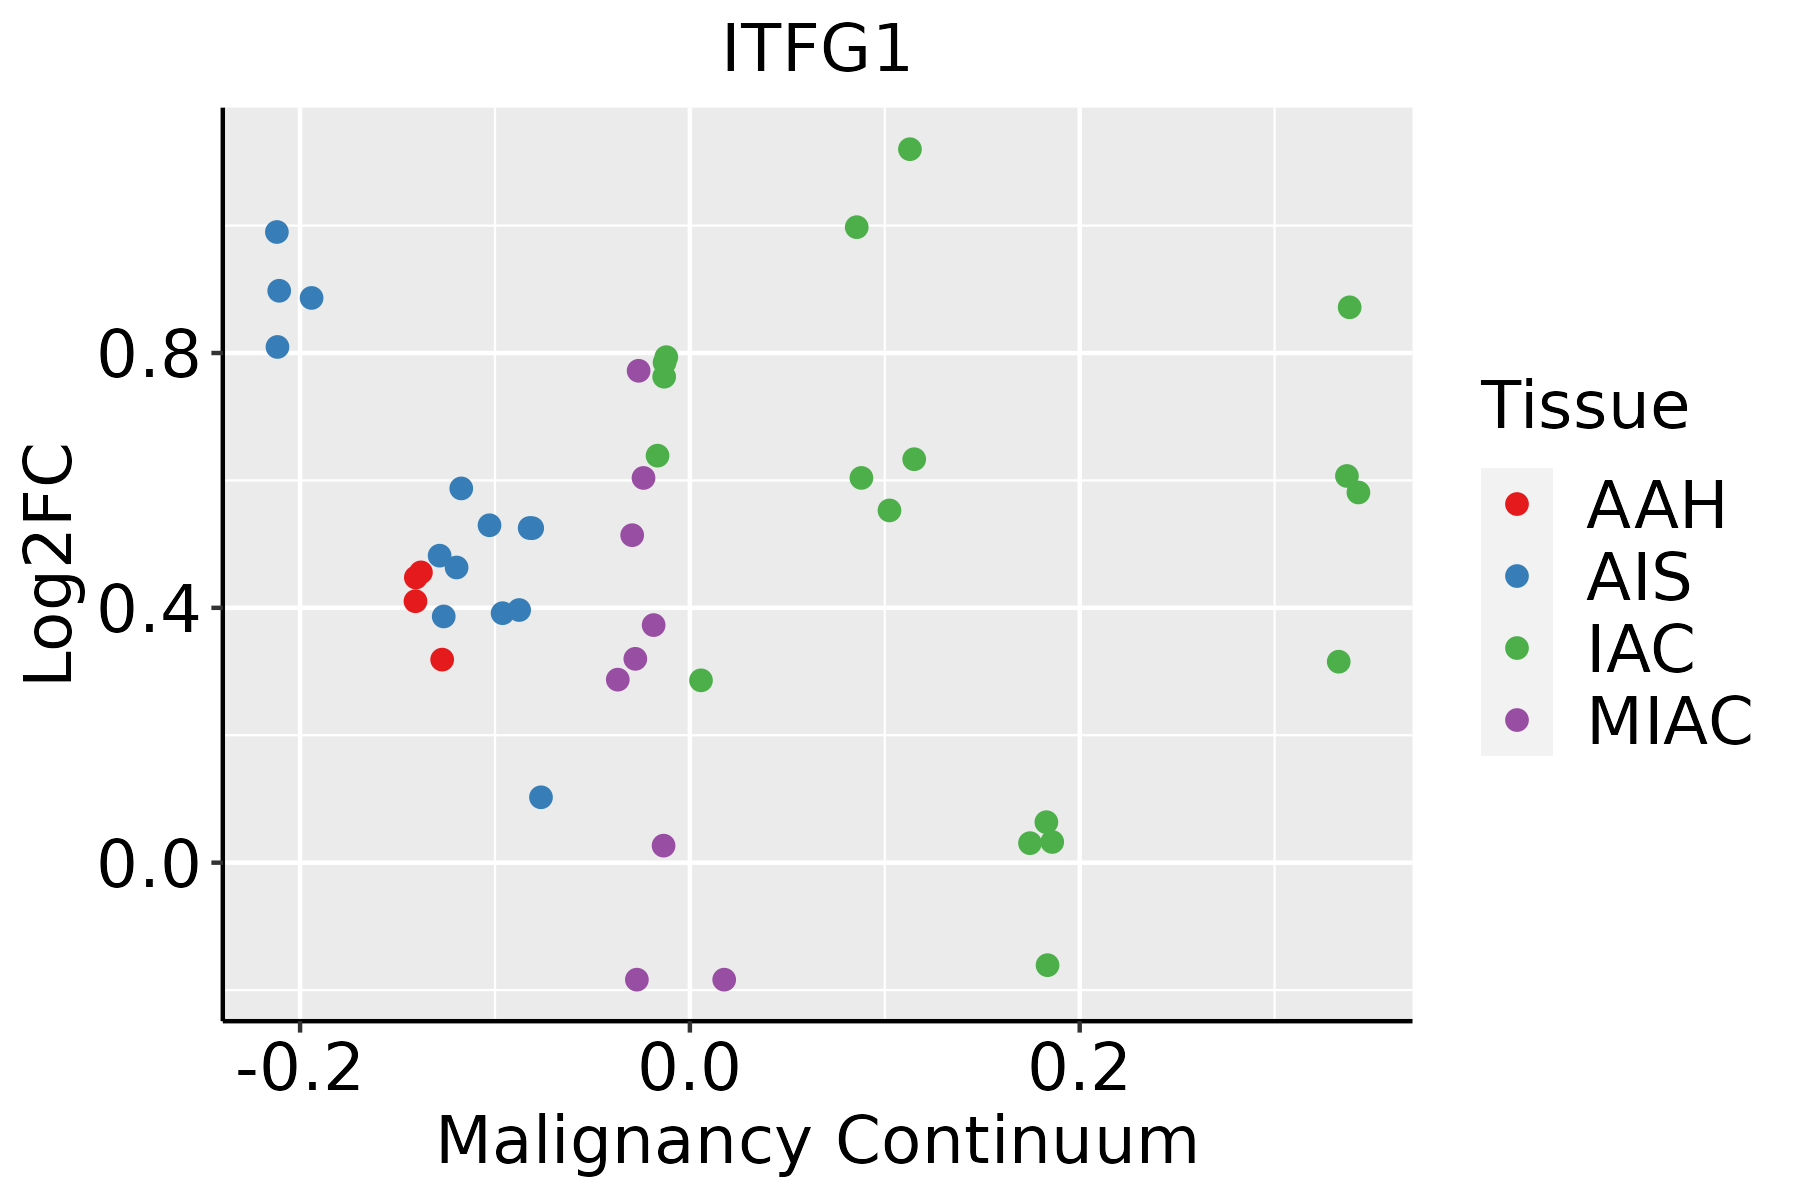 | AAH: Atypical adenomatous hyperplasia |
| AIS: Adenocarcinoma in situ | ||
| IAC: Invasive lung adenocarcinoma | ||
| MIA: Minimally invasive adenocarcinoma | ||
| Oral Cavity | 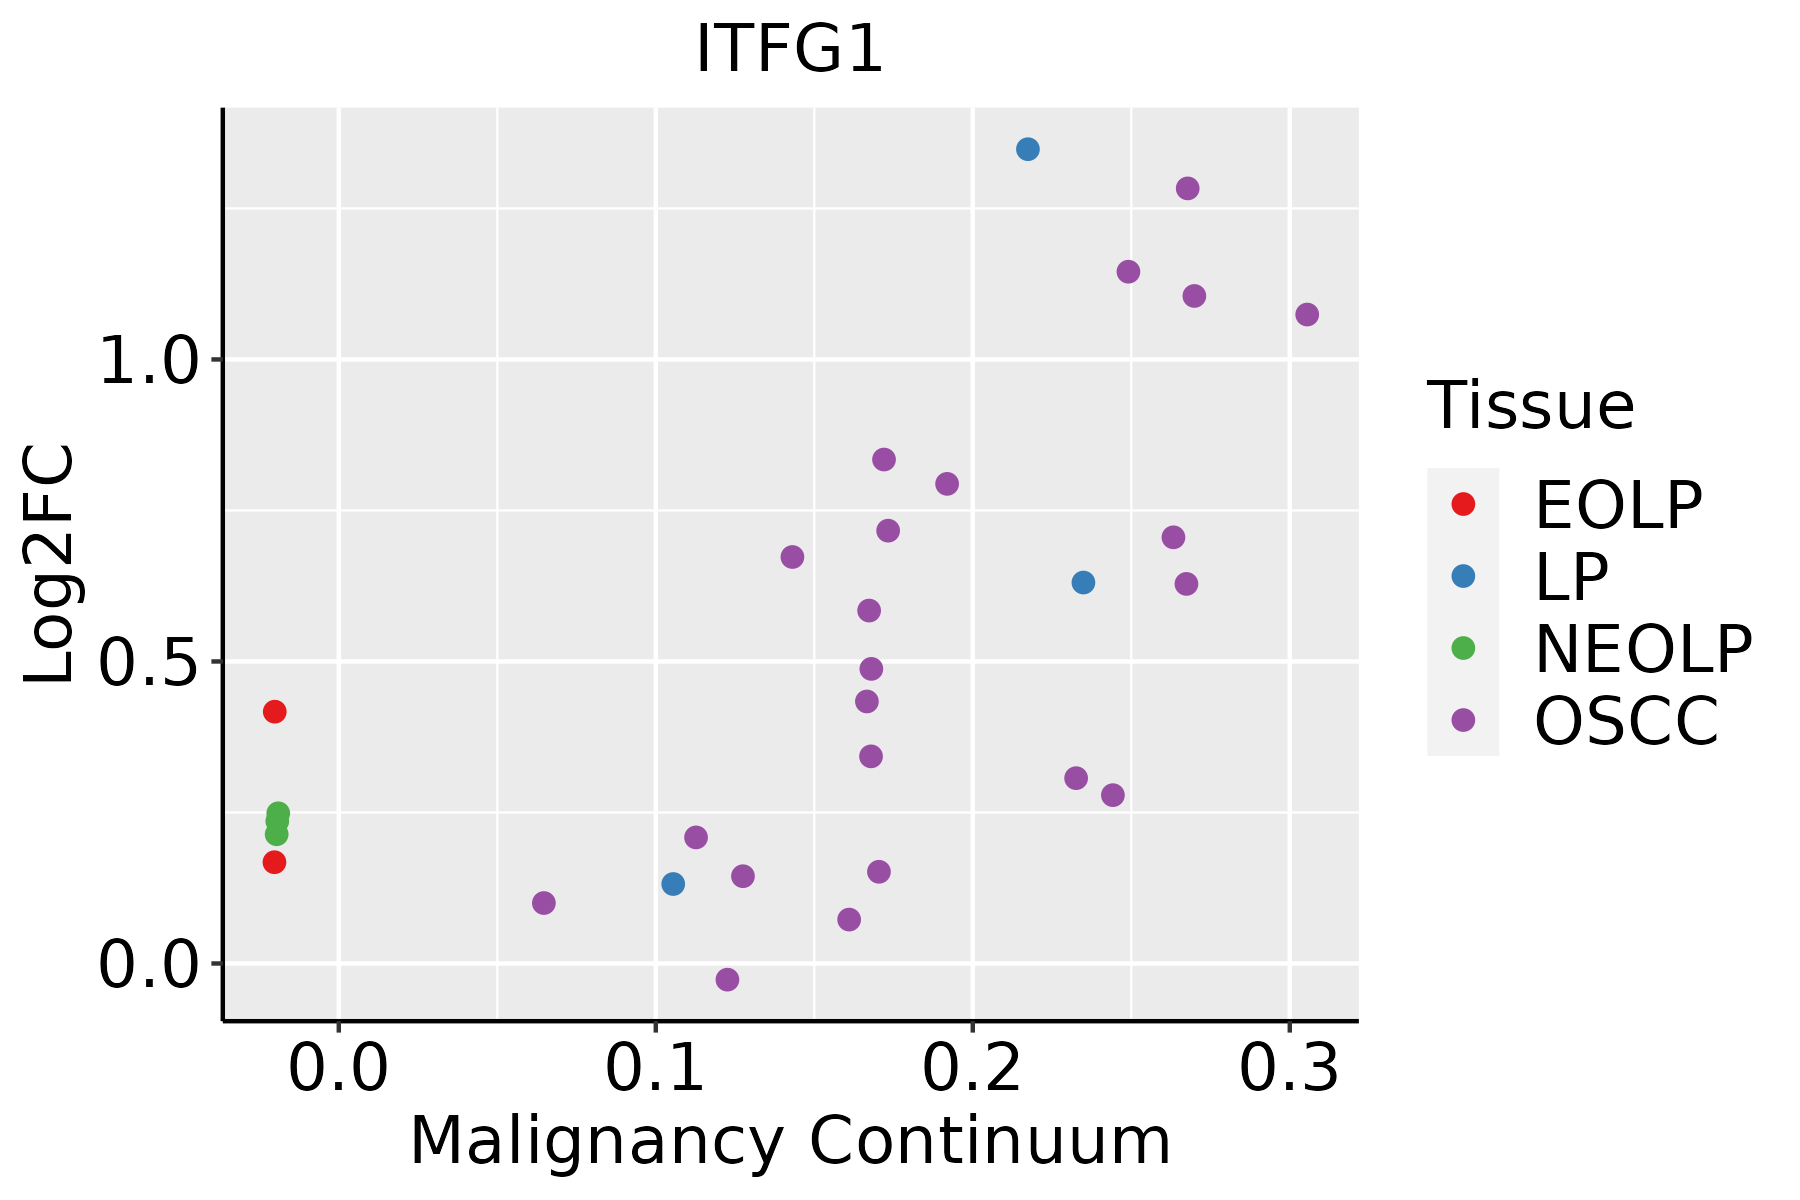 | EOLP: Erosive Oral lichen planus |
| LP: leukoplakia | ||
| NEOLP: Non-erosive oral lichen planus | ||
| OSCC: Oral squamous cell carcinoma | ||
| Skin | 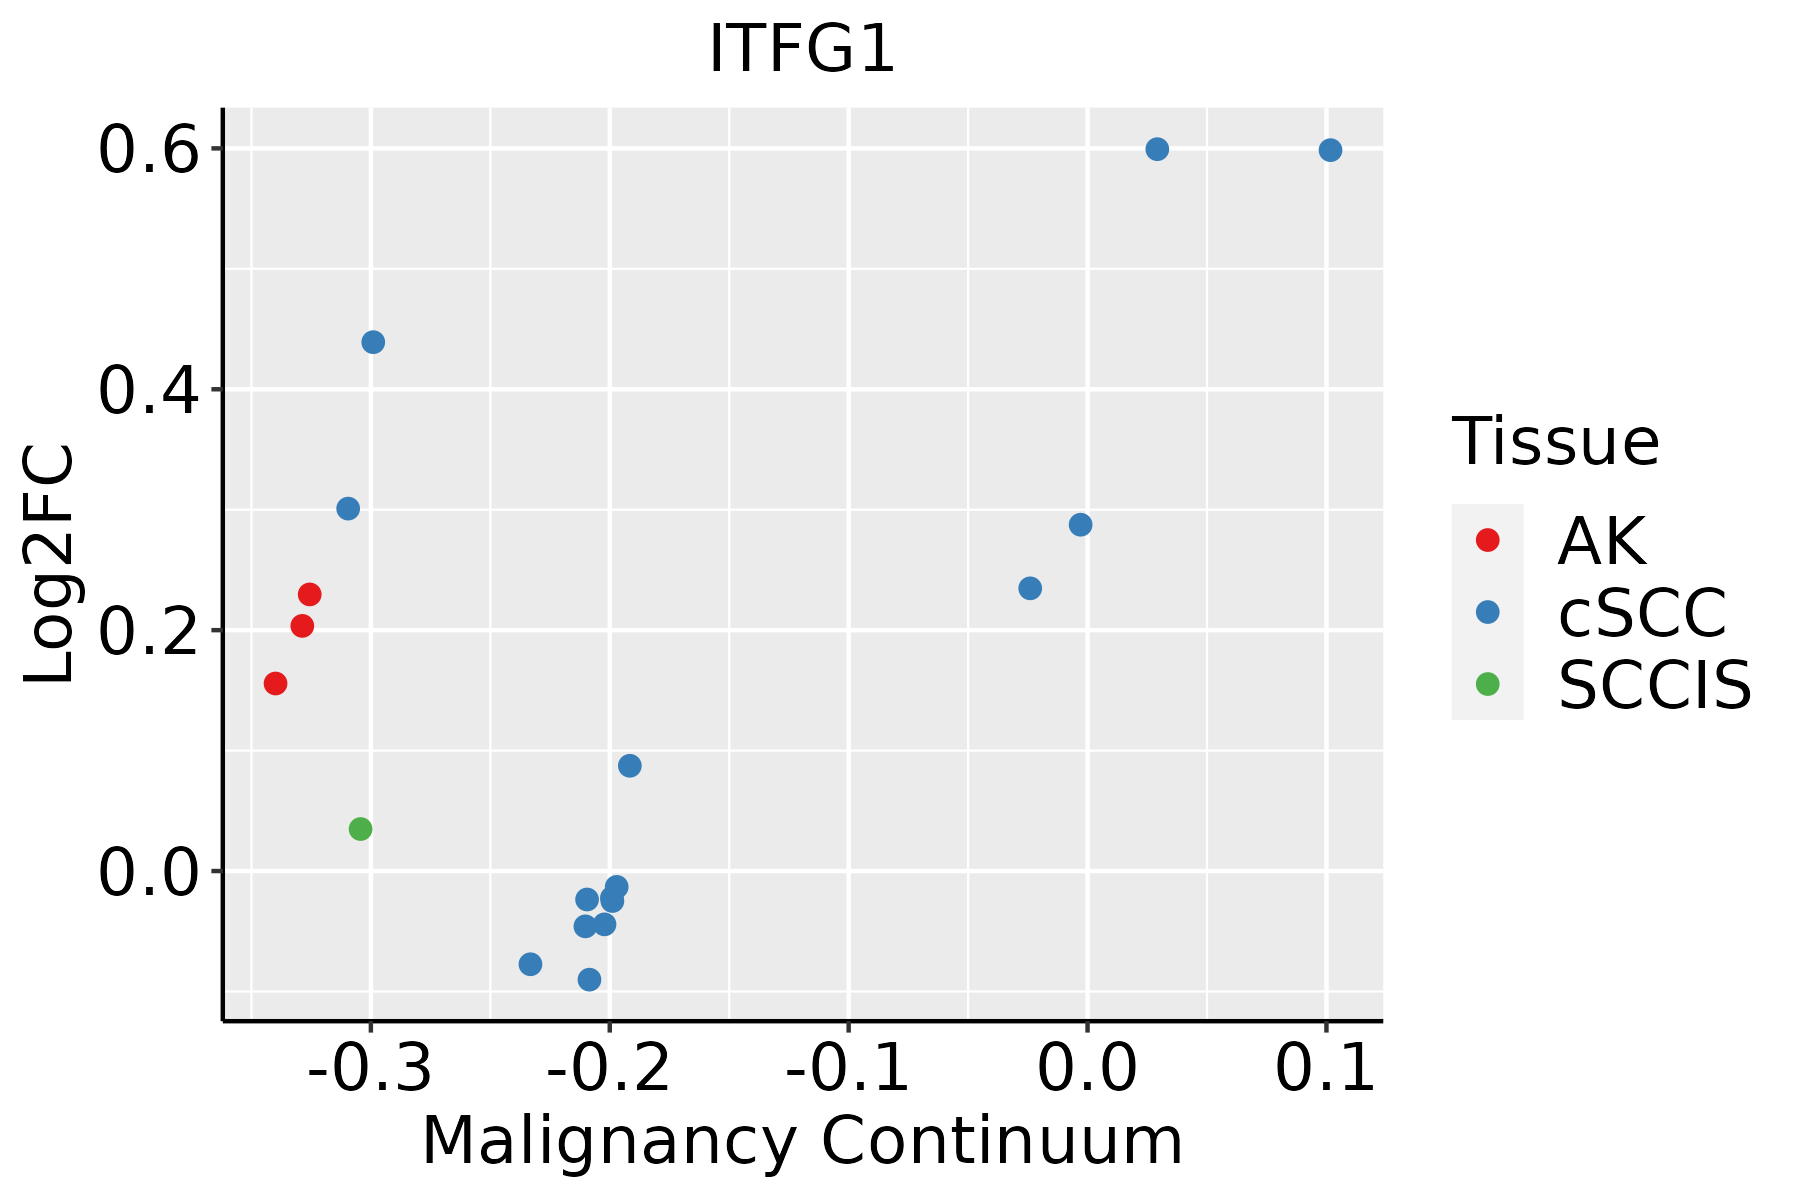 | AK: Actinic keratosis |
| cSCC: Cutaneous squamous cell carcinoma | ||
| SCCIS:squamous cell carcinoma in situ | ||
| Thyroid |  | ATC: Anaplastic thyroid cancer |
| HT: Hashimoto's thyroiditis | ||
| PTC: Papillary thyroid cancer |
| ∗log2FC in expression of this searched gene in stem-like cells from each diseased tissue sample relative to stem-like cells in normal samples in each tissue plotted against the malignancy continuum. Samples are colored based on if they are from different disease stage. |
Top |
Malignant transformation related pathway analysis |
| Find out the enriched GO biological processes and KEGG pathways involved in transition from healthy to precancer to cancer |
| Tissue | Disease Stage | Enriched GO biological Processes |
| Colorectum | AD |  |
| Colorectum | SER |  |
| Colorectum | MSS |  |
| Colorectum | MSI-H |  |
| Colorectum | FAP |  |
| ∗Top 15 enriched GO BP terms are showed in the bar plot of each disease state in each tissue. Each row represents a significant GO biological process which is colored according to the -log10(p.adjust). |
| Page: 1 2 3 4 5 6 7 8 9 |
| GO ID | Tissue | Disease Stage | Description | Gene Ratio | Bg Ratio | pvalue | p.adjust | Count |
| Page: 1 |
| Pathway ID | Tissue | Disease Stage | Description | Gene Ratio | Bg Ratio | pvalue | p.adjust | qvalue | Count |
| Page: 1 |
Top |
Cell-cell communication analysis |
| Identification of potential cell-cell interactions between two cell types and their ligand-receptor pairs for different disease states |
| Ligand | Receptor | LRpair | Pathway | Tissue | Disease Stage |
| Page: 1 |
Top |
Single-cell gene regulatory network inference analysis |
| Find out the significant the regulons (TFs) and the target genes of each regulon across cell types for different disease states |
| TF | Cell Type | Tissue | Disease Stage | Target Gene | RSS | Regulon Activity |
| ∗The dot plots of a searched regulon are shown for all cell subpopulations in each disease state of each tissue based on the regulon specific score inferred using pySCENIC and by calculating the average expression. |
| Page: 1 |
Top |
Somatic mutation of malignant transformation related genes |
| Annotation of somatic variants for genes involved in malignant transformation |
| Hugo Symbol | Variant Class | Variant Classification | dbSNP RS | HGVSc | HGVSp | HGVSp Short | SWISSPROT | BIOTYPE | SIFT | PolyPhen | Tumor Sample Barcode | Tissue | Histology | Sex | Age | Stage | Therapy Types | Drugs | Outcome |
| ITFG1 | SNV | Missense_Mutation | rs779539770 | c.812N>A | p.Gly271Glu | p.G271E | Q8TB96 | protein_coding | deleterious(0.01) | probably_damaging(0.923) | TCGA-VQ-A8P2-01 | Stomach | stomach adenocarcinoma | Male | >=65 | III/IV | Unspecific | Complete Response | |
| ITFG1 | SNV | Missense_Mutation | novel | c.1810N>A | p.Ala604Thr | p.A604T | Q8TB96 | protein_coding | deleterious(0) | probably_damaging(0.998) | TCGA-VQ-A924-01 | Stomach | stomach adenocarcinoma | Male | >=65 | I/II | Unknown | Unknown | PD |
| Page: 1 2 3 4 5 6 7 |
Top |
Related drugs of malignant transformation related genes |
| Identification of chemicals and drugs interact with genes involved in malignant transfromation |
| (DGIdb 4.0) |
| Entrez ID | Symbol | Category | Interaction Types | Drug Claim Name | Drug Name | PMIDs |
| Page: 1 |

Copyright 2023-Present -The University of Texas Health Science Center at Houston |