
|
|||||
|
 | |
| |
| |
| |
| |
| |
|
Gene: ARSE |
Gene summary for ARSE |
| Gene information | Species | Human | Gene symbol | ARSE | Gene ID | 415 |
| Gene name | arylsulfatase L | |
| Gene Alias | ARSE | |
| Cytomap | Xp22.33 | |
| Gene Type | protein-coding | GO ID | GO:0001501 | UniProtAcc | P51690 |
Top |
Malignant transformation analysis |
| Identification of the aberrant gene expression in precancerous and cancerous lesions by comparing the gene expression of stem-like cells in diseased tissues with normal stem cells |
| Entrez ID | Symbol | Replicates | Species | Organ | Tissue | Adj P-value | Log2FC | Malignancy |
| 415 | ARSE | HTA11_3410_2000001011 | Human | Colorectum | AD | 3.26e-04 | -2.00e-01 | 0.0155 |
| 415 | ARSE | HTA11_78_2000001011 | Human | Colorectum | AD | 4.20e-02 | -2.00e-01 | -0.1088 |
| 415 | ARSE | HTA11_347_2000001011 | Human | Colorectum | AD | 9.99e-05 | -2.00e-01 | -0.1954 |
| 415 | ARSE | HTA11_696_2000001011 | Human | Colorectum | AD | 4.40e-09 | -2.00e-01 | -0.1464 |
| 415 | ARSE | HTA11_866_2000001011 | Human | Colorectum | AD | 9.55e-09 | -2.00e-01 | -0.1001 |
| 415 | ARSE | HTA11_1391_2000001011 | Human | Colorectum | AD | 6.84e-03 | -2.00e-01 | -0.059 |
| 415 | ARSE | HTA11_866_3004761011 | Human | Colorectum | AD | 2.14e-03 | -2.00e-01 | 0.096 |
| 415 | ARSE | HTA11_7696_3000711011 | Human | Colorectum | AD | 9.55e-09 | -2.00e-01 | 0.0674 |
| 415 | ARSE | HTA11_99999965104_69814 | Human | Colorectum | MSS | 4.21e-15 | 7.01e-01 | 0.281 |
| 415 | ARSE | HTA11_99999973899_84307 | Human | Colorectum | MSS | 9.37e-12 | 7.25e-01 | 0.2585 |
| 415 | ARSE | HTA11_99999974143_84620 | Human | Colorectum | MSS | 3.67e-14 | 6.08e-01 | 0.3005 |
| 415 | ARSE | A015-C-104 | Human | Colorectum | FAP | 1.70e-02 | 8.83e-02 | -0.1899 |
| 415 | ARSE | A002-C-116 | Human | Colorectum | FAP | 7.57e-04 | -3.45e-02 | -0.0452 |
| 415 | ARSE | CRC-3-11773 | Human | Colorectum | CRC | 1.08e-04 | -1.49e-01 | 0.2564 |
| 415 | ARSE | S43 | Human | Liver | Cirrhotic | 2.45e-05 | 1.19e-02 | -0.0187 |
| 415 | ARSE | HCC1_Meng | Human | Liver | HCC | 1.47e-77 | 1.78e-01 | 0.0246 |
| 415 | ARSE | HCC2_Meng | Human | Liver | HCC | 2.08e-19 | -1.32e-02 | 0.0107 |
| 415 | ARSE | cirrhotic1 | Human | Liver | Cirrhotic | 9.98e-12 | 3.13e-01 | 0.0202 |
| 415 | ARSE | cirrhotic2 | Human | Liver | Cirrhotic | 4.27e-08 | 1.82e-01 | 0.0201 |
| 415 | ARSE | HCC1 | Human | Liver | HCC | 6.73e-03 | 3.92e+00 | 0.5336 |
| Page: 1 2 |
| Tissue | Expression Dynamics | Abbreviation |
| Colorectum (GSE201348) | 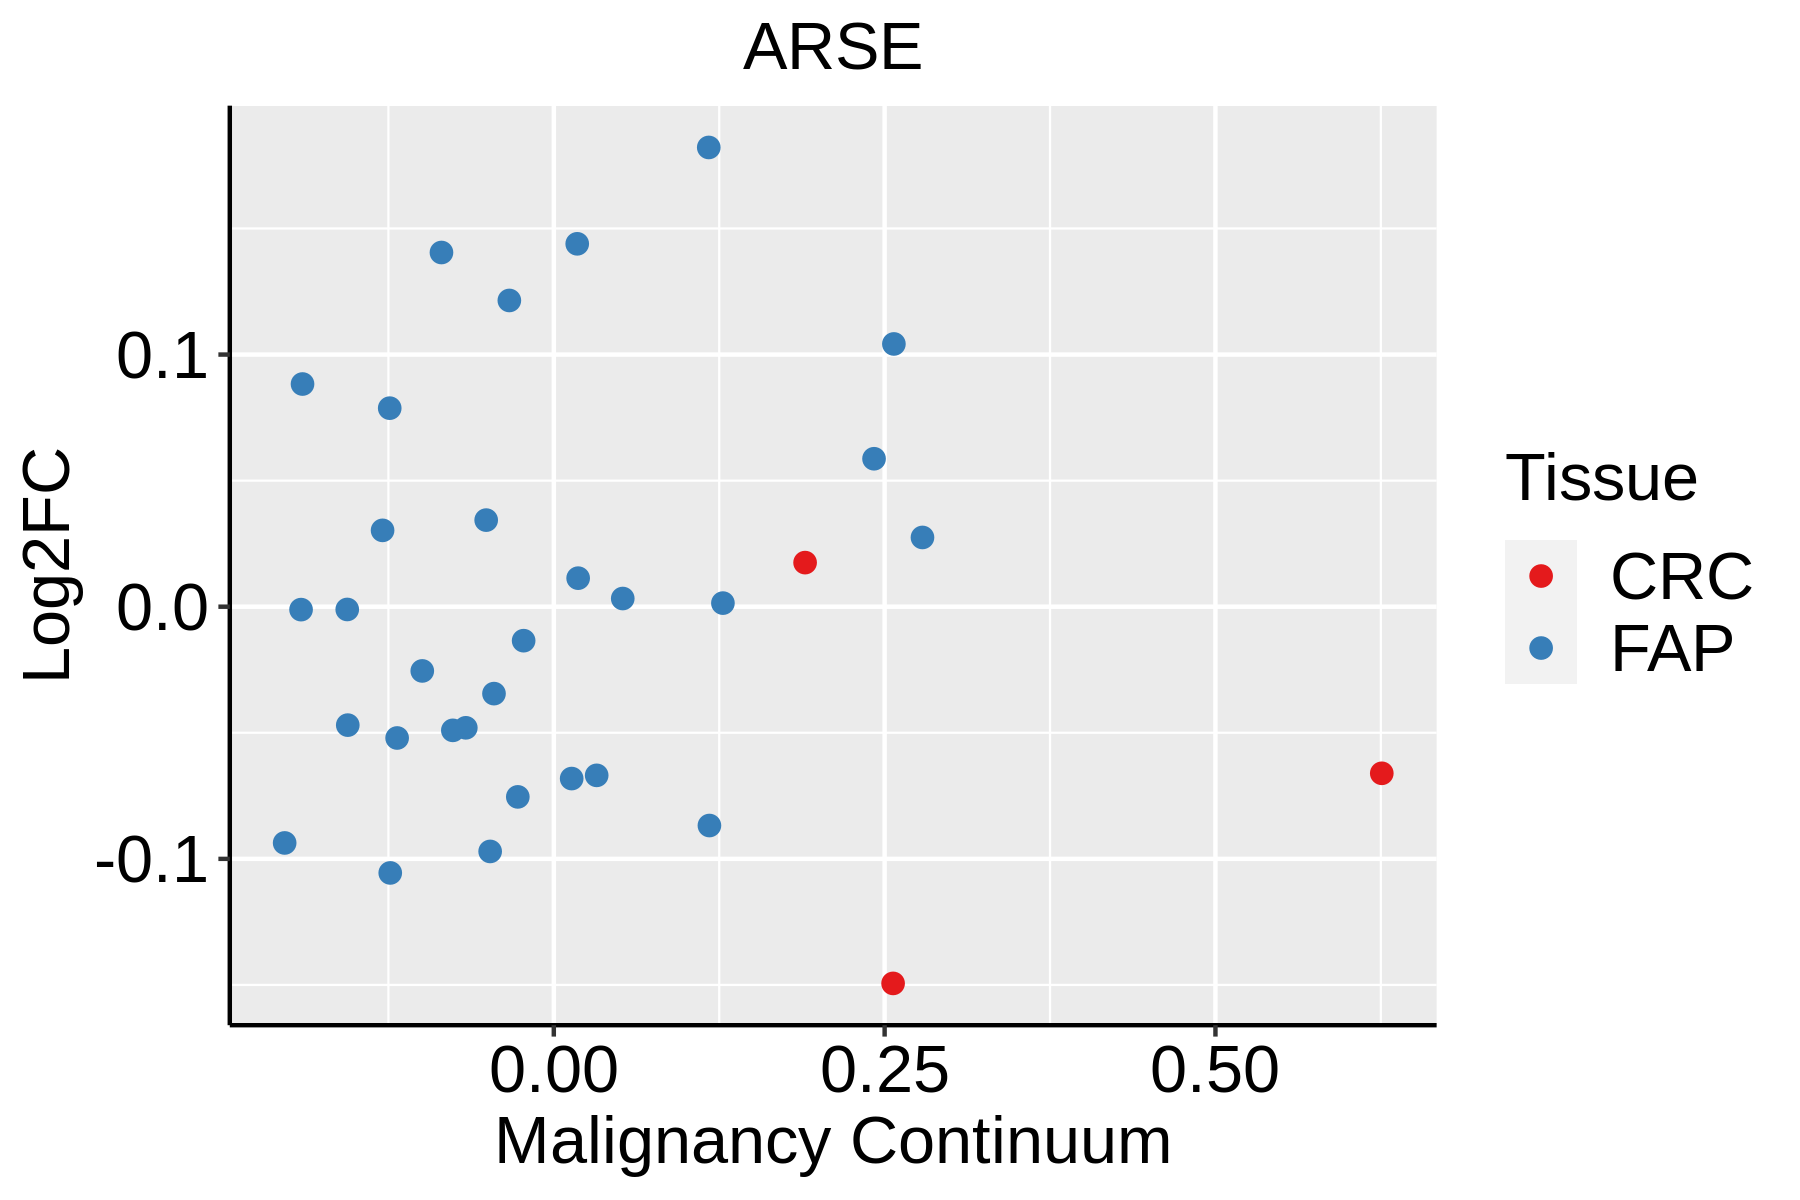 | FAP: Familial adenomatous polyposis |
| CRC: Colorectal cancer | ||
| Colorectum (HTA11) | 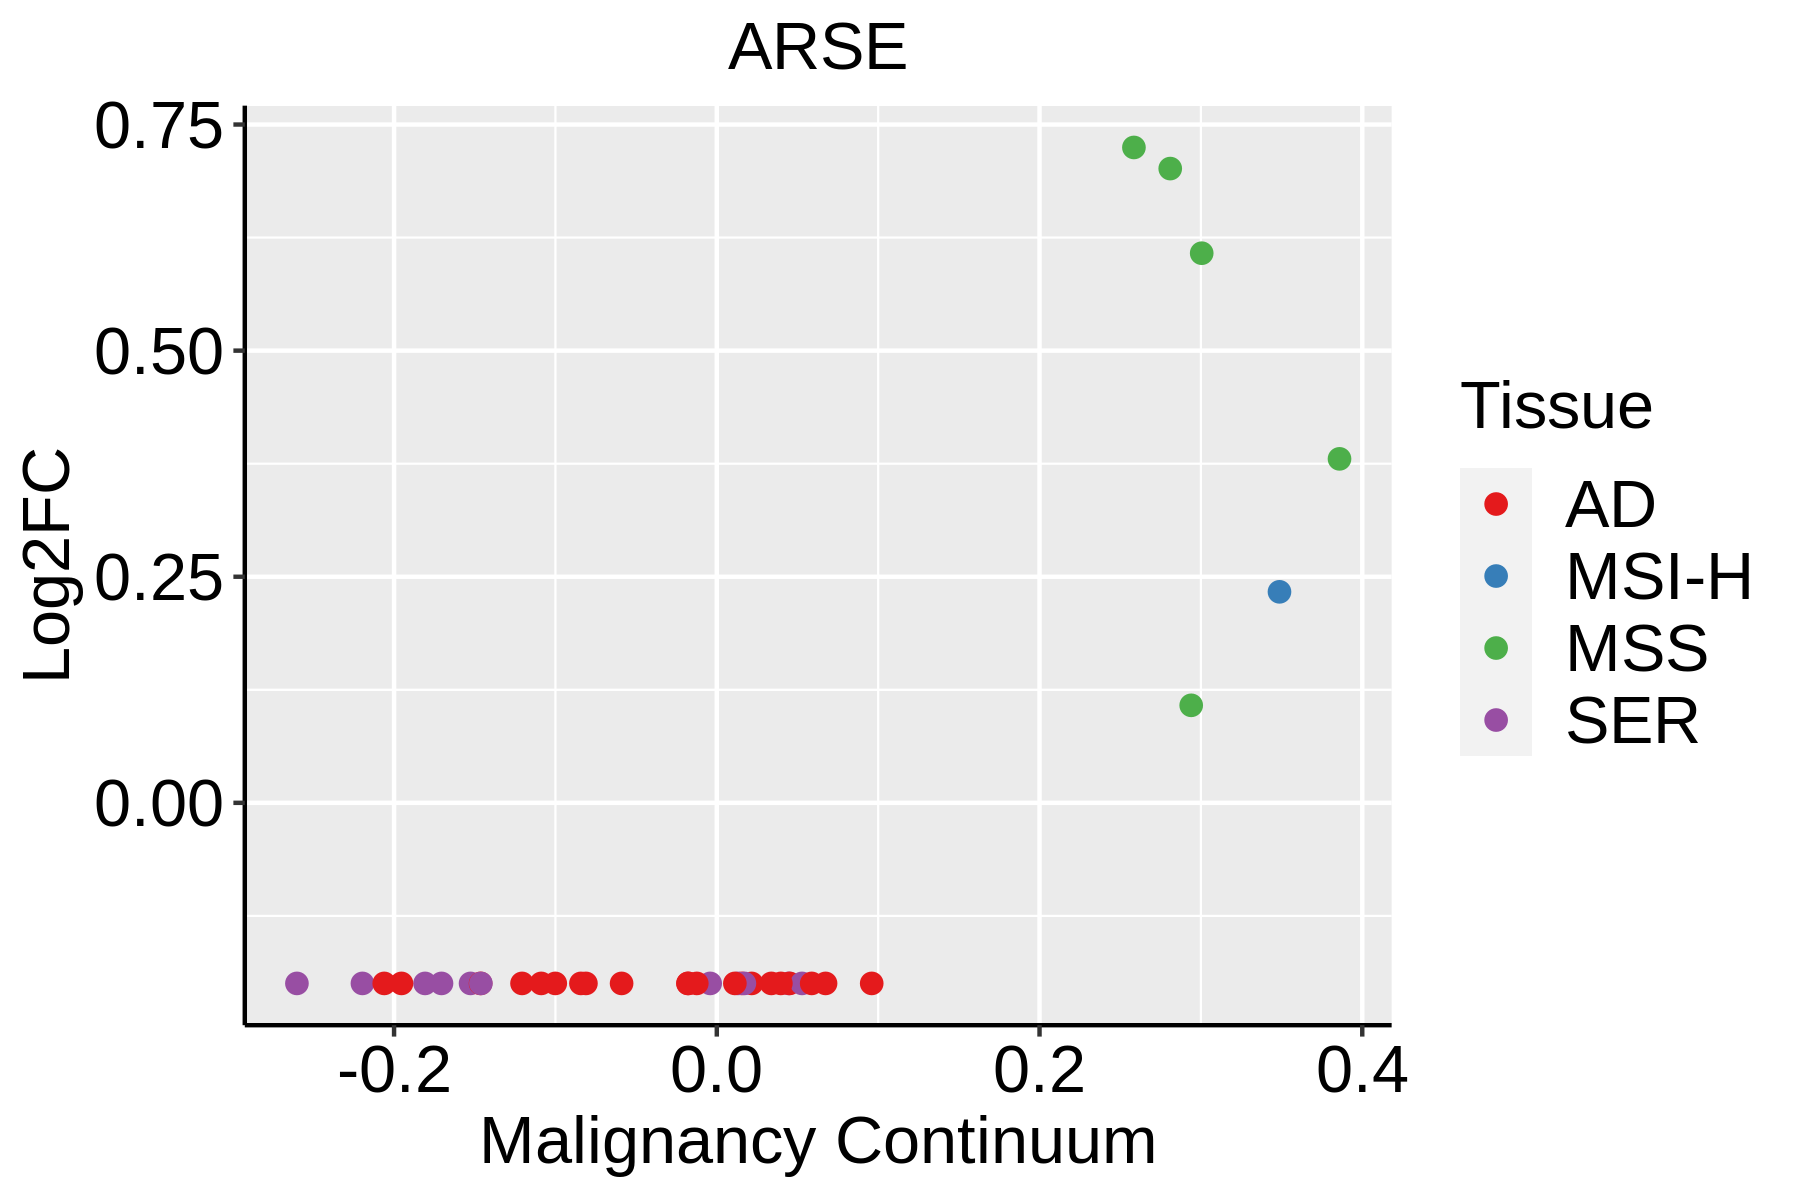 | AD: Adenomas |
| SER: Sessile serrated lesions | ||
| MSI-H: Microsatellite-high colorectal cancer | ||
| MSS: Microsatellite stable colorectal cancer | ||
| Liver | 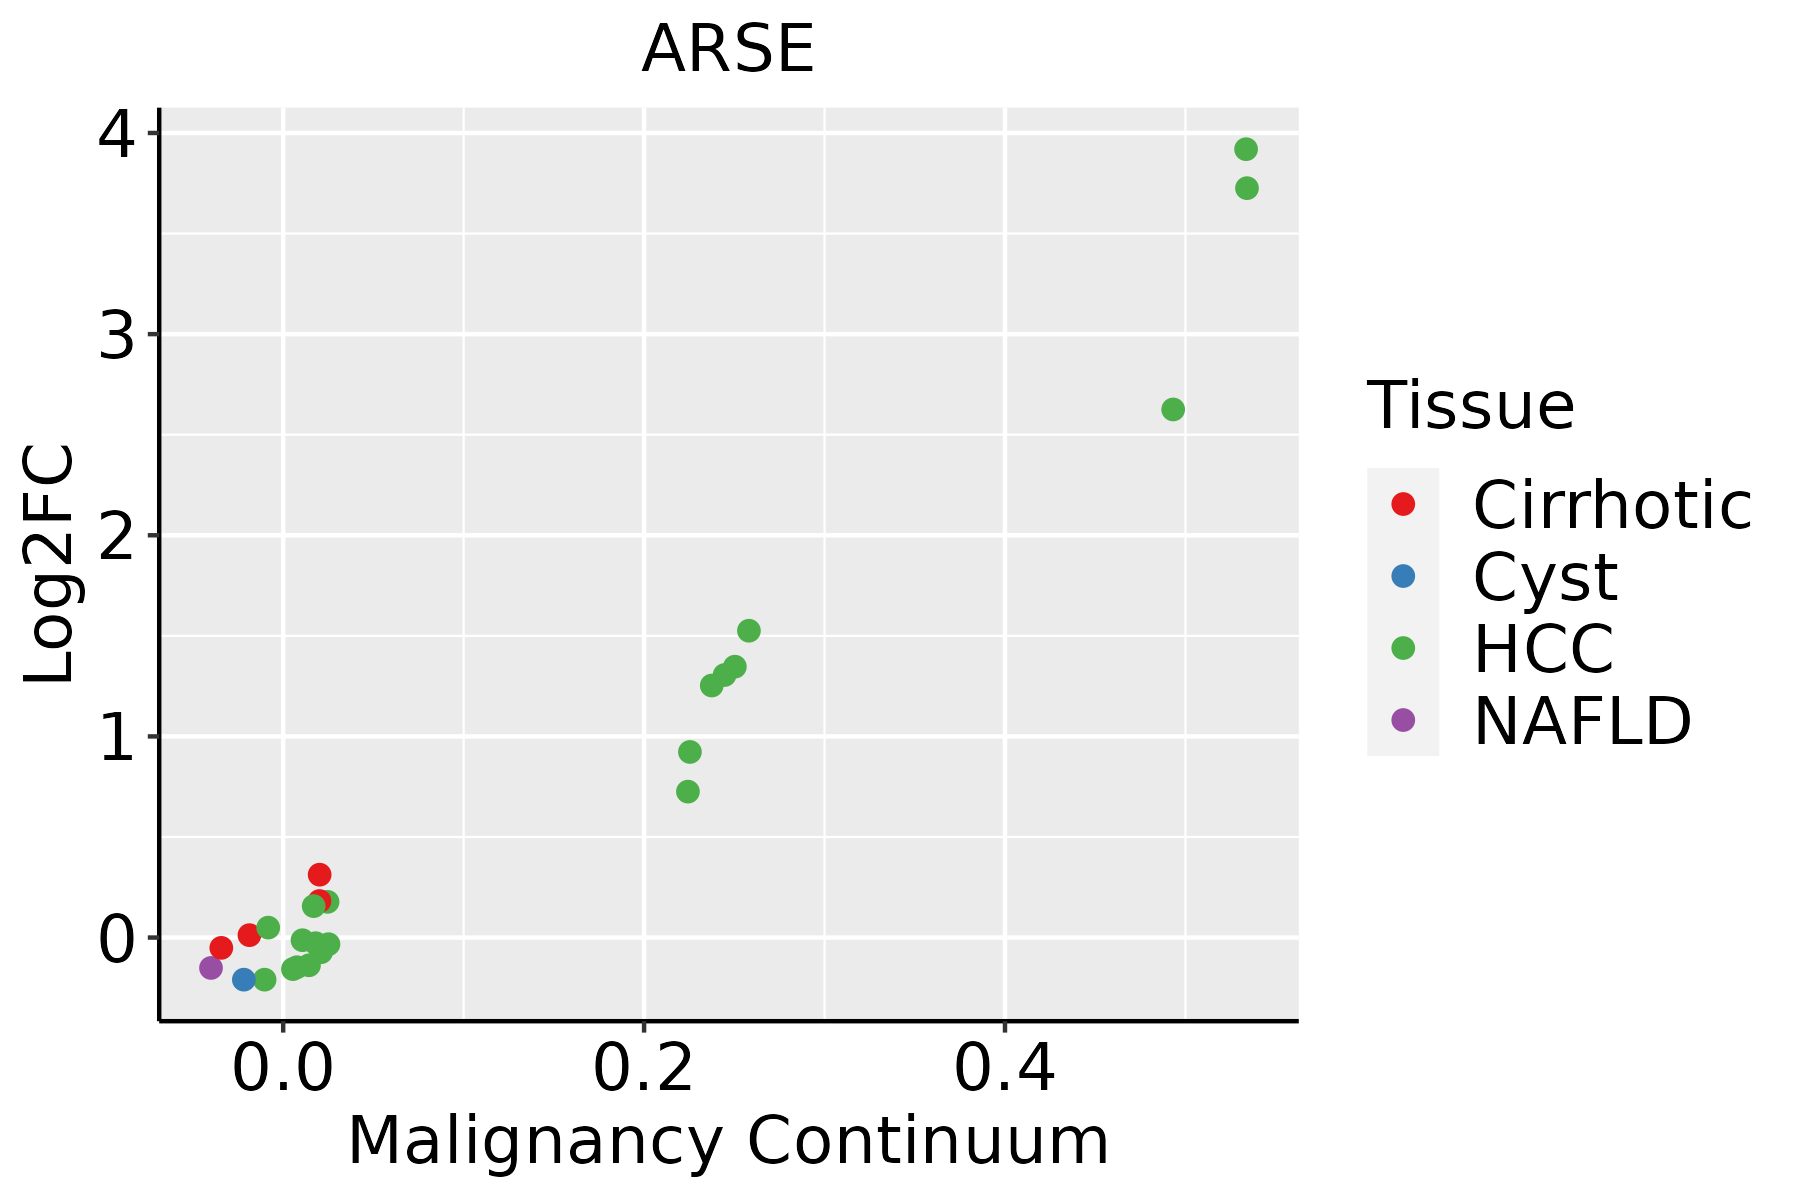 | HCC: Hepatocellular carcinoma |
| NAFLD: Non-alcoholic fatty liver disease |
| ∗log2FC in expression of this searched gene in stem-like cells from each diseased tissue sample relative to stem-like cells in normal samples in each tissue plotted against the malignancy continuum. Samples are colored based on if they are from different disease stage. |
Top |
Malignant transformation related pathway analysis |
| Find out the enriched GO biological processes and KEGG pathways involved in transition from healthy to precancer to cancer |
| Tissue | Disease Stage | Enriched GO biological Processes |
| Colorectum | AD |  |
| Colorectum | SER |  |
| Colorectum | MSS |  |
| Colorectum | MSI-H |  |
| Colorectum | FAP |  |
| ∗Top 15 enriched GO BP terms are showed in the bar plot of each disease state in each tissue. Each row represents a significant GO biological process which is colored according to the -log10(p.adjust). |
| Page: 1 2 3 4 5 6 7 8 9 |
| GO ID | Tissue | Disease Stage | Description | Gene Ratio | Bg Ratio | pvalue | p.adjust | Count |
| Page: 1 |
| Pathway ID | Tissue | Disease Stage | Description | Gene Ratio | Bg Ratio | pvalue | p.adjust | qvalue | Count |
| Page: 1 |
Top |
Cell-cell communication analysis |
| Identification of potential cell-cell interactions between two cell types and their ligand-receptor pairs for different disease states |
| Ligand | Receptor | LRpair | Pathway | Tissue | Disease Stage |
| Page: 1 |
Top |
Single-cell gene regulatory network inference analysis |
| Find out the significant the regulons (TFs) and the target genes of each regulon across cell types for different disease states |
| TF | Cell Type | Tissue | Disease Stage | Target Gene | RSS | Regulon Activity |
| ∗The dot plots of a searched regulon are shown for all cell subpopulations in each disease state of each tissue based on the regulon specific score inferred using pySCENIC and by calculating the average expression. |
| Page: 1 |
Top |
Somatic mutation of malignant transformation related genes |
| Annotation of somatic variants for genes involved in malignant transformation |
| Hugo Symbol | Variant Class | Variant Classification | dbSNP RS | HGVSc | HGVSp | HGVSp Short | SWISSPROT | BIOTYPE | SIFT | PolyPhen | Tumor Sample Barcode | Tissue | Histology | Sex | Age | Stage | Therapy Types | Drugs | Outcome |
| ARSE | SNV | Missense_Mutation | novel | c.1246N>T | p.Gly416Trp | p.G416W | protein_coding | deleterious(0) | probably_damaging(1) | TCGA-E8-A2EA-01 | Thyroid | thyroid carcinoma | Female | <65 | I/II | Unknown | Unknown | SD | |
| ARSE | insertion | Frame_Shift_Ins | novel | c.643_644insAGAATAAGGG | p.Arg215GlnfsTer101 | p.R215Qfs*101 | protein_coding | TCGA-FY-A4B0-01 | Thyroid | thyroid carcinoma | Male | >=65 | I/II | Hormone Therapy | synthroid | SD |
| Page: 1 2 3 4 5 6 7 |
Top |
Related drugs of malignant transformation related genes |
| Identification of chemicals and drugs interact with genes involved in malignant transfromation |
| (DGIdb 4.0) |
| Entrez ID | Symbol | Category | Interaction Types | Drug Claim Name | Drug Name | PMIDs |
| Page: 1 |

Copyright 2023-Present -The University of Texas Health Science Center at Houston |