
|
|||||
|
 | |
| |
| |
| |
| |
| |
|
Gene: WARS |
Gene summary for WARS |
| Gene information | Species | Human | Gene symbol | WARS | Gene ID | 7453 |
| Gene name | tryptophanyl-tRNA synthetase 1 | |
| Gene Alias | GAMMA-2 | |
| Cytomap | 14q32.2 | |
| Gene Type | protein-coding | GO ID | GO:0001525 | UniProtAcc | A0A024R6K8 |
Top |
Malignant transformation analysis |
| Identification of the aberrant gene expression in precancerous and cancerous lesions by comparing the gene expression of stem-like cells in diseased tissues with normal stem cells |
| Entrez ID | Symbol | Replicates | Species | Organ | Tissue | Adj P-value | Log2FC | Malignancy |
| 7453 | WARS | CCI_1 | Human | Cervix | CC | 1.49e-06 | 7.16e-01 | 0.528 |
| 7453 | WARS | CCI_2 | Human | Cervix | CC | 5.24e-13 | 1.00e+00 | 0.5249 |
| 7453 | WARS | CCI_3 | Human | Cervix | CC | 3.64e-03 | 2.47e-01 | 0.516 |
| 7453 | WARS | Tumor | Human | Cervix | CC | 1.38e-77 | 1.17e+00 | 0.1241 |
| 7453 | WARS | sample1 | Human | Cervix | CC | 5.56e-55 | 1.38e+00 | 0.0959 |
| 7453 | WARS | sample3 | Human | Cervix | CC | 3.62e-86 | 1.22e+00 | 0.1387 |
| 7453 | WARS | T1 | Human | Cervix | CC | 1.19e-75 | 1.21e+00 | 0.0918 |
| 7453 | WARS | T2 | Human | Cervix | CC | 6.01e-03 | 2.08e-01 | 0.0709 |
| 7453 | WARS | T3 | Human | Cervix | CC | 1.41e-80 | 1.17e+00 | 0.1389 |
| 7453 | WARS | EEC-subject5 | Human | Endometrium | EEC | 1.87e-02 | 2.09e-01 | -0.249 |
| 7453 | WARS | GSM6177620_NYU_UCEC1_lib1_lib1 | Human | Endometrium | EEC | 8.45e-13 | 4.53e-01 | -0.1869 |
| 7453 | WARS | GSM6177620_NYU_UCEC1_lib2_lib2 | Human | Endometrium | EEC | 1.54e-14 | 5.10e-01 | -0.1875 |
| 7453 | WARS | GSM6177620_NYU_UCEC1_lib3_lib3 | Human | Endometrium | EEC | 3.13e-15 | 4.83e-01 | -0.1883 |
| 7453 | WARS | GSM6177621_NYU_UCEC2_lib1_lib1 | Human | Endometrium | EEC | 6.26e-05 | 1.11e-01 | -0.1934 |
| 7453 | WARS | GSM6177622_NYU_UCEC3_lib1_lib1 | Human | Endometrium | EEC | 8.11e-19 | 4.24e-01 | -0.1917 |
| 7453 | WARS | GSM6177622_NYU_UCEC3_lib2_lib2 | Human | Endometrium | EEC | 3.23e-15 | 4.37e-01 | -0.1916 |
| 7453 | WARS | GSM6177623_NYU_UCEC3_Vis | Human | Endometrium | EEC | 2.62e-13 | 4.92e-01 | -0.1269 |
| 7453 | WARS | LZE2T | Human | Esophagus | ESCC | 3.43e-04 | 6.47e-01 | 0.082 |
| 7453 | WARS | LZE4T | Human | Esophagus | ESCC | 6.97e-10 | 2.45e-01 | 0.0811 |
| 7453 | WARS | LZE5T | Human | Esophagus | ESCC | 1.14e-04 | 3.75e-01 | 0.0514 |
| Page: 1 2 3 4 5 6 7 |
| Tissue | Expression Dynamics | Abbreviation |
| Cervix |  | CC: Cervix cancer |
| HSIL_HPV: HPV-infected high-grade squamous intraepithelial lesions | ||
| N_HPV: HPV-infected normal cervix | ||
| Endometrium | 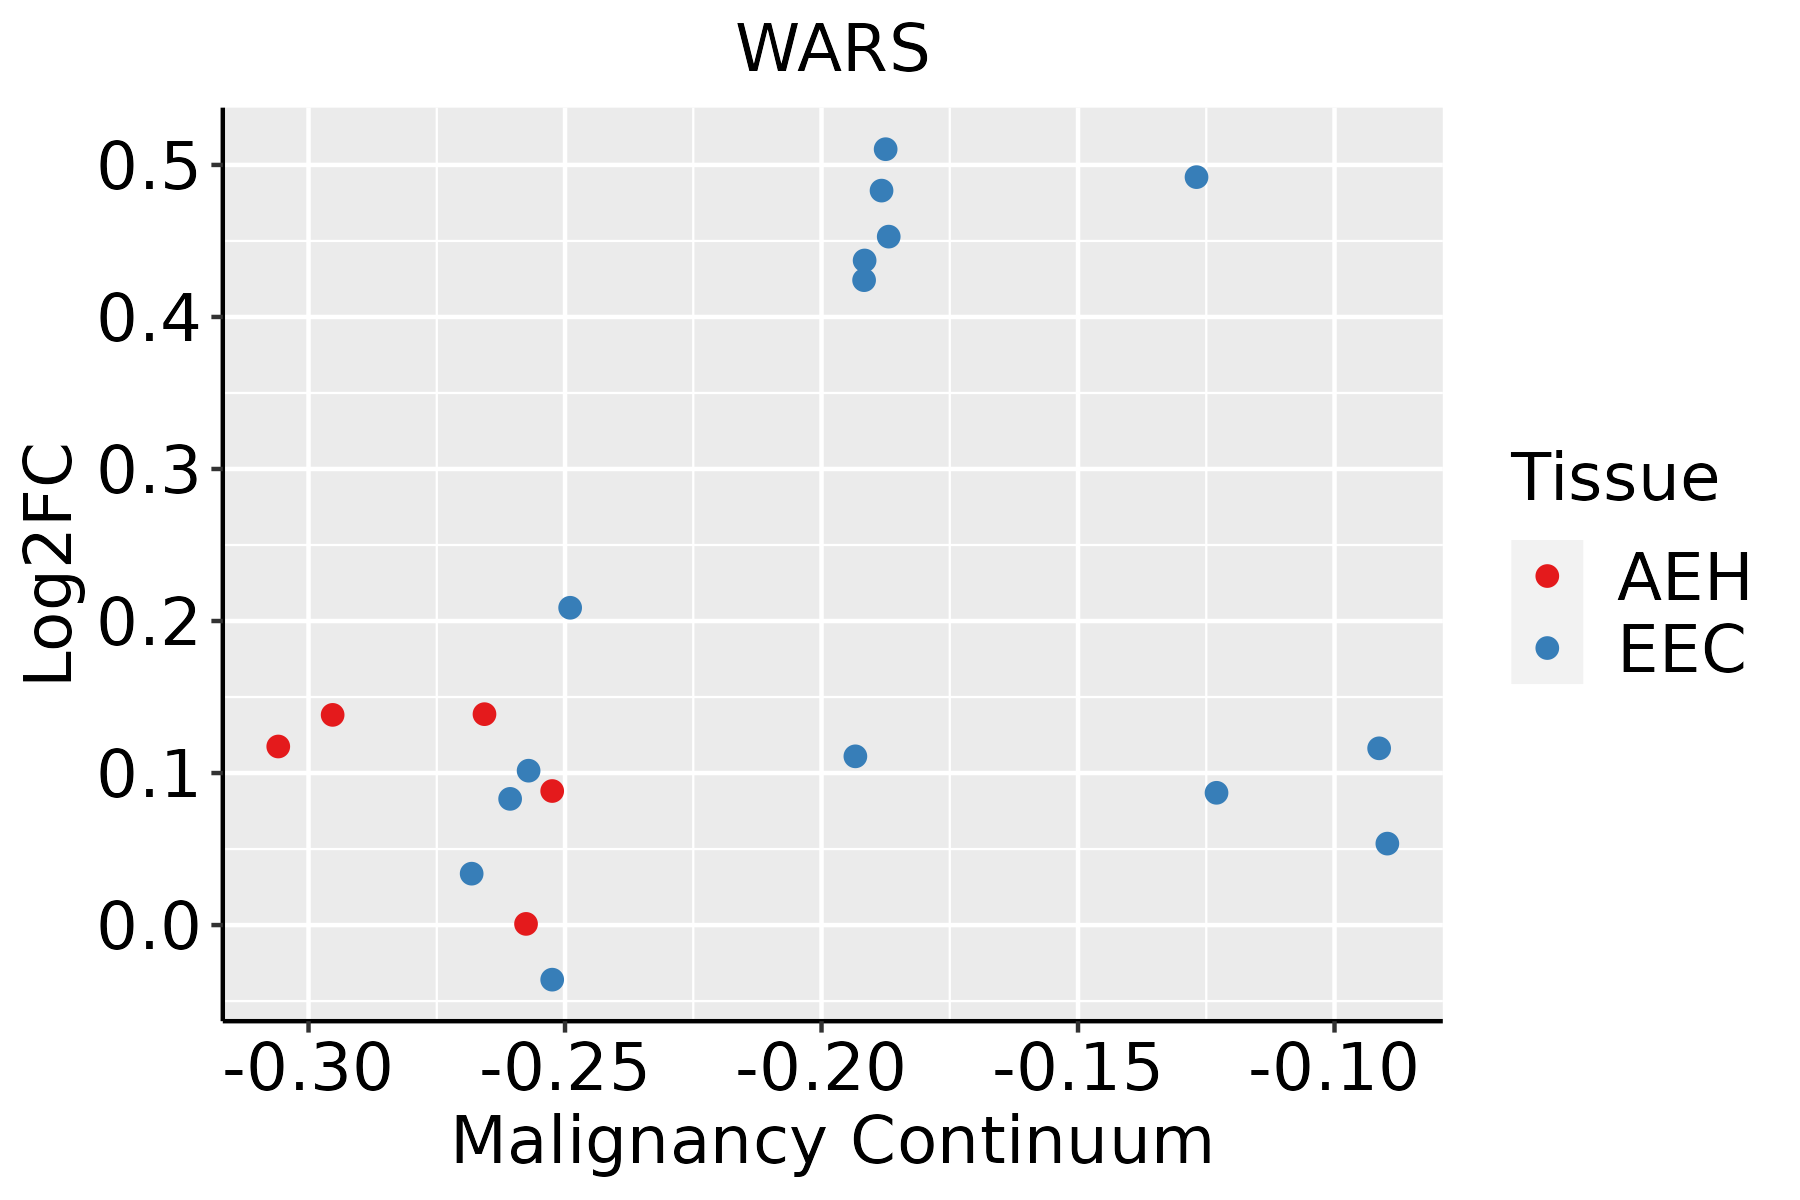 | AEH: Atypical endometrial hyperplasia |
| EEC: Endometrioid Cancer | ||
| Esophagus | 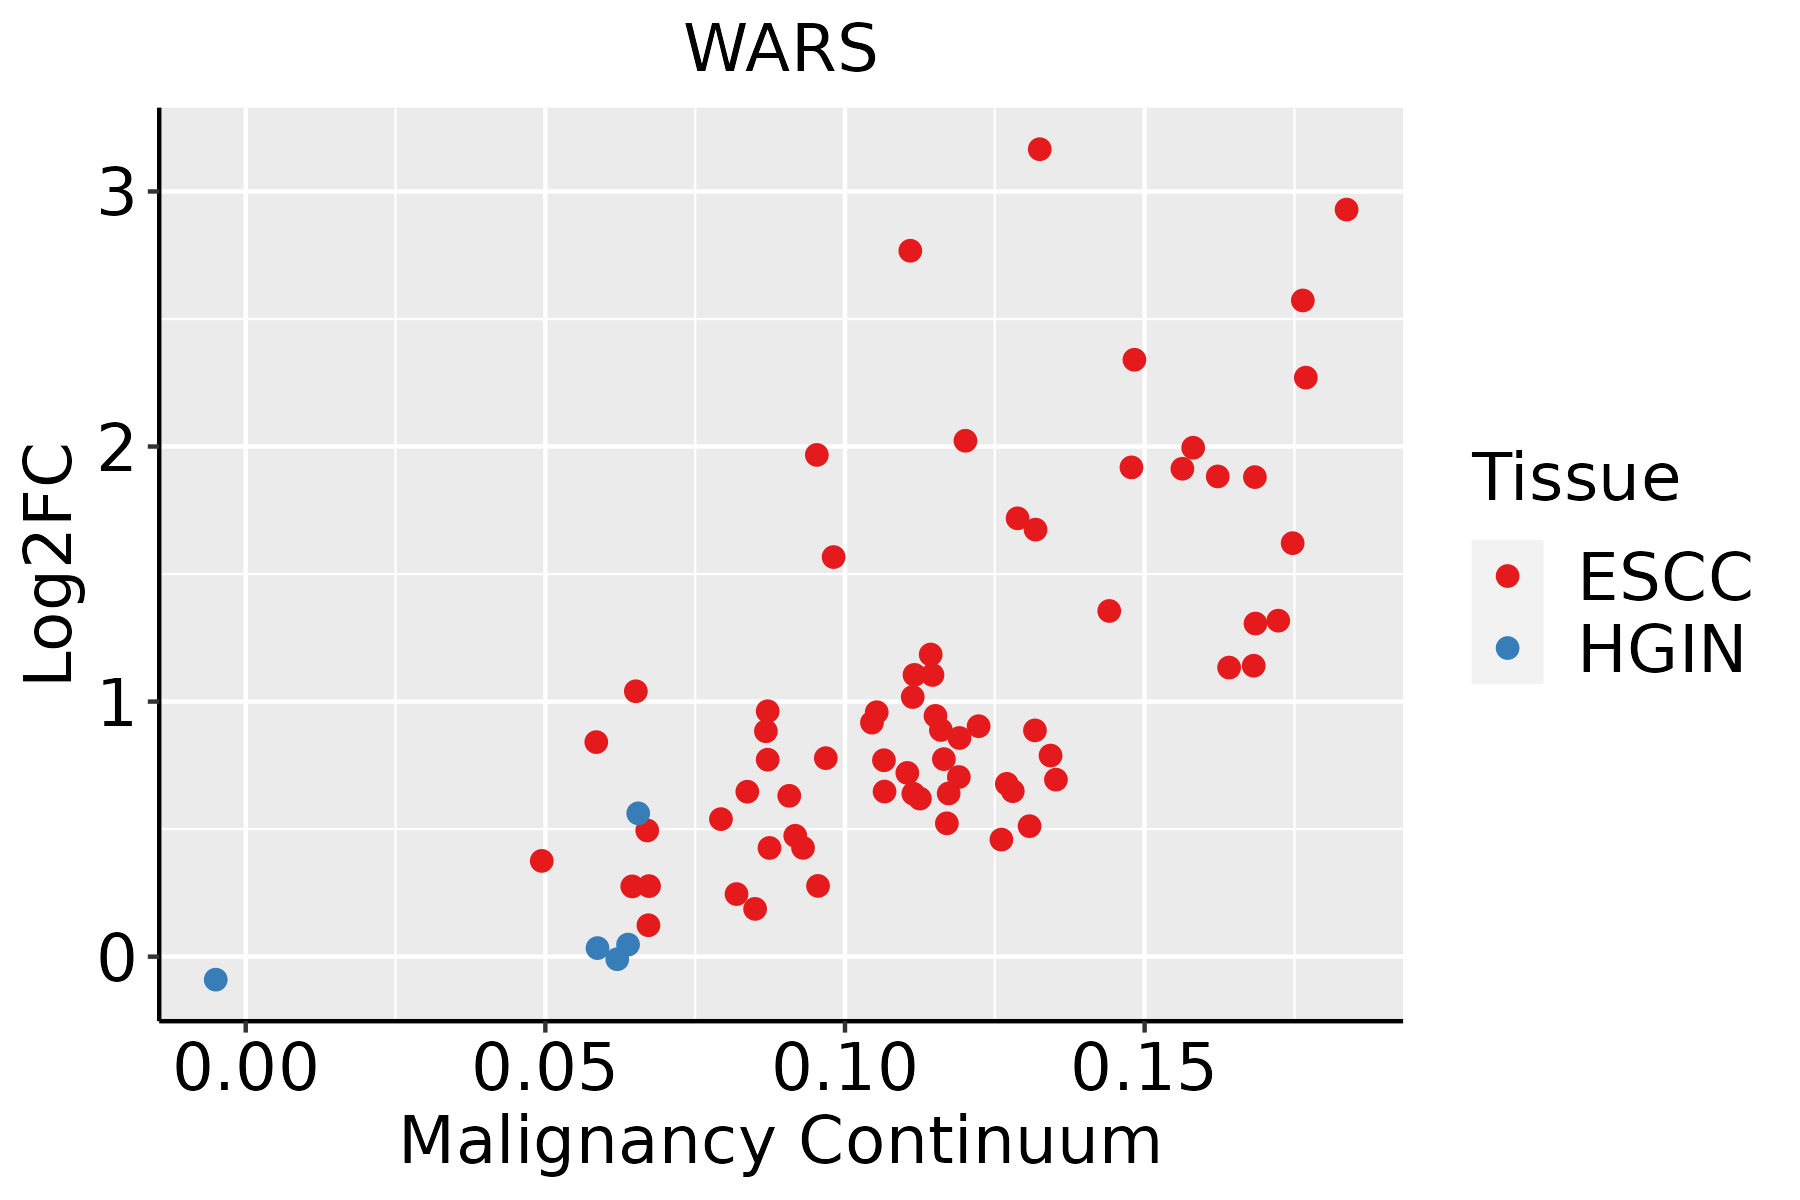 | ESCC: Esophageal squamous cell carcinoma |
| HGIN: High-grade intraepithelial neoplasias | ||
| LGIN: Low-grade intraepithelial neoplasias | ||
| Liver |  | HCC: Hepatocellular carcinoma |
| NAFLD: Non-alcoholic fatty liver disease | ||
| Oral Cavity |  | EOLP: Erosive Oral lichen planus |
| LP: leukoplakia | ||
| NEOLP: Non-erosive oral lichen planus | ||
| OSCC: Oral squamous cell carcinoma | ||
| Skin | 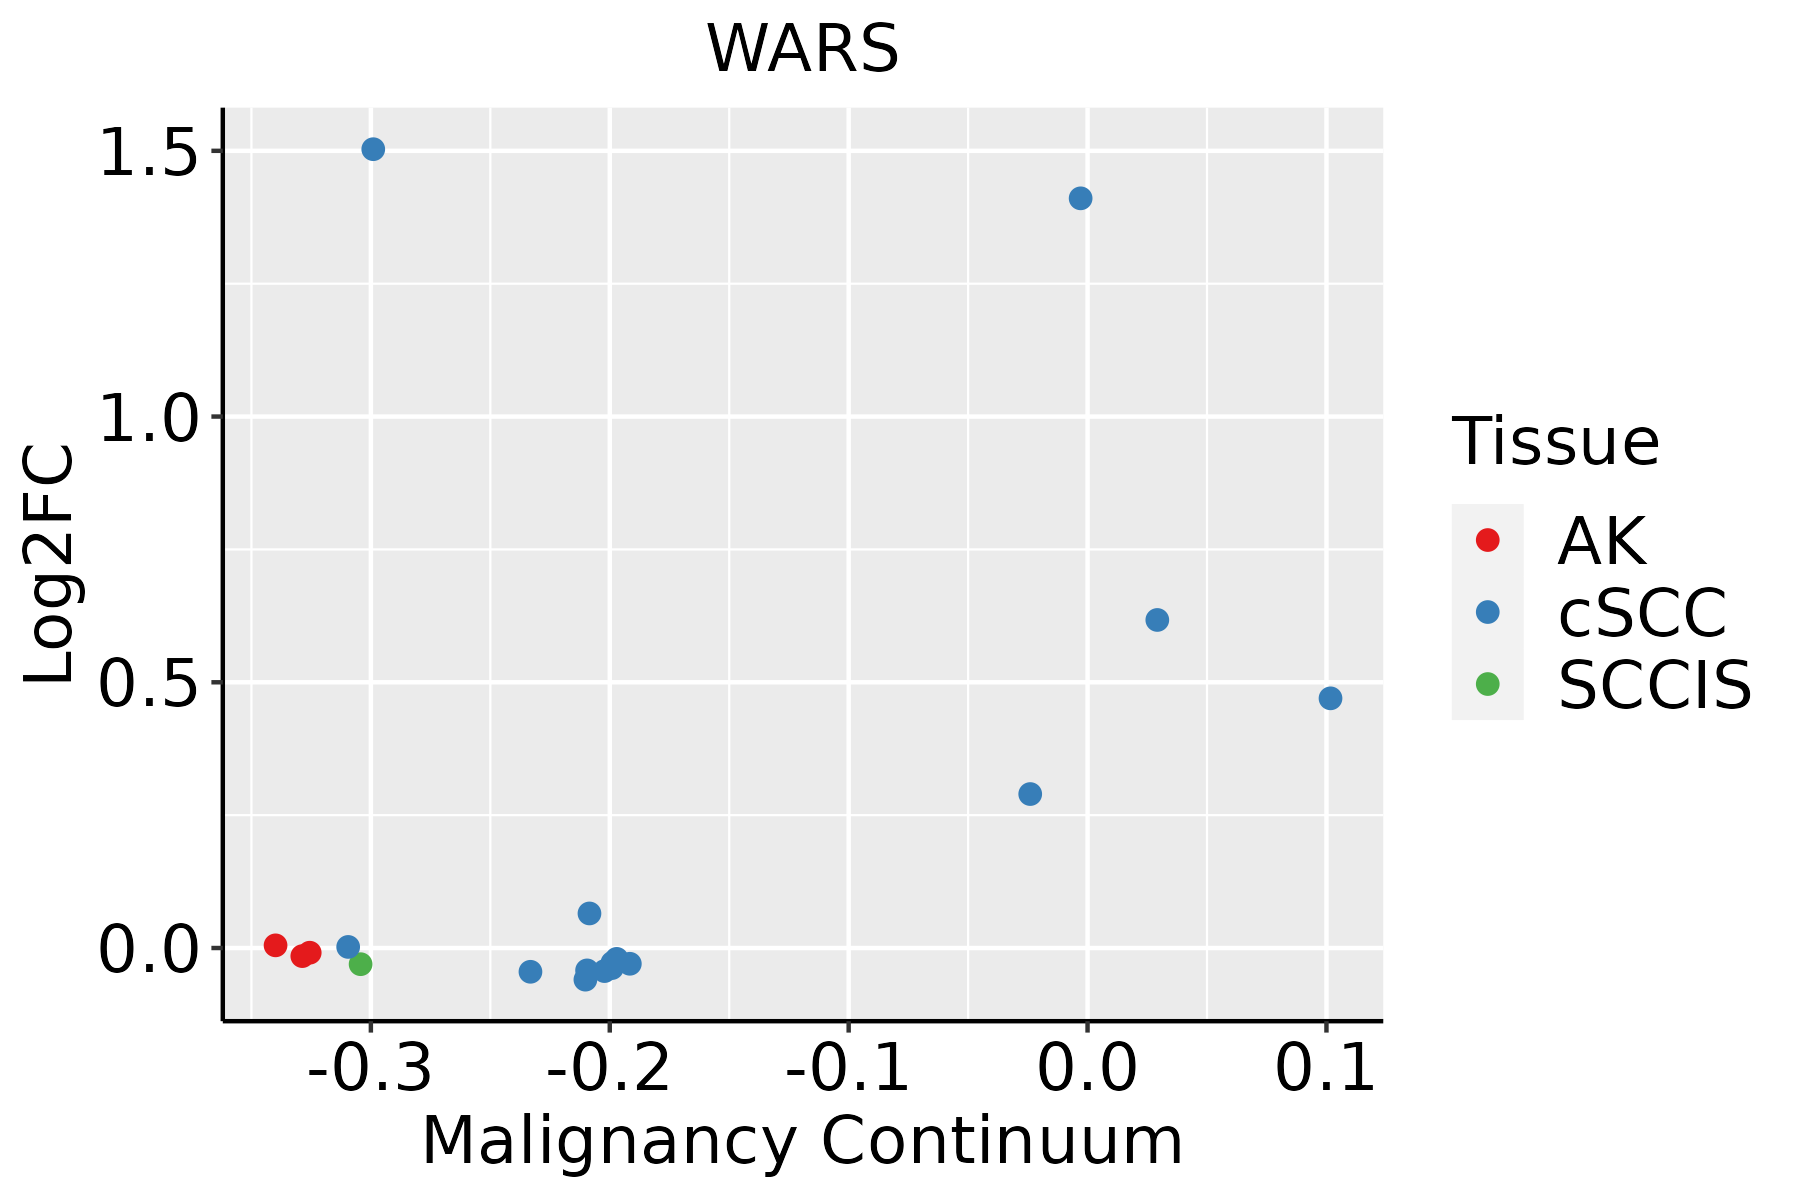 | AK: Actinic keratosis |
| cSCC: Cutaneous squamous cell carcinoma | ||
| SCCIS:squamous cell carcinoma in situ | ||
| Thyroid |  | ATC: Anaplastic thyroid cancer |
| HT: Hashimoto's thyroiditis | ||
| PTC: Papillary thyroid cancer |
| ∗log2FC in expression of this searched gene in stem-like cells from each diseased tissue sample relative to stem-like cells in normal samples in each tissue plotted against the malignancy continuum. Samples are colored based on if they are from different disease stage. |
Top |
Malignant transformation related pathway analysis |
| Find out the enriched GO biological processes and KEGG pathways involved in transition from healthy to precancer to cancer |
| Tissue | Disease Stage | Enriched GO biological Processes |
| Colorectum | AD |  |
| Colorectum | SER |  |
| Colorectum | MSS |  |
| Colorectum | MSI-H |  |
| Colorectum | FAP |  |
| ∗Top 15 enriched GO BP terms are showed in the bar plot of each disease state in each tissue. Each row represents a significant GO biological process which is colored according to the -log10(p.adjust). |
| Page: 1 2 3 4 5 6 7 8 9 |
| GO ID | Tissue | Disease Stage | Description | Gene Ratio | Bg Ratio | pvalue | p.adjust | Count |
| GO:003466012 | Esophagus | ESCC | ncRNA metabolic process | 346/8552 | 485/18723 | 4.35e-31 | 2.51e-28 | 346 |
| GO:014005313 | Esophagus | ESCC | mitochondrial gene expression | 93/8552 | 108/18723 | 1.96e-18 | 2.03e-16 | 93 |
| GO:003254314 | Esophagus | ESCC | mitochondrial translation | 68/8552 | 76/18723 | 1.02e-15 | 6.86e-14 | 68 |
| GO:00063992 | Esophagus | ESCC | tRNA metabolic process | 122/8552 | 179/18723 | 9.03e-10 | 2.19e-08 | 122 |
| GO:00009592 | Esophagus | ESCC | mitochondrial RNA metabolic process | 39/8552 | 49/18723 | 1.20e-06 | 1.49e-05 | 39 |
| Page: 1 |
| Pathway ID | Tissue | Disease Stage | Description | Gene Ratio | Bg Ratio | pvalue | p.adjust | qvalue | Count |
| Page: 1 |
Top |
Cell-cell communication analysis |
| Identification of potential cell-cell interactions between two cell types and their ligand-receptor pairs for different disease states |
| Ligand | Receptor | LRpair | Pathway | Tissue | Disease Stage |
| Page: 1 |
Top |
Single-cell gene regulatory network inference analysis |
| Find out the significant the regulons (TFs) and the target genes of each regulon across cell types for different disease states |
| TF | Cell Type | Tissue | Disease Stage | Target Gene | RSS | Regulon Activity |
| ∗The dot plots of a searched regulon are shown for all cell subpopulations in each disease state of each tissue based on the regulon specific score inferred using pySCENIC and by calculating the average expression. |
| Page: 1 |
Top |
Somatic mutation of malignant transformation related genes |
| Annotation of somatic variants for genes involved in malignant transformation |
| Hugo Symbol | Variant Class | Variant Classification | dbSNP RS | HGVSc | HGVSp | HGVSp Short | SWISSPROT | BIOTYPE | SIFT | PolyPhen | Tumor Sample Barcode | Tissue | Histology | Sex | Age | Stage | Therapy Types | Drugs | Outcome |
| WARS | SNV | Missense_Mutation | rs773270850 | c.1282G>A | p.Gly428Ser | p.G428S | P23381 | protein_coding | deleterious(0.04) | probably_damaging(0.928) | TCGA-BR-7707-01 | Stomach | stomach adenocarcinoma | Female | >=65 | I/II | Unknown | Unknown | SD |
| WARS | deletion | Frame_Shift_Del | novel | c.488delN | p.Gly163AlafsTer9 | p.G163Afs*9 | P23381 | protein_coding | TCGA-CG-5723-01 | Stomach | stomach adenocarcinoma | Male | >=65 | I/II | Unknown | Unknown | SD | ||
| WARS | insertion | Frame_Shift_Ins | novel | c.865_866insGTCTACCACAGCAC | p.Phe289CysfsTer36 | p.F289Cfs*36 | P23381 | protein_coding | TCGA-EL-A3H1-01 | Thyroid | thyroid carcinoma | Female | >=65 | I/II | Unknown | Unknown | SD |
| Page: 1 2 3 4 5 6 |
Top |
Related drugs of malignant transformation related genes |
| Identification of chemicals and drugs interact with genes involved in malignant transfromation |
| (DGIdb 4.0) |
| Entrez ID | Symbol | Category | Interaction Types | Drug Claim Name | Drug Name | PMIDs |
| Page: 1 |

Copyright 2023-Present -The University of Texas Health Science Center at Houston |