
|
|||||
|
 | |
| |
| |
| |
| |
| |
|
Gene: TGFB1I1 |
Gene summary for TGFB1I1 |
| Gene information | Species | Human | Gene symbol | TGFB1I1 | Gene ID | 7041 |
| Gene name | transforming growth factor beta 1 induced transcript 1 | |
| Gene Alias | ARA55 | |
| Cytomap | 16p11.2 | |
| Gene Type | protein-coding | GO ID | GO:0001837 | UniProtAcc | O43294 |
Top |
Malignant transformation analysis |
| Identification of the aberrant gene expression in precancerous and cancerous lesions by comparing the gene expression of stem-like cells in diseased tissues with normal stem cells |
| Entrez ID | Symbol | Replicates | Species | Organ | Tissue | Adj P-value | Log2FC | Malignancy |
| 7041 | TGFB1I1 | LZE4T | Human | Esophagus | ESCC | 1.54e-06 | 1.41e-01 | 0.0811 |
| 7041 | TGFB1I1 | LZE8T | Human | Esophagus | ESCC | 2.91e-02 | 6.81e-02 | 0.067 |
| 7041 | TGFB1I1 | LZE24T | Human | Esophagus | ESCC | 2.84e-02 | 5.01e-02 | 0.0596 |
| 7041 | TGFB1I1 | P2T-E | Human | Esophagus | ESCC | 1.57e-21 | 3.97e-01 | 0.1177 |
| 7041 | TGFB1I1 | P4T-E | Human | Esophagus | ESCC | 1.50e-17 | 7.04e-01 | 0.1323 |
| 7041 | TGFB1I1 | P5T-E | Human | Esophagus | ESCC | 5.36e-21 | 5.33e-01 | 0.1327 |
| 7041 | TGFB1I1 | P8T-E | Human | Esophagus | ESCC | 1.81e-18 | 4.03e-01 | 0.0889 |
| 7041 | TGFB1I1 | P9T-E | Human | Esophagus | ESCC | 2.87e-07 | 4.27e-01 | 0.1131 |
| 7041 | TGFB1I1 | P10T-E | Human | Esophagus | ESCC | 1.81e-18 | 4.65e-01 | 0.116 |
| 7041 | TGFB1I1 | P11T-E | Human | Esophagus | ESCC | 6.81e-18 | 1.03e+00 | 0.1426 |
| 7041 | TGFB1I1 | P12T-E | Human | Esophagus | ESCC | 1.20e-51 | 1.01e+00 | 0.1122 |
| 7041 | TGFB1I1 | P16T-E | Human | Esophagus | ESCC | 6.37e-46 | 8.82e-01 | 0.1153 |
| 7041 | TGFB1I1 | P17T-E | Human | Esophagus | ESCC | 9.24e-03 | 5.80e-01 | 0.1278 |
| 7041 | TGFB1I1 | P19T-E | Human | Esophagus | ESCC | 7.92e-10 | 1.66e+00 | 0.1662 |
| 7041 | TGFB1I1 | P21T-E | Human | Esophagus | ESCC | 9.66e-37 | 8.31e-01 | 0.1617 |
| 7041 | TGFB1I1 | P22T-E | Human | Esophagus | ESCC | 8.08e-28 | 5.33e-01 | 0.1236 |
| 7041 | TGFB1I1 | P23T-E | Human | Esophagus | ESCC | 3.20e-09 | 5.02e-01 | 0.108 |
| 7041 | TGFB1I1 | P24T-E | Human | Esophagus | ESCC | 3.28e-32 | 7.92e-01 | 0.1287 |
| 7041 | TGFB1I1 | P26T-E | Human | Esophagus | ESCC | 2.21e-21 | 4.44e-01 | 0.1276 |
| 7041 | TGFB1I1 | P27T-E | Human | Esophagus | ESCC | 6.99e-03 | 1.46e-01 | 0.1055 |
| Page: 1 2 3 4 |
| Tissue | Expression Dynamics | Abbreviation |
| Esophagus | 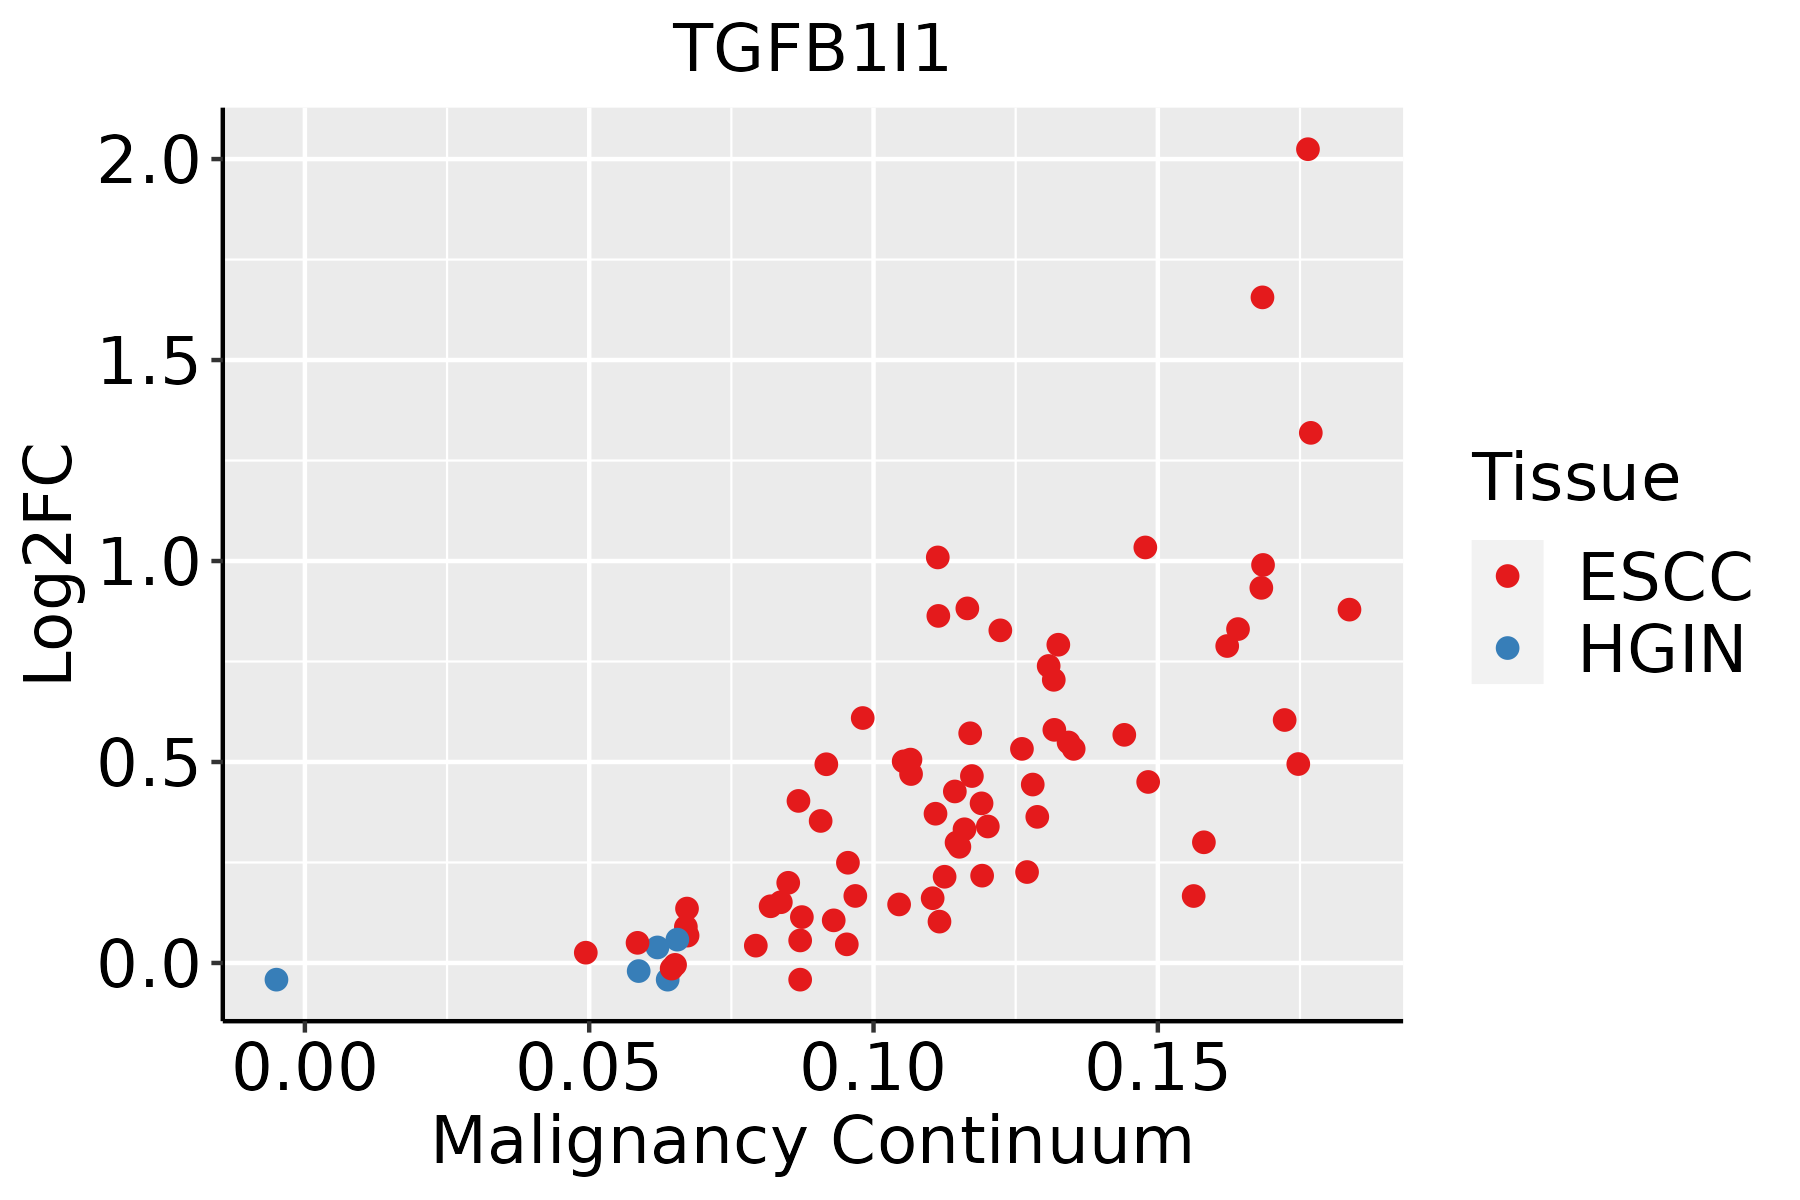 | ESCC: Esophageal squamous cell carcinoma |
| HGIN: High-grade intraepithelial neoplasias | ||
| LGIN: Low-grade intraepithelial neoplasias | ||
| Oral Cavity | 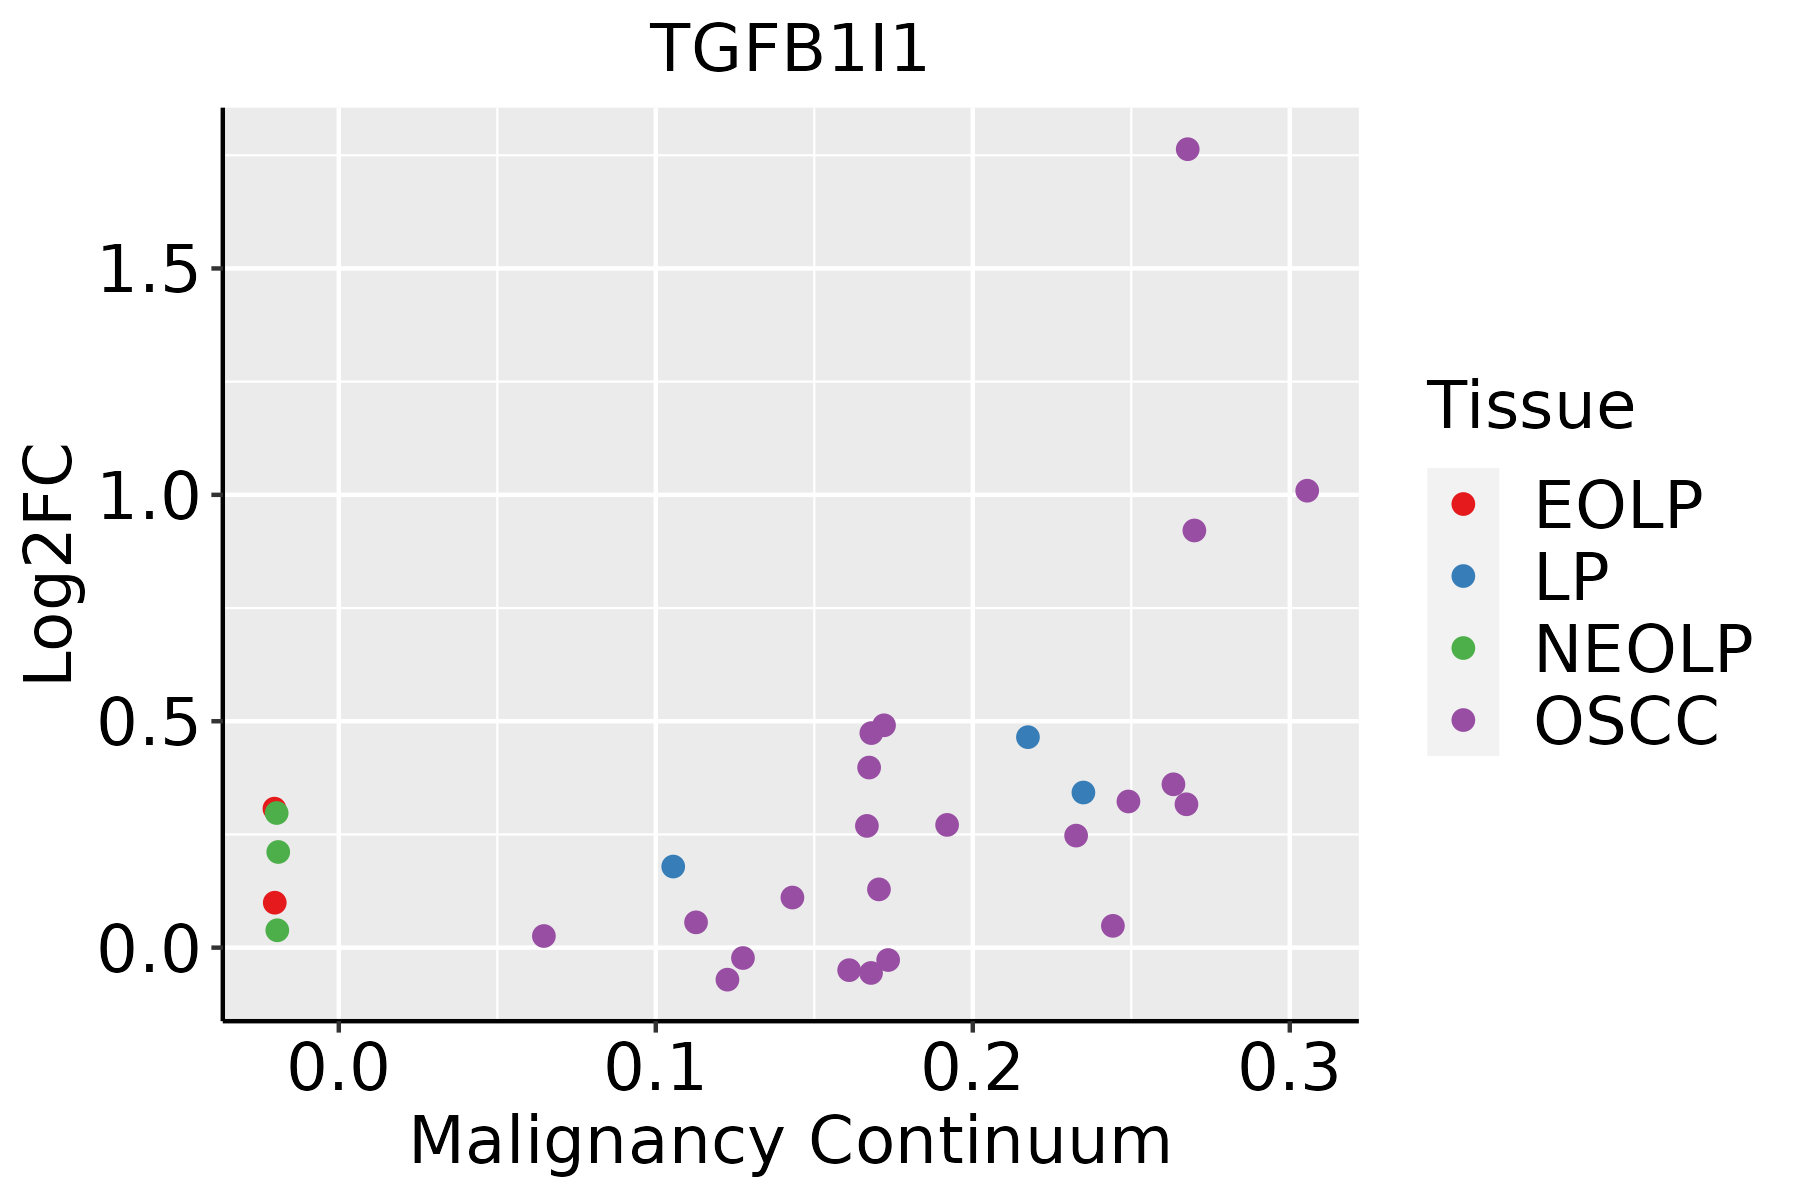 | EOLP: Erosive Oral lichen planus |
| LP: leukoplakia | ||
| NEOLP: Non-erosive oral lichen planus | ||
| OSCC: Oral squamous cell carcinoma | ||
| Thyroid | 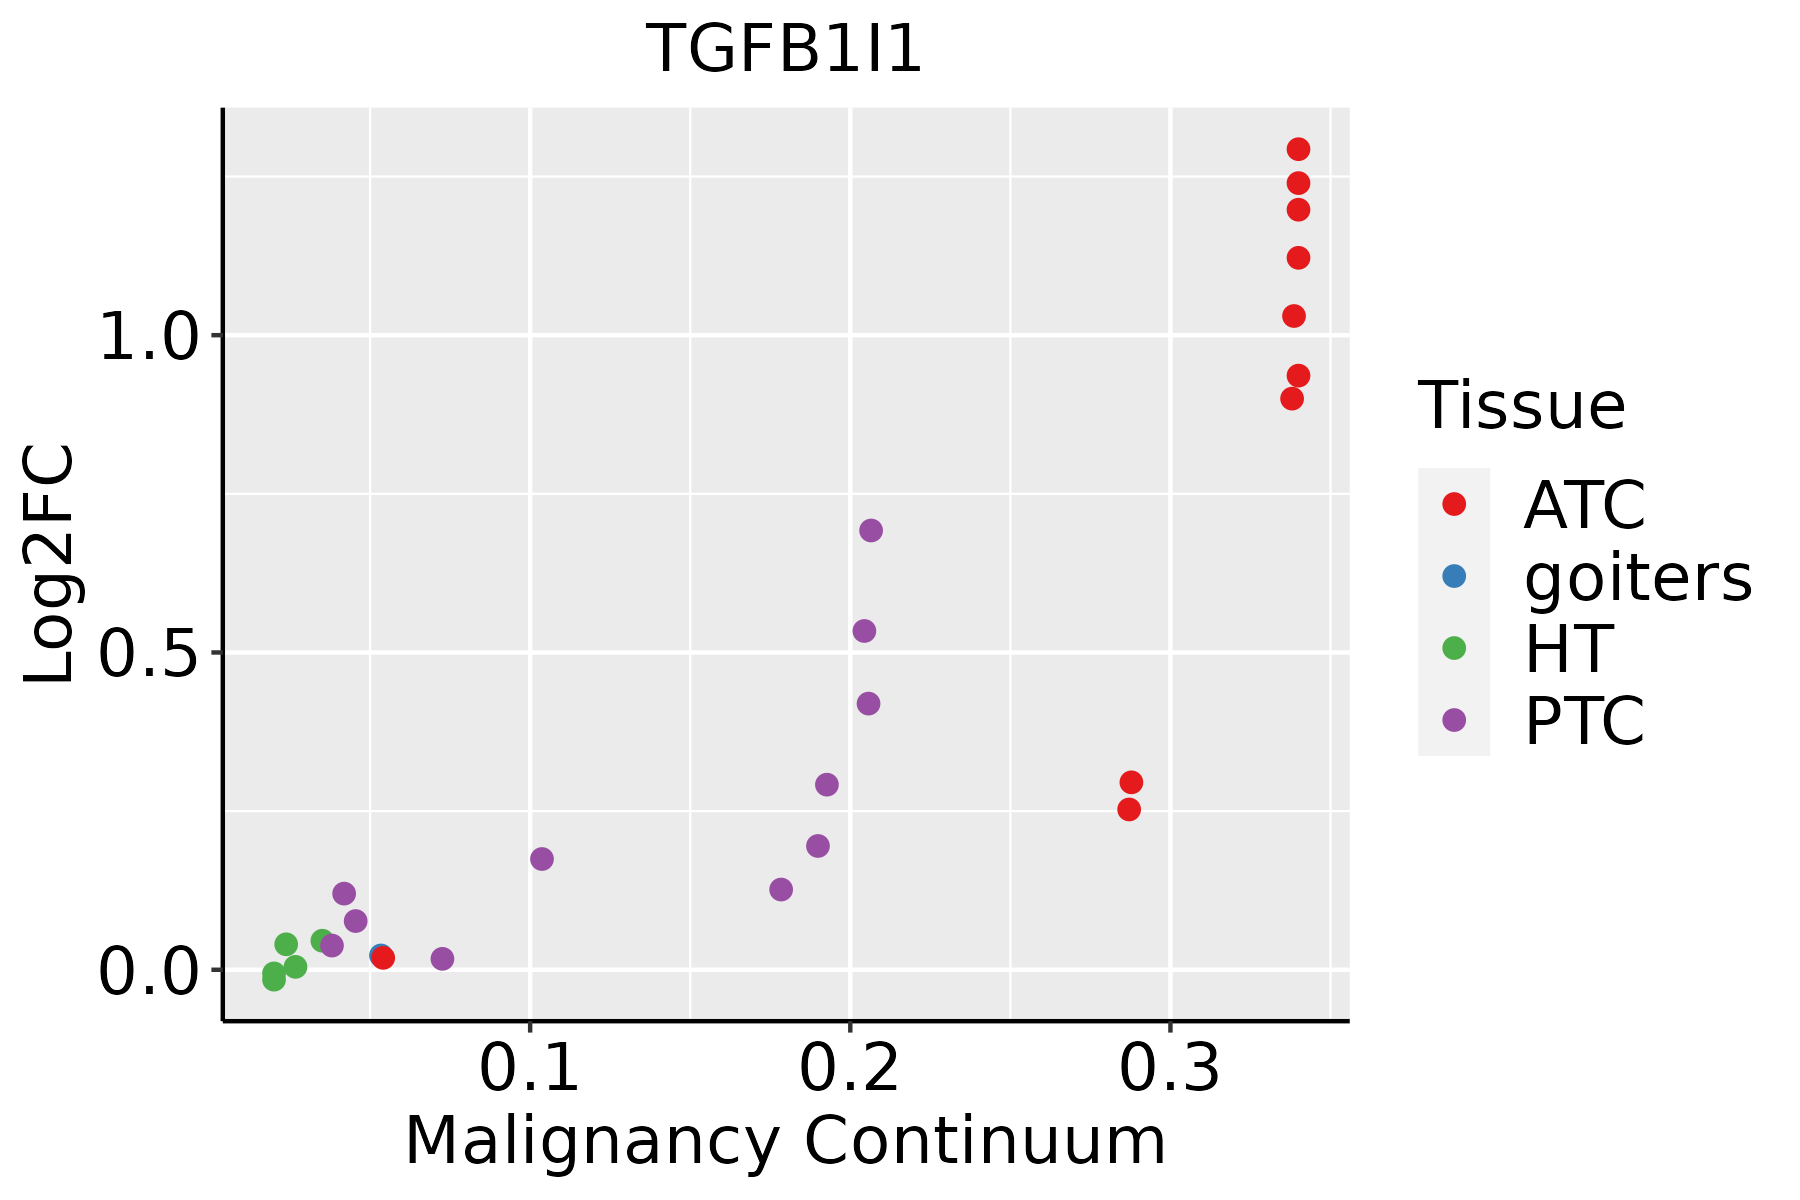 | ATC: Anaplastic thyroid cancer |
| HT: Hashimoto's thyroiditis | ||
| PTC: Papillary thyroid cancer |
| ∗log2FC in expression of this searched gene in stem-like cells from each diseased tissue sample relative to stem-like cells in normal samples in each tissue plotted against the malignancy continuum. Samples are colored based on if they are from different disease stage. |
Top |
Malignant transformation related pathway analysis |
| Find out the enriched GO biological processes and KEGG pathways involved in transition from healthy to precancer to cancer |
| Tissue | Disease Stage | Enriched GO biological Processes |
| Colorectum | AD |  |
| Colorectum | SER |  |
| Colorectum | MSS |  |
| Colorectum | MSI-H |  |
| Colorectum | FAP |  |
| ∗Top 15 enriched GO BP terms are showed in the bar plot of each disease state in each tissue. Each row represents a significant GO biological process which is colored according to the -log10(p.adjust). |
| Page: 1 2 3 4 5 6 7 8 9 |
| GO ID | Tissue | Disease Stage | Description | Gene Ratio | Bg Ratio | pvalue | p.adjust | Count |
| GO:001605517 | Esophagus | ESCC | Wnt signaling pathway | 268/8552 | 444/18723 | 2.32e-10 | 6.58e-09 | 268 |
| GO:019873817 | Esophagus | ESCC | cell-cell signaling by wnt | 269/8552 | 446/18723 | 2.41e-10 | 6.79e-09 | 269 |
| GO:0009408110 | Esophagus | ESCC | response to heat | 77/8552 | 110/18723 | 2.01e-07 | 3.11e-06 | 77 |
| GO:00163316 | Esophagus | ESCC | morphogenesis of embryonic epithelium | 98/8552 | 147/18723 | 2.12e-07 | 3.27e-06 | 98 |
| GO:00715599 | Esophagus | ESCC | response to transforming growth factor beta | 157/8552 | 256/18723 | 2.95e-07 | 4.23e-06 | 157 |
| GO:00715609 | Esophagus | ESCC | cellular response to transforming growth factor beta stimulus | 151/8552 | 250/18723 | 1.78e-06 | 2.10e-05 | 151 |
| GO:00107184 | Esophagus | ESCC | positive regulation of epithelial to mesenchymal transition | 40/8552 | 52/18723 | 4.25e-06 | 4.56e-05 | 40 |
| GO:00071799 | Esophagus | ESCC | transforming growth factor beta receptor signaling pathway | 121/8552 | 198/18723 | 8.26e-06 | 8.03e-05 | 121 |
| GO:00454449 | Esophagus | ESCC | fat cell differentiation | 135/8552 | 229/18723 | 3.38e-05 | 2.78e-04 | 135 |
| GO:00018378 | Esophagus | ESCC | epithelial to mesenchymal transition | 95/8552 | 157/18723 | 1.25e-04 | 8.56e-04 | 95 |
| GO:000926619 | Esophagus | ESCC | response to temperature stimulus | 106/8552 | 178/18723 | 1.30e-04 | 8.84e-04 | 106 |
| GO:000717810 | Esophagus | ESCC | transmembrane receptor protein serine/threonine kinase signaling pathway | 195/8552 | 355/18723 | 2.58e-04 | 1.58e-03 | 195 |
| GO:00487628 | Esophagus | ESCC | mesenchymal cell differentiation | 133/8552 | 236/18723 | 5.94e-04 | 3.22e-03 | 133 |
| GO:00305115 | Esophagus | ESCC | positive regulation of transforming growth factor beta receptor signaling pathway | 24/8552 | 32/18723 | 7.22e-04 | 3.77e-03 | 24 |
| GO:19038465 | Esophagus | ESCC | positive regulation of cellular response to transforming growth factor beta stimulus | 24/8552 | 32/18723 | 7.22e-04 | 3.77e-03 | 24 |
| GO:00107174 | Esophagus | ESCC | regulation of epithelial to mesenchymal transition | 61/8552 | 99/18723 | 1.01e-03 | 5.09e-03 | 61 |
| GO:00170156 | Esophagus | ESCC | regulation of transforming growth factor beta receptor signaling pathway | 75/8552 | 128/18723 | 2.19e-03 | 9.71e-03 | 75 |
| GO:19038447 | Esophagus | ESCC | regulation of cellular response to transforming growth factor beta stimulus | 76/8552 | 131/18723 | 2.96e-03 | 1.24e-02 | 76 |
| GO:00604856 | Esophagus | ESCC | mesenchyme development | 156/8552 | 291/18723 | 3.76e-03 | 1.53e-02 | 156 |
| GO:00455984 | Esophagus | ESCC | regulation of fat cell differentiation | 79/8552 | 139/18723 | 5.23e-03 | 1.97e-02 | 79 |
| Page: 1 2 3 4 5 6 |
| Pathway ID | Tissue | Disease Stage | Description | Gene Ratio | Bg Ratio | pvalue | p.adjust | qvalue | Count |
| Page: 1 |
Top |
Cell-cell communication analysis |
| Identification of potential cell-cell interactions between two cell types and their ligand-receptor pairs for different disease states |
| Ligand | Receptor | LRpair | Pathway | Tissue | Disease Stage |
| Page: 1 |
Top |
Single-cell gene regulatory network inference analysis |
| Find out the significant the regulons (TFs) and the target genes of each regulon across cell types for different disease states |
| TF | Cell Type | Tissue | Disease Stage | Target Gene | RSS | Regulon Activity |
| ∗The dot plots of a searched regulon are shown for all cell subpopulations in each disease state of each tissue based on the regulon specific score inferred using pySCENIC and by calculating the average expression. |
| Page: 1 |
Top |
Somatic mutation of malignant transformation related genes |
| Annotation of somatic variants for genes involved in malignant transformation |
| Hugo Symbol | Variant Class | Variant Classification | dbSNP RS | HGVSc | HGVSp | HGVSp Short | SWISSPROT | BIOTYPE | SIFT | PolyPhen | Tumor Sample Barcode | Tissue | Histology | Sex | Age | Stage | Therapy Types | Drugs | Outcome |
| TGFB1I1 | SNV | Missense_Mutation | c.605N>A | p.Gly202Asp | p.G202D | O43294 | protein_coding | tolerated(0.27) | benign(0.007) | TCGA-BR-6452-01 | Stomach | stomach adenocarcinoma | Female | >=65 | I/II | Unknown | Unknown | SD | |
| TGFB1I1 | SNV | Missense_Mutation | c.1228N>T | p.Leu410Phe | p.L410F | O43294 | protein_coding | deleterious(0) | probably_damaging(0.926) | TCGA-CG-5721-01 | Stomach | stomach adenocarcinoma | Male | <65 | III/IV | Unknown | Unknown | SD | |
| TGFB1I1 | SNV | Missense_Mutation | c.199C>T | p.Arg67Trp | p.R67W | O43294 | protein_coding | deleterious(0.05) | possibly_damaging(0.708) | TCGA-HU-A4H3-01 | Stomach | stomach adenocarcinoma | Female | <65 | III/IV | Chemotherapy | ts-1 | PD | |
| TGFB1I1 | deletion | In_Frame_Del | c.376_378delAAG | p.Lys126del | p.K126del | O43294 | protein_coding | TCGA-VQ-AA64-01 | Stomach | stomach adenocarcinoma | Male | >=65 | III/IV | Chemotherapy | fluorouracil | PD | |||
| TGFB1I1 | SNV | Missense_Mutation | novel | c.1310C>A | p.Pro437Gln | p.P437Q | O43294 | protein_coding | tolerated(1) | benign(0.005) | TCGA-EM-A2CJ-01 | Thyroid | thyroid carcinoma | Female | <65 | I/II | Unknown | Unknown | SD |
| Page: 1 2 3 4 5 6 |
Top |
Related drugs of malignant transformation related genes |
| Identification of chemicals and drugs interact with genes involved in malignant transfromation |
| (DGIdb 4.0) |
| Entrez ID | Symbol | Category | Interaction Types | Drug Claim Name | Drug Name | PMIDs |
| Page: 1 |

Copyright 2023-Present -The University of Texas Health Science Center at Houston |