
|
|||||
|
 | |
| |
| |
| |
| |
| |
|
Gene: TBC1D17 |
Gene summary for TBC1D17 |
| Gene information | Species | Human | Gene symbol | TBC1D17 | Gene ID | 79735 |
| Gene name | TBC1 domain family member 17 | |
| Gene Alias | TBC1D17 | |
| Cytomap | 19q13.33 | |
| Gene Type | protein-coding | GO ID | GO:0006810 | UniProtAcc | Q9HA65 |
Top |
Malignant transformation analysis |
| Identification of the aberrant gene expression in precancerous and cancerous lesions by comparing the gene expression of stem-like cells in diseased tissues with normal stem cells |
| Entrez ID | Symbol | Replicates | Species | Organ | Tissue | Adj P-value | Log2FC | Malignancy |
| 79735 | TBC1D17 | LZE4T | Human | Esophagus | ESCC | 1.61e-09 | 1.85e-01 | 0.0811 |
| 79735 | TBC1D17 | LZE7T | Human | Esophagus | ESCC | 1.01e-07 | 3.48e-01 | 0.0667 |
| 79735 | TBC1D17 | LZE20T | Human | Esophagus | ESCC | 4.44e-07 | 1.84e-01 | 0.0662 |
| 79735 | TBC1D17 | LZE22T | Human | Esophagus | ESCC | 1.45e-09 | 5.63e-01 | 0.068 |
| 79735 | TBC1D17 | LZE24T | Human | Esophagus | ESCC | 3.85e-17 | 4.45e-01 | 0.0596 |
| 79735 | TBC1D17 | LZE21T | Human | Esophagus | ESCC | 7.15e-03 | 4.03e-01 | 0.0655 |
| 79735 | TBC1D17 | P1T-E | Human | Esophagus | ESCC | 1.04e-10 | 6.70e-01 | 0.0875 |
| 79735 | TBC1D17 | P2T-E | Human | Esophagus | ESCC | 2.96e-46 | 7.68e-01 | 0.1177 |
| 79735 | TBC1D17 | P4T-E | Human | Esophagus | ESCC | 2.53e-18 | 4.25e-01 | 0.1323 |
| 79735 | TBC1D17 | P5T-E | Human | Esophagus | ESCC | 3.76e-19 | 8.91e-02 | 0.1327 |
| 79735 | TBC1D17 | P8T-E | Human | Esophagus | ESCC | 1.83e-42 | 8.24e-01 | 0.0889 |
| 79735 | TBC1D17 | P9T-E | Human | Esophagus | ESCC | 9.02e-12 | 2.11e-01 | 0.1131 |
| 79735 | TBC1D17 | P10T-E | Human | Esophagus | ESCC | 7.22e-38 | 6.58e-01 | 0.116 |
| 79735 | TBC1D17 | P11T-E | Human | Esophagus | ESCC | 2.36e-16 | 5.74e-01 | 0.1426 |
| 79735 | TBC1D17 | P12T-E | Human | Esophagus | ESCC | 2.06e-29 | 4.36e-01 | 0.1122 |
| 79735 | TBC1D17 | P15T-E | Human | Esophagus | ESCC | 6.27e-24 | 4.55e-01 | 0.1149 |
| 79735 | TBC1D17 | P16T-E | Human | Esophagus | ESCC | 1.92e-38 | 8.71e-01 | 0.1153 |
| 79735 | TBC1D17 | P17T-E | Human | Esophagus | ESCC | 1.05e-14 | 4.55e-01 | 0.1278 |
| 79735 | TBC1D17 | P19T-E | Human | Esophagus | ESCC | 2.04e-06 | 5.05e-01 | 0.1662 |
| 79735 | TBC1D17 | P20T-E | Human | Esophagus | ESCC | 2.86e-11 | 2.47e-01 | 0.1124 |
| Page: 1 2 3 4 5 |
| Tissue | Expression Dynamics | Abbreviation |
| Esophagus |  | ESCC: Esophageal squamous cell carcinoma |
| HGIN: High-grade intraepithelial neoplasias | ||
| LGIN: Low-grade intraepithelial neoplasias | ||
| Oral Cavity | 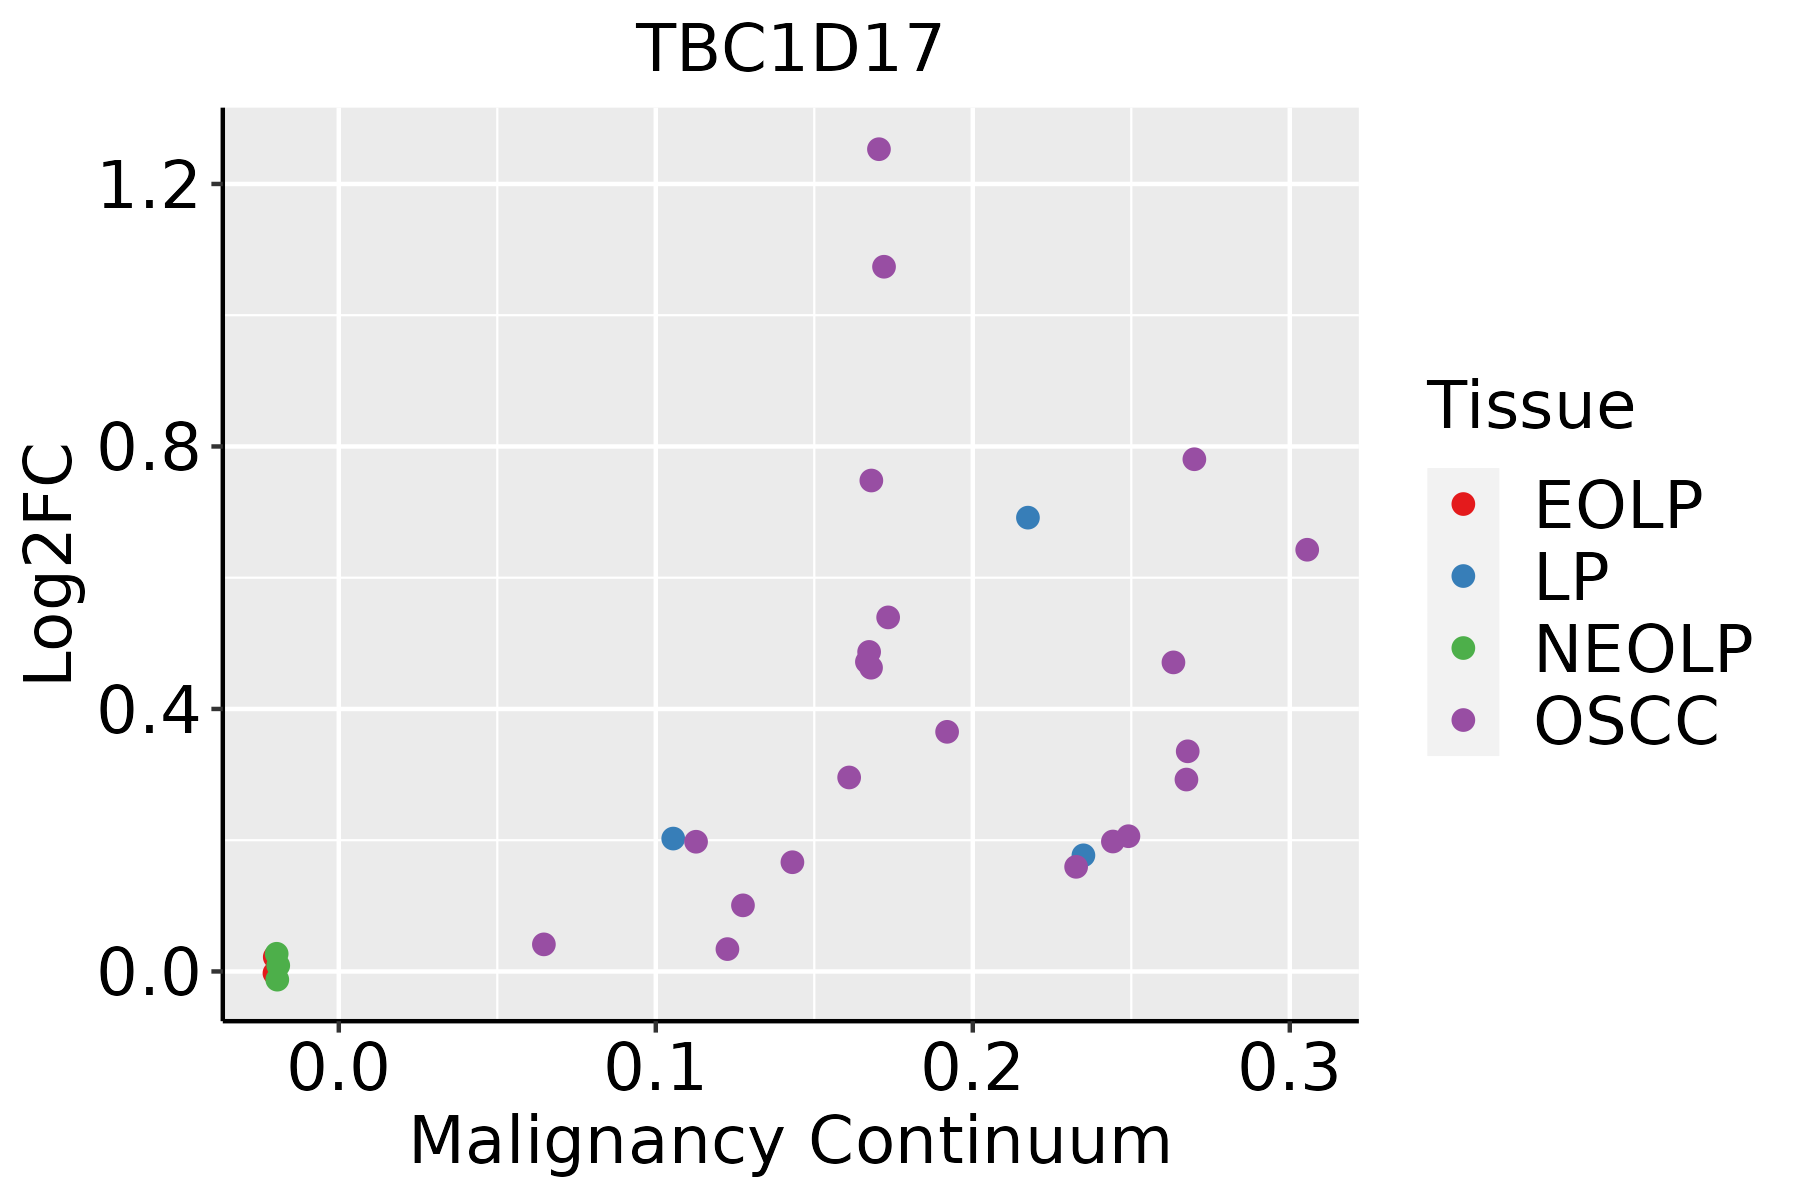 | EOLP: Erosive Oral lichen planus |
| LP: leukoplakia | ||
| NEOLP: Non-erosive oral lichen planus | ||
| OSCC: Oral squamous cell carcinoma | ||
| Thyroid | 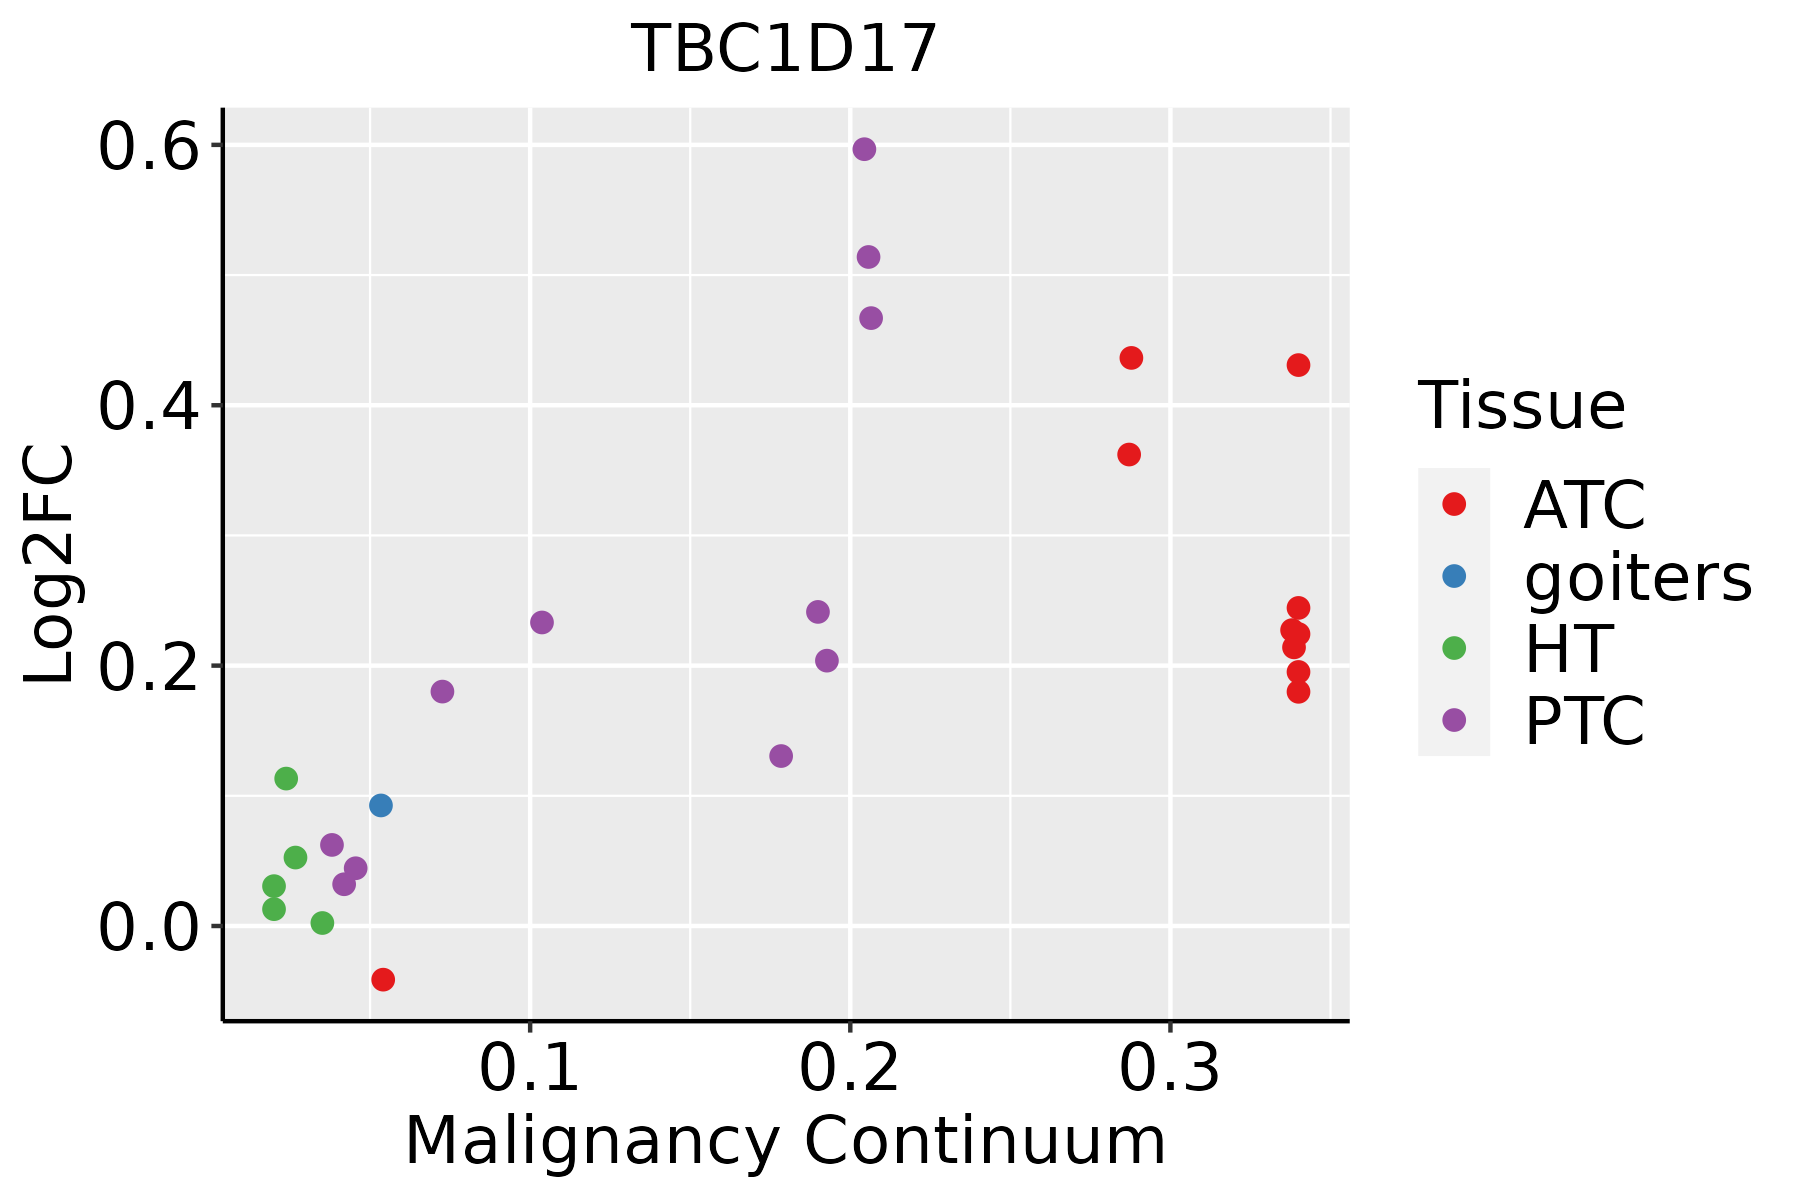 | ATC: Anaplastic thyroid cancer |
| HT: Hashimoto's thyroiditis | ||
| PTC: Papillary thyroid cancer |
| ∗log2FC in expression of this searched gene in stem-like cells from each diseased tissue sample relative to stem-like cells in normal samples in each tissue plotted against the malignancy continuum. Samples are colored based on if they are from different disease stage. |
Top |
Malignant transformation related pathway analysis |
| Find out the enriched GO biological processes and KEGG pathways involved in transition from healthy to precancer to cancer |
| Tissue | Disease Stage | Enriched GO biological Processes |
| Colorectum | AD |  |
| Colorectum | SER |  |
| Colorectum | MSS |  |
| Colorectum | MSI-H |  |
| Colorectum | FAP |  |
| ∗Top 15 enriched GO BP terms are showed in the bar plot of each disease state in each tissue. Each row represents a significant GO biological process which is colored according to the -log10(p.adjust). |
| Page: 1 2 3 4 5 6 7 8 9 |
| GO ID | Tissue | Disease Stage | Description | Gene Ratio | Bg Ratio | pvalue | p.adjust | Count |
| GO:001619715 | Esophagus | ESCC | endosomal transport | 168/8552 | 230/18723 | 2.28e-17 | 1.93e-15 | 168 |
| GO:001648210 | Esophagus | ESCC | cytosolic transport | 124/8552 | 168/18723 | 9.69e-14 | 4.69e-12 | 124 |
| GO:00421477 | Esophagus | ESCC | retrograde transport, endosome to Golgi | 63/8552 | 91/18723 | 4.58e-06 | 4.87e-05 | 63 |
| GO:004308715 | Esophagus | ESCC | regulation of GTPase activity | 183/8552 | 348/18723 | 5.34e-03 | 2.00e-02 | 183 |
| GO:00161979 | Oral cavity | OSCC | endosomal transport | 141/7305 | 230/18723 | 5.40e-12 | 2.06e-10 | 141 |
| GO:00164829 | Oral cavity | OSCC | cytosolic transport | 106/7305 | 168/18723 | 2.08e-10 | 5.90e-09 | 106 |
| GO:00421476 | Oral cavity | OSCC | retrograde transport, endosome to Golgi | 55/7305 | 91/18723 | 2.79e-05 | 2.59e-04 | 55 |
| GO:004308710 | Oral cavity | OSCC | regulation of GTPase activity | 165/7305 | 348/18723 | 7.94e-04 | 4.27e-03 | 165 |
| GO:001619718 | Thyroid | PTC | endosomal transport | 128/5968 | 230/18723 | 6.26e-14 | 3.52e-12 | 128 |
| GO:001648217 | Thyroid | PTC | cytosolic transport | 92/5968 | 168/18723 | 6.41e-10 | 1.97e-08 | 92 |
| GO:004308718 | Thyroid | PTC | regulation of GTPase activity | 148/5968 | 348/18723 | 1.63e-05 | 1.71e-04 | 148 |
| GO:00421479 | Thyroid | PTC | retrograde transport, endosome to Golgi | 48/5968 | 91/18723 | 2.86e-05 | 2.78e-04 | 48 |
| GO:004354714 | Thyroid | PTC | positive regulation of GTPase activity | 103/5968 | 255/18723 | 2.38e-03 | 1.25e-02 | 103 |
| GO:001619719 | Thyroid | ATC | endosomal transport | 128/6293 | 230/18723 | 4.44e-12 | 1.75e-10 | 128 |
| GO:001648218 | Thyroid | ATC | cytosolic transport | 93/6293 | 168/18723 | 5.19e-09 | 1.15e-07 | 93 |
| GO:004308719 | Thyroid | ATC | regulation of GTPase activity | 153/6293 | 348/18723 | 3.24e-05 | 2.68e-04 | 153 |
| GO:004214715 | Thyroid | ATC | retrograde transport, endosome to Golgi | 49/6293 | 91/18723 | 5.48e-05 | 4.23e-04 | 49 |
| GO:004354715 | Thyroid | ATC | positive regulation of GTPase activity | 106/6293 | 255/18723 | 4.58e-03 | 1.89e-02 | 106 |
| Page: 1 |
| Pathway ID | Tissue | Disease Stage | Description | Gene Ratio | Bg Ratio | pvalue | p.adjust | qvalue | Count |
| hsa04137210 | Esophagus | ESCC | Mitophagy - animal | 54/4205 | 72/8465 | 9.33e-06 | 4.96e-05 | 2.54e-05 | 54 |
| hsa0413738 | Esophagus | ESCC | Mitophagy - animal | 54/4205 | 72/8465 | 9.33e-06 | 4.96e-05 | 2.54e-05 | 54 |
| hsa0413728 | Oral cavity | OSCC | Mitophagy - animal | 58/3704 | 72/8465 | 1.48e-10 | 2.07e-09 | 1.05e-09 | 58 |
| hsa04137112 | Oral cavity | OSCC | Mitophagy - animal | 58/3704 | 72/8465 | 1.48e-10 | 2.07e-09 | 1.05e-09 | 58 |
| Page: 1 |
Top |
Cell-cell communication analysis |
| Identification of potential cell-cell interactions between two cell types and their ligand-receptor pairs for different disease states |
| Ligand | Receptor | LRpair | Pathway | Tissue | Disease Stage |
| Page: 1 |
Top |
Single-cell gene regulatory network inference analysis |
| Find out the significant the regulons (TFs) and the target genes of each regulon across cell types for different disease states |
| TF | Cell Type | Tissue | Disease Stage | Target Gene | RSS | Regulon Activity |
| ∗The dot plots of a searched regulon are shown for all cell subpopulations in each disease state of each tissue based on the regulon specific score inferred using pySCENIC and by calculating the average expression. |
| Page: 1 |
Top |
Somatic mutation of malignant transformation related genes |
| Annotation of somatic variants for genes involved in malignant transformation |
| Hugo Symbol | Variant Class | Variant Classification | dbSNP RS | HGVSc | HGVSp | HGVSp Short | SWISSPROT | BIOTYPE | SIFT | PolyPhen | Tumor Sample Barcode | Tissue | Histology | Sex | Age | Stage | Therapy Types | Drugs | Outcome |
| TBC1D17 | SNV | Missense_Mutation | novel | c.1429C>T | p.Leu477Phe | p.L477F | Q9HA65 | protein_coding | tolerated(0.77) | benign(0.222) | TCGA-CG-4460-01 | Stomach | stomach adenocarcinoma | Female | >=65 | III/IV | Chemotherapy | capecitabine | PD |
| Page: 1 2 3 4 5 6 |
Top |
Related drugs of malignant transformation related genes |
| Identification of chemicals and drugs interact with genes involved in malignant transfromation |
| (DGIdb 4.0) |
| Entrez ID | Symbol | Category | Interaction Types | Drug Claim Name | Drug Name | PMIDs |
| Page: 1 |

Copyright 2023-Present -The University of Texas Health Science Center at Houston |