| Tissue | Expression Dynamics | Abbreviation |
| Colorectum (GSE201348) |  | FAP: Familial adenomatous polyposis |
| CRC: Colorectal cancer |
| Colorectum (HTA11) |  | AD: Adenomas |
| SER: Sessile serrated lesions |
| MSI-H: Microsatellite-high colorectal cancer |
| MSS: Microsatellite stable colorectal cancer |
| Esophagus | 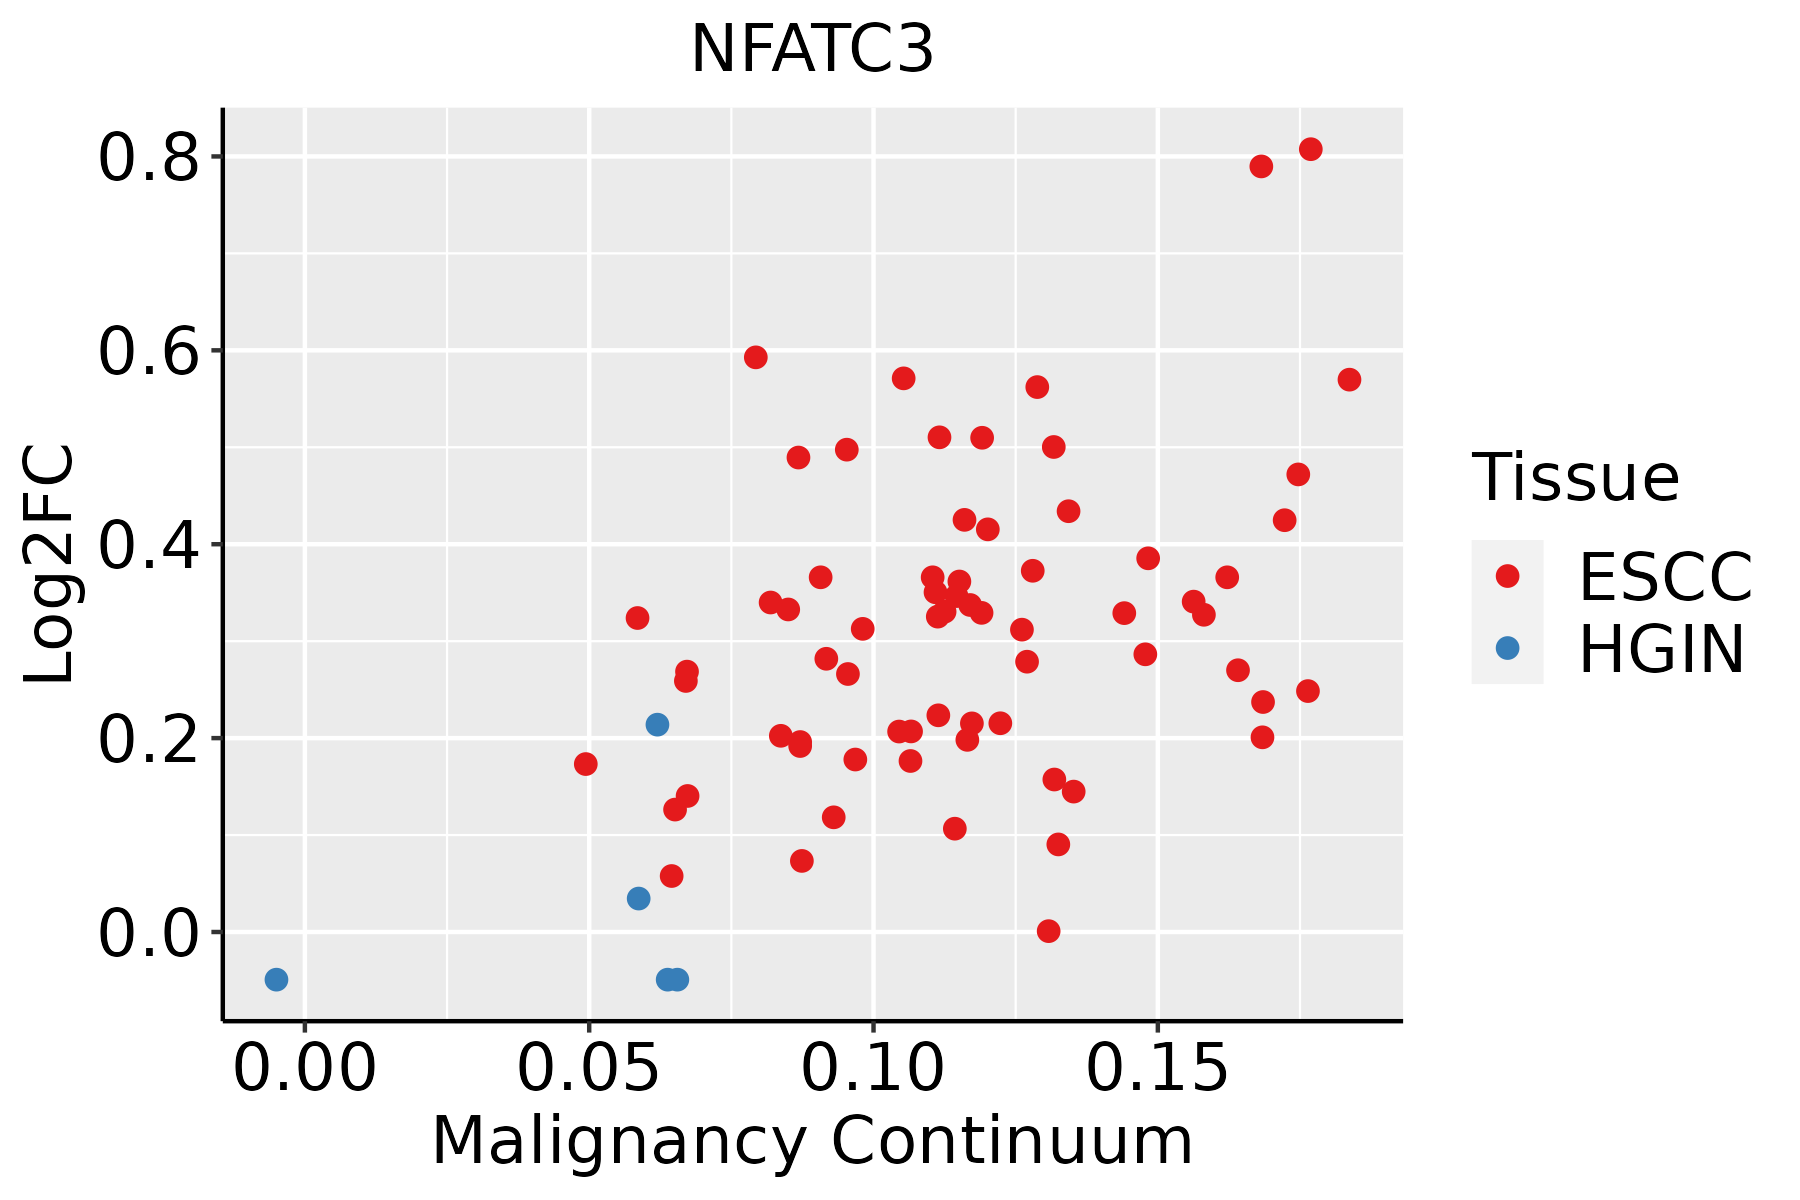 | ESCC: Esophageal squamous cell carcinoma |
| HGIN: High-grade intraepithelial neoplasias |
| LGIN: Low-grade intraepithelial neoplasias |
| Liver |  | HCC: Hepatocellular carcinoma |
| NAFLD: Non-alcoholic fatty liver disease |
| Lung |  | AAH: Atypical adenomatous hyperplasia |
| AIS: Adenocarcinoma in situ |
| IAC: Invasive lung adenocarcinoma |
| MIA: Minimally invasive adenocarcinoma |
| Oral Cavity | 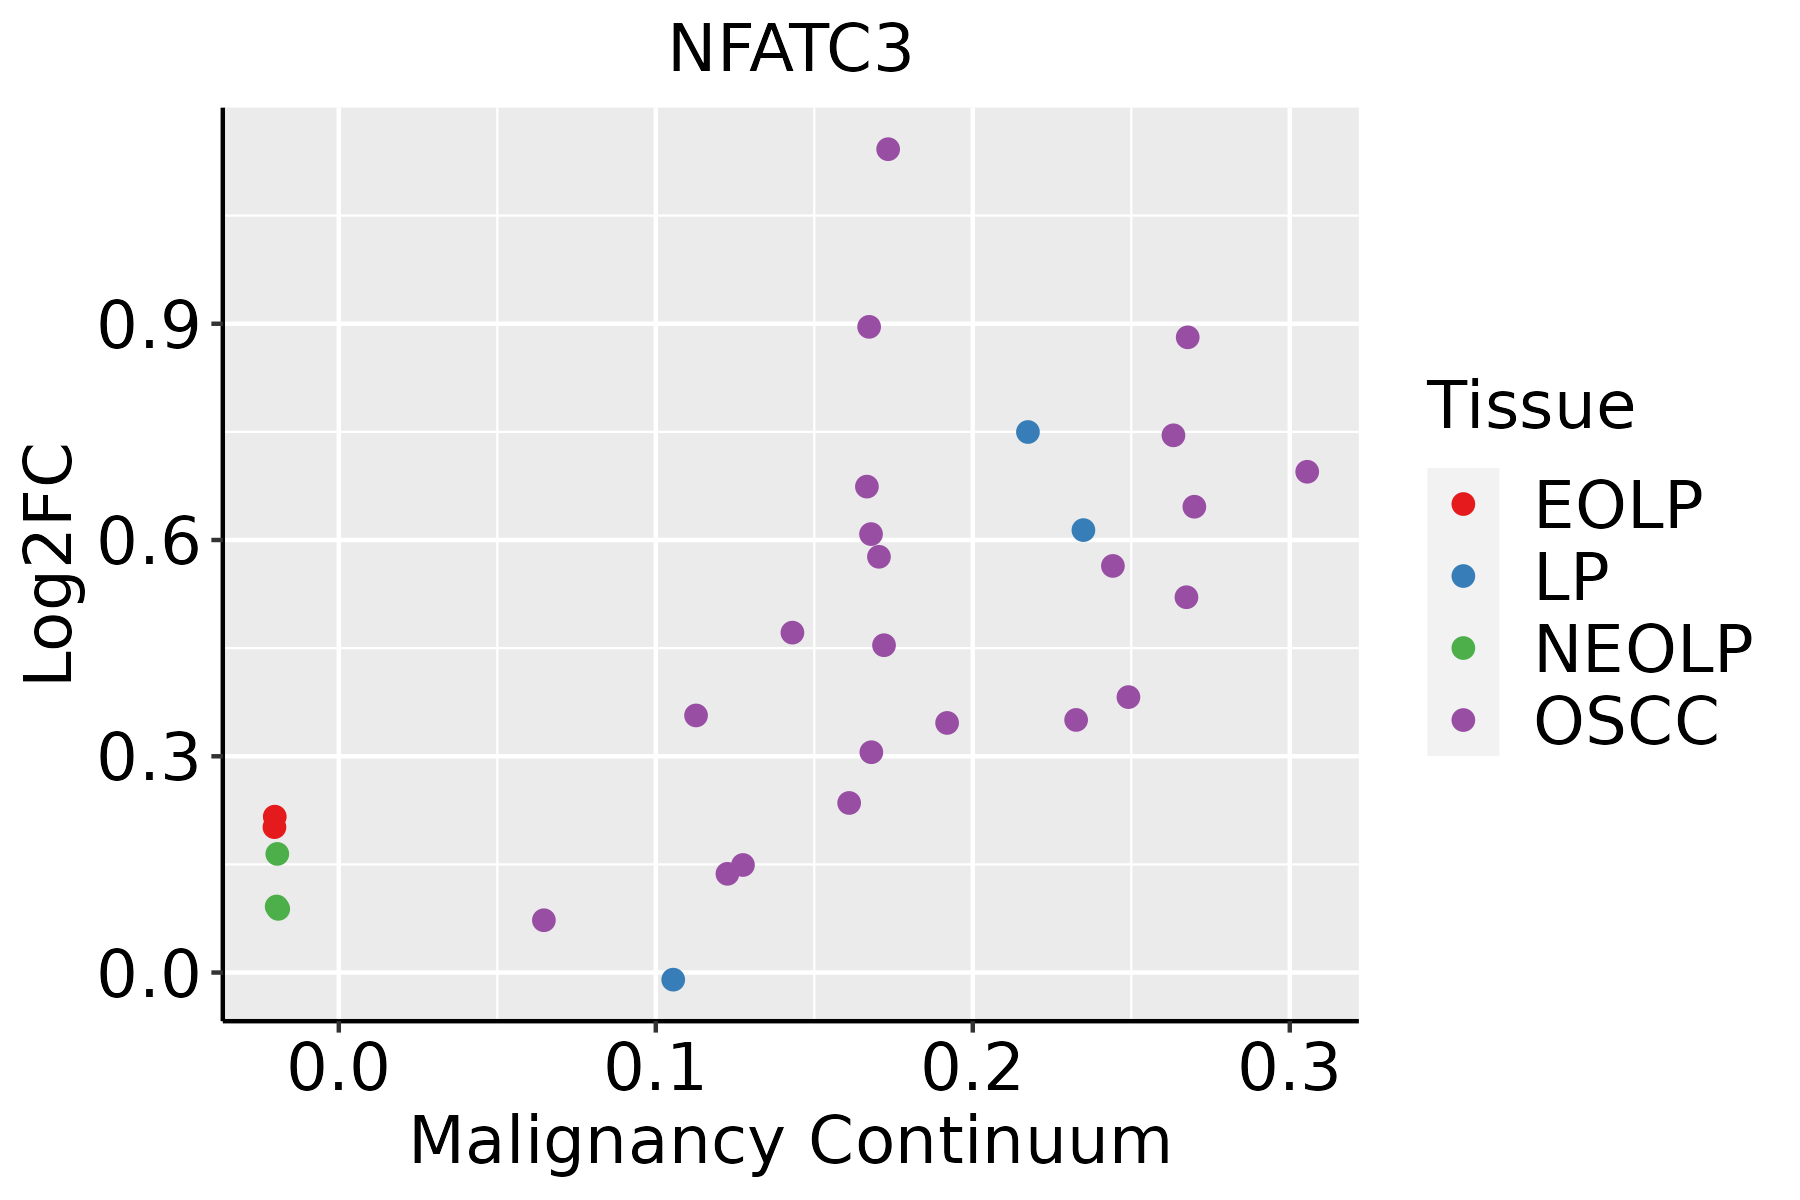 | EOLP: Erosive Oral lichen planus |
| LP: leukoplakia |
| NEOLP: Non-erosive oral lichen planus |
| OSCC: Oral squamous cell carcinoma |
| Prostate |  | BPH: Benign Prostatic Hyperplasia |
| Skin |  | AK: Actinic keratosis |
| cSCC: Cutaneous squamous cell carcinoma |
| SCCIS:squamous cell carcinoma in situ |
| Thyroid | 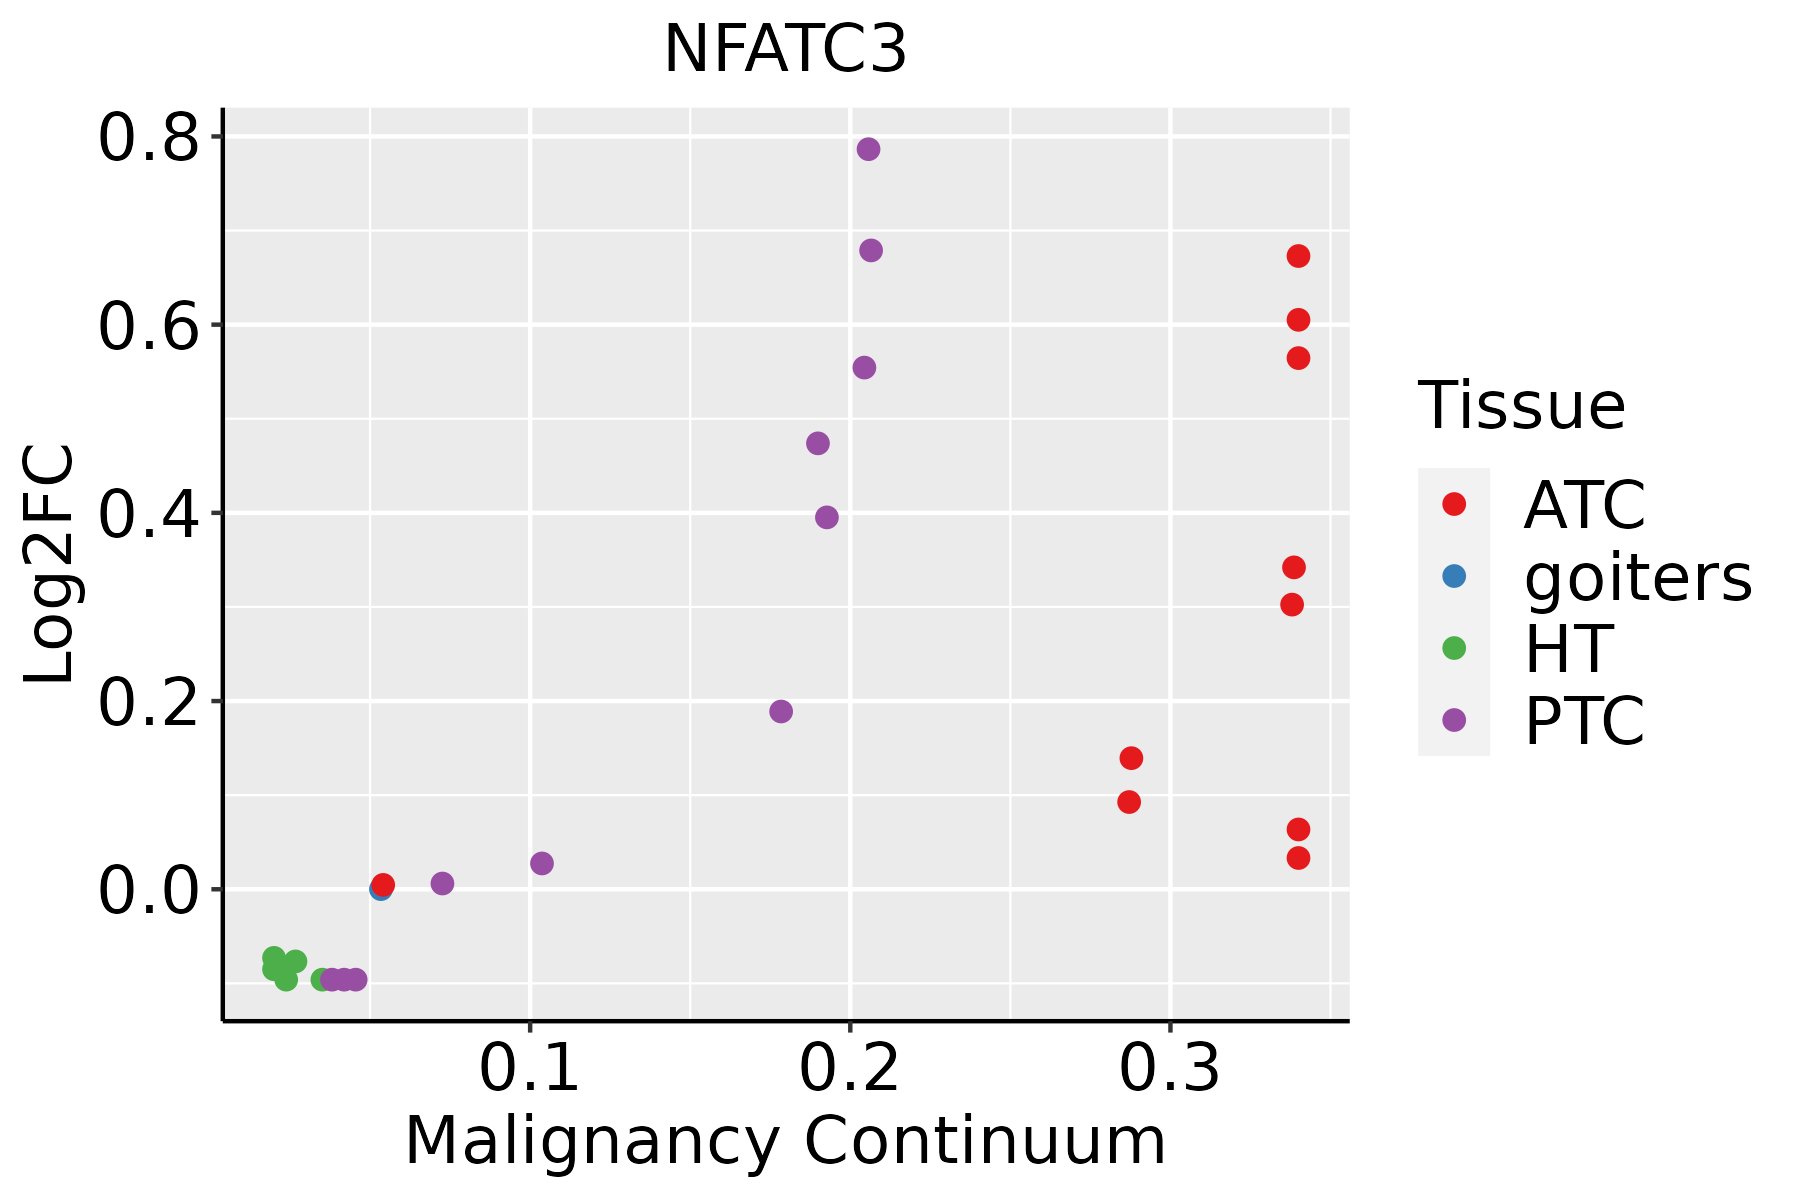 | ATC: Anaplastic thyroid cancer |
| HT: Hashimoto's thyroiditis |
| PTC: Papillary thyroid cancer |
| GO ID | Tissue | Disease Stage | Description | Gene Ratio | Bg Ratio | pvalue | p.adjust | Count |
| GO:0061614 | Colorectum | AD | pri-miRNA transcription by RNA polymerase II | 24/3918 | 55/18723 | 1.22e-04 | 1.78e-03 | 24 |
| GO:1902893 | Colorectum | AD | regulation of pri-miRNA transcription by RNA polymerase II | 23/3918 | 54/18723 | 2.60e-04 | 3.25e-03 | 23 |
| GO:00616142 | Colorectum | MSS | pri-miRNA transcription by RNA polymerase II | 19/3467 | 55/18723 | 3.47e-03 | 2.59e-02 | 19 |
| GO:19028932 | Colorectum | MSS | regulation of pri-miRNA transcription by RNA polymerase II | 18/3467 | 54/18723 | 6.70e-03 | 4.38e-02 | 18 |
| GO:00616143 | Colorectum | FAP | pri-miRNA transcription by RNA polymerase II | 21/2622 | 55/18723 | 7.50e-06 | 2.25e-04 | 21 |
| GO:19028933 | Colorectum | FAP | regulation of pri-miRNA transcription by RNA polymerase II | 20/2622 | 54/18723 | 2.09e-05 | 5.05e-04 | 20 |
| GO:0048016 | Colorectum | FAP | inositol phosphate-mediated signaling | 16/2622 | 55/18723 | 2.78e-03 | 2.15e-02 | 16 |
| GO:1902894 | Colorectum | FAP | negative regulation of pri-miRNA transcription by RNA polymerase II | 7/2622 | 17/18723 | 5.62e-03 | 3.61e-02 | 7 |
| GO:00616144 | Colorectum | CRC | pri-miRNA transcription by RNA polymerase II | 18/2078 | 55/18723 | 1.53e-05 | 4.70e-04 | 18 |
| GO:19028934 | Colorectum | CRC | regulation of pri-miRNA transcription by RNA polymerase II | 17/2078 | 54/18723 | 4.62e-05 | 1.10e-03 | 17 |
| GO:19028941 | Colorectum | CRC | negative regulation of pri-miRNA transcription by RNA polymerase II | 7/2078 | 17/18723 | 1.46e-03 | 1.57e-02 | 7 |
| GO:0097720 | Colorectum | CRC | calcineurin-mediated signaling | 13/2078 | 48/18723 | 1.72e-03 | 1.77e-02 | 13 |
| GO:0033173 | Colorectum | CRC | calcineurin-NFAT signaling cascade | 12/2078 | 43/18723 | 1.93e-03 | 1.96e-02 | 12 |
| GO:00480161 | Colorectum | CRC | inositol phosphate-mediated signaling | 14/2078 | 55/18723 | 2.21e-03 | 2.15e-02 | 14 |
| GO:00616146 | Liver | NAFLD | pri-miRNA transcription by RNA polymerase II | 13/1882 | 55/18723 | 2.64e-03 | 2.42e-02 | 13 |
| GO:19028936 | Liver | NAFLD | regulation of pri-miRNA transcription by RNA polymerase II | 12/1882 | 54/18723 | 6.44e-03 | 4.69e-02 | 12 |
| GO:006161412 | Liver | Cirrhotic | pri-miRNA transcription by RNA polymerase II | 22/4634 | 55/18723 | 8.94e-03 | 4.12e-02 | 22 |
| GO:006161422 | Liver | HCC | pri-miRNA transcription by RNA polymerase II | 35/7958 | 55/18723 | 1.26e-03 | 6.92e-03 | 35 |
| GO:190289312 | Liver | HCC | regulation of pri-miRNA transcription by RNA polymerase II | 34/7958 | 54/18723 | 1.92e-03 | 9.78e-03 | 34 |
| GO:19028942 | Liver | HCC | negative regulation of pri-miRNA transcription by RNA polymerase II | 13/7958 | 17/18723 | 4.77e-03 | 2.02e-02 | 13 |
| Pathway ID | Tissue | Disease Stage | Description | Gene Ratio | Bg Ratio | pvalue | p.adjust | qvalue | Count |
| hsa05135 | Colorectum | AD | Yersinia infection | 58/2092 | 137/8465 | 3.90e-06 | 4.35e-05 | 2.78e-05 | 58 |
| hsa05417 | Colorectum | AD | Lipid and atherosclerosis | 73/2092 | 215/8465 | 1.31e-03 | 8.27e-03 | 5.27e-03 | 73 |
| hsa05170 | Colorectum | AD | Human immunodeficiency virus 1 infection | 72/2092 | 212/8465 | 1.40e-03 | 8.46e-03 | 5.39e-03 | 72 |
| hsa05163 | Colorectum | AD | Human cytomegalovirus infection | 75/2092 | 225/8465 | 2.00e-03 | 1.10e-02 | 7.01e-03 | 75 |
| hsa04360 | Colorectum | AD | Axon guidance | 61/2092 | 182/8465 | 4.36e-03 | 2.17e-02 | 1.38e-02 | 61 |
| hsa05166 | Colorectum | AD | Human T-cell leukemia virus 1 infection | 72/2092 | 222/8465 | 5.24e-03 | 2.44e-02 | 1.55e-02 | 72 |
| hsa04218 | Colorectum | AD | Cellular senescence | 53/2092 | 156/8465 | 5.55e-03 | 2.48e-02 | 1.58e-02 | 53 |
| hsa04310 | Colorectum | AD | Wnt signaling pathway | 56/2092 | 171/8465 | 1.03e-02 | 3.93e-02 | 2.51e-02 | 56 |
| hsa051351 | Colorectum | AD | Yersinia infection | 58/2092 | 137/8465 | 3.90e-06 | 4.35e-05 | 2.78e-05 | 58 |
| hsa054171 | Colorectum | AD | Lipid and atherosclerosis | 73/2092 | 215/8465 | 1.31e-03 | 8.27e-03 | 5.27e-03 | 73 |
| hsa051701 | Colorectum | AD | Human immunodeficiency virus 1 infection | 72/2092 | 212/8465 | 1.40e-03 | 8.46e-03 | 5.39e-03 | 72 |
| hsa051631 | Colorectum | AD | Human cytomegalovirus infection | 75/2092 | 225/8465 | 2.00e-03 | 1.10e-02 | 7.01e-03 | 75 |
| hsa043601 | Colorectum | AD | Axon guidance | 61/2092 | 182/8465 | 4.36e-03 | 2.17e-02 | 1.38e-02 | 61 |
| hsa051661 | Colorectum | AD | Human T-cell leukemia virus 1 infection | 72/2092 | 222/8465 | 5.24e-03 | 2.44e-02 | 1.55e-02 | 72 |
| hsa042181 | Colorectum | AD | Cellular senescence | 53/2092 | 156/8465 | 5.55e-03 | 2.48e-02 | 1.58e-02 | 53 |
| hsa043101 | Colorectum | AD | Wnt signaling pathway | 56/2092 | 171/8465 | 1.03e-02 | 3.93e-02 | 2.51e-02 | 56 |
| hsa051354 | Colorectum | MSS | Yersinia infection | 53/1875 | 137/8465 | 7.73e-06 | 8.93e-05 | 5.47e-05 | 53 |
| hsa051634 | Colorectum | MSS | Human cytomegalovirus infection | 74/1875 | 225/8465 | 1.12e-04 | 1.01e-03 | 6.19e-04 | 74 |
| hsa054174 | Colorectum | MSS | Lipid and atherosclerosis | 70/1875 | 215/8465 | 2.38e-04 | 1.81e-03 | 1.11e-03 | 70 |
| hsa051704 | Colorectum | MSS | Human immunodeficiency virus 1 infection | 69/1875 | 212/8465 | 2.66e-04 | 1.98e-03 | 1.21e-03 | 69 |
| TF | Cell Type | Tissue | Disease Stage | Target Gene | RSS | Regulon Activity |
| NFATC3 | MAST | Colorectum | AD | RPS6KA5,UBA6-AS1,PRELID2, etc. | 2.43e-01 |  |
| NFATC3 | TH1 | Endometrium | ADJ | SMAGP,AC006064.2,S1PR1, etc. | 8.94e-03 |  |
| NFATC3 | CD8TEFF | Endometrium | Healthy | SMAGP,AC006064.2,S1PR1, etc. | 2.68e-02 |  |
| NFATC3 | BMEM | Endometrium | Healthy | SMAGP,AC006064.2,S1PR1, etc. | 1.43e-01 | |
| NFATC3 | BMEM | Liver | NAFLD | ZSCAN5A,AC116366.3,BICRAL, etc. | 9.23e-02 |  |
| NFATC3 | AT1 | Lung | Healthy | HAX1,CLDN18,ADIRF, etc. | 1.30e-01 |  |
| NFATC3 | NK | Lung | IAC | BRWD3,TMEM14A,SBNO1, etc. | 4.77e-02 |  |
| NFATC3 | CD4TN | Lung | IAC | BRWD3,TMEM14A,SBNO1, etc. | 2.11e-01 | |
| NFATC3 | CD8TEFF | Lung | MIAC | PPM1D,SAMD3,CCND3, etc. | 9.86e-02 |  |
| NFATC3 | CD8TCM | Lung | MIAC | PPM1D,SAMD3,CCND3, etc. | 3.66e-02 | |
| Hugo Symbol | Variant Class | Variant Classification | dbSNP RS | HGVSc | HGVSp | HGVSp Short | SWISSPROT | BIOTYPE | SIFT | PolyPhen | Tumor Sample Barcode | Tissue | Histology | Sex | Age | Stage | Therapy Types | Drugs | Outcome |
| NFATC3 | SNV | Missense_Mutation | novel | c.2051N>G | p.Asn684Ser | p.N684S | Q12968 | protein_coding | deleterious(0.01) | benign(0.121) | TCGA-D1-A1O7-01 | Endometrium | uterine corpus endometrioid carcinoma | Female | <65 | I/II | Unknown | Unknown | SD |
| NFATC3 | SNV | Missense_Mutation | novel | c.1954N>G | p.Arg652Gly | p.R652G | Q12968 | protein_coding | tolerated(0.12) | benign(0.033) | TCGA-DF-A2KN-01 | Endometrium | uterine corpus endometrioid carcinoma | Female | Unknown | I/II | Unknown | Unknown | SD |
| NFATC3 | SNV | Missense_Mutation | novel | c.1738N>T | p.Leu580Phe | p.L580F | Q12968 | protein_coding | deleterious(0) | probably_damaging(0.999) | TCGA-DF-A2KU-01 | Endometrium | uterine corpus endometrioid carcinoma | Female | Unknown | I/II | Unknown | Unknown | SD |
| NFATC3 | SNV | Missense_Mutation | novel | c.1451N>T | p.Thr484Ile | p.T484I | Q12968 | protein_coding | deleterious(0) | probably_damaging(1) | TCGA-EC-A24G-01 | Endometrium | uterine corpus endometrioid carcinoma | Female | <65 | I/II | Chemotherapy | doxorubicin | SD |
| NFATC3 | SNV | Missense_Mutation | novel | c.1528A>G | p.Ser510Gly | p.S510G | Q12968 | protein_coding | deleterious(0) | probably_damaging(0.995) | TCGA-EO-A22R-01 | Endometrium | uterine corpus endometrioid carcinoma | Female | <65 | I/II | Unknown | Unknown | SD |
| NFATC3 | SNV | Missense_Mutation | novel | c.1705N>T | p.Arg569Cys | p.R569C | Q12968 | protein_coding | deleterious(0) | probably_damaging(1) | TCGA-EO-A22U-01 | Endometrium | uterine corpus endometrioid carcinoma | Female | >=65 | I/II | Unknown | Unknown | SD |
| NFATC3 | SNV | Missense_Mutation | novel | c.1799N>T | p.Pro600Leu | p.P600L | Q12968 | protein_coding | deleterious(0) | probably_damaging(0.933) | TCGA-EO-A3KX-01 | Endometrium | uterine corpus endometrioid carcinoma | Female | >=65 | I/II | Unknown | Unknown | SD |
| NFATC3 | deletion | Frame_Shift_Del | novel | c.1958delN | p.Lys654AsnfsTer48 | p.K654Nfs*48 | Q12968 | protein_coding | | | TCGA-D1-A1NS-01 | Endometrium | uterine corpus endometrioid carcinoma | Female | <65 | I/II | Unknown | Unknown | SD |
| NFATC3 | SNV | Missense_Mutation | | c.2194N>C | p.Asp732His | p.D732H | Q12968 | protein_coding | deleterious(0) | benign(0.417) | TCGA-BC-A112-01 | Liver | liver hepatocellular carcinoma | Male | >=65 | III/IV | Unknown | Unknown | SD |
| NFATC3 | SNV | Missense_Mutation | novel | c.1276G>T | p.Ala426Ser | p.A426S | Q12968 | protein_coding | tolerated(1) | benign(0) | TCGA-DD-AAC9-01 | Liver | liver hepatocellular carcinoma | Male | <65 | I/II | Unknown | Unknown | SD |


