
|
|||||
|
 | |
| |
| |
| |
| |
| |
|
Gene: LDB3 |
Gene summary for LDB3 |
| Gene information | Species | Human | Gene symbol | LDB3 | Gene ID | 11155 |
| Gene name | LIM domain binding 3 | |
| Gene Alias | CMD1C | |
| Cytomap | 10q23.2 | |
| Gene Type | protein-coding | GO ID | GO:0006996 | UniProtAcc | O75112 |
Top |
Malignant transformation analysis |
| Identification of the aberrant gene expression in precancerous and cancerous lesions by comparing the gene expression of stem-like cells in diseased tissues with normal stem cells |
| Entrez ID | Symbol | Replicates | Species | Organ | Tissue | Adj P-value | Log2FC | Malignancy |
| 11155 | LDB3 | HCC1 | Human | Liver | HCC | 2.10e-06 | 5.47e-01 | 0.5336 |
| 11155 | LDB3 | HCC2 | Human | Liver | HCC | 2.08e-08 | 4.60e-01 | 0.5341 |
| 11155 | LDB3 | HCC5 | Human | Liver | HCC | 1.23e-09 | 7.44e-01 | 0.4932 |
| Page: 1 |
| Tissue | Expression Dynamics | Abbreviation |
| Liver | 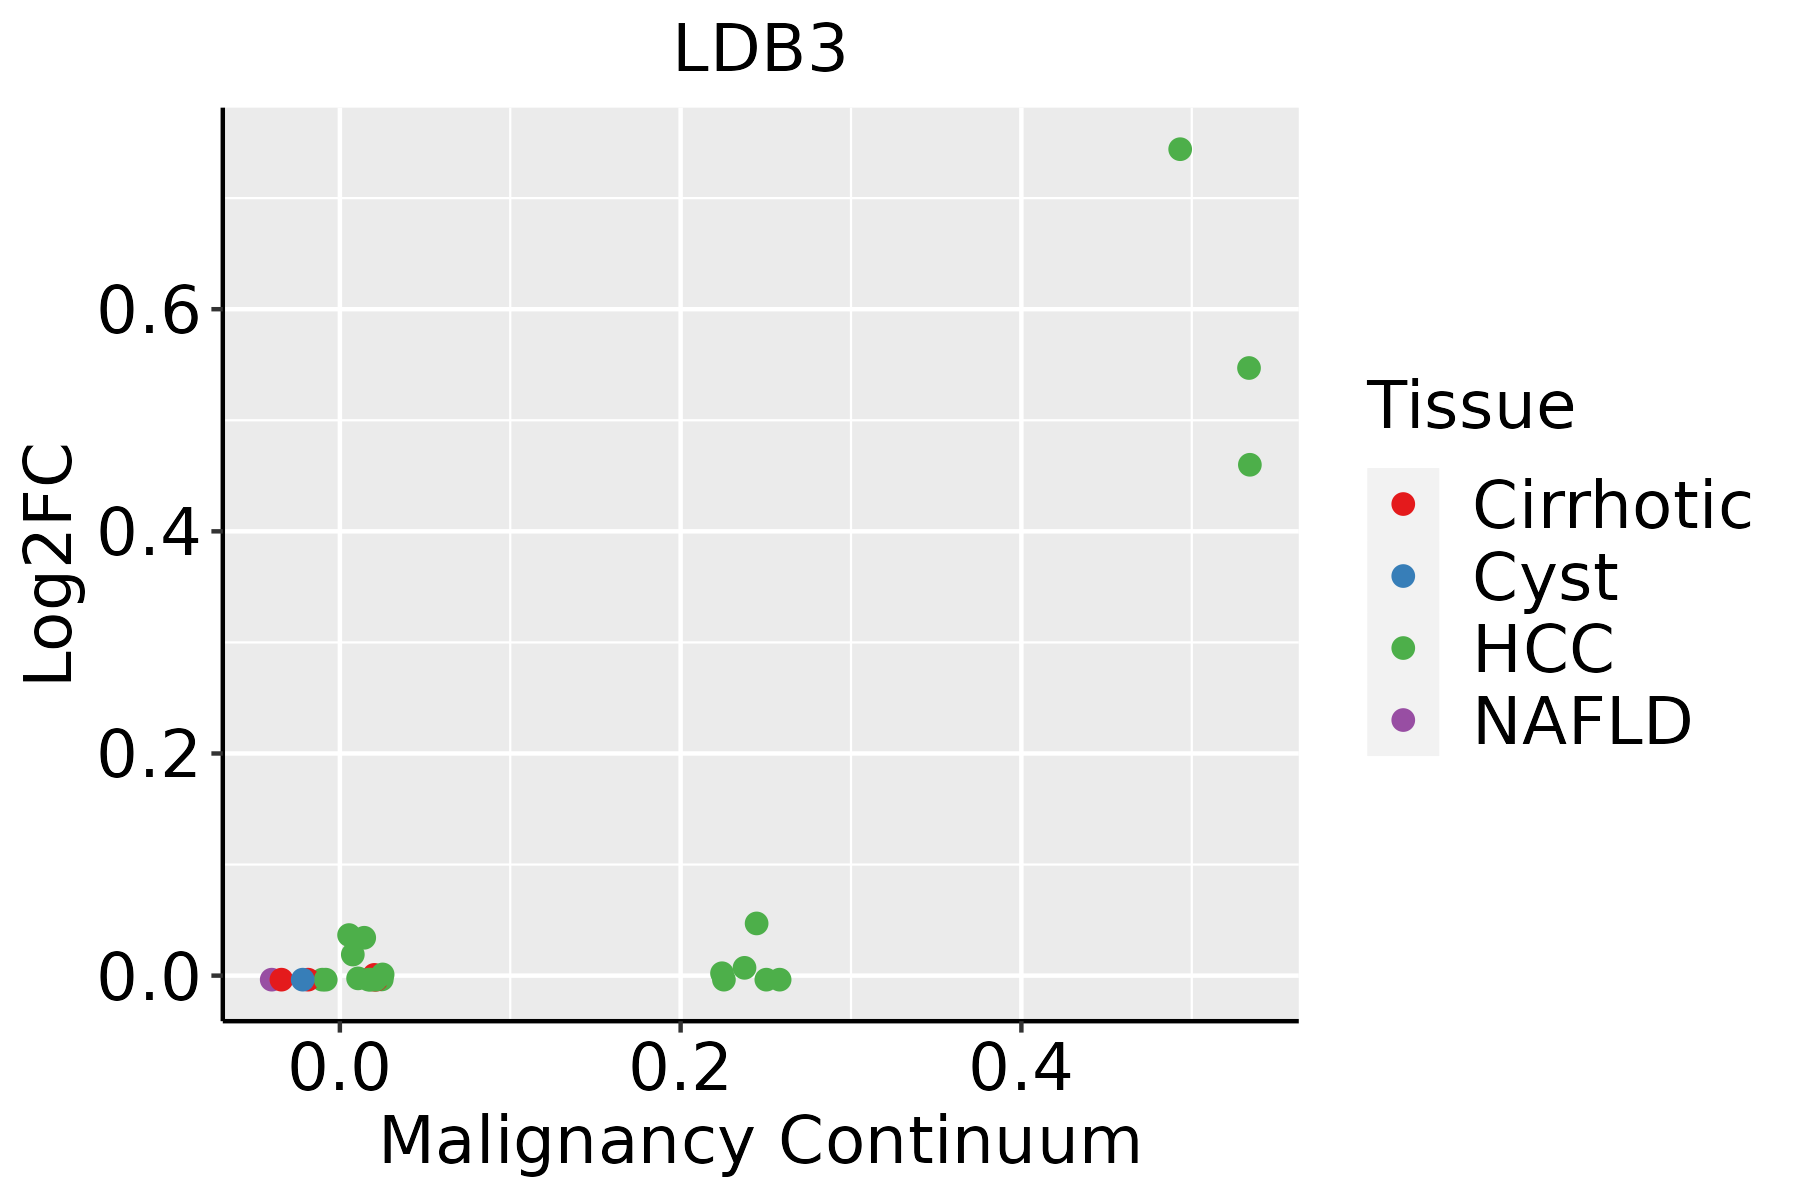 | HCC: Hepatocellular carcinoma |
| NAFLD: Non-alcoholic fatty liver disease |
| ∗log2FC in expression of this searched gene in stem-like cells from each diseased tissue sample relative to stem-like cells in normal samples in each tissue plotted against the malignancy continuum. Samples are colored based on if they are from different disease stage. |
Top |
Malignant transformation related pathway analysis |
| Find out the enriched GO biological processes and KEGG pathways involved in transition from healthy to precancer to cancer |
| Tissue | Disease Stage | Enriched GO biological Processes |
| Colorectum | AD |  |
| Colorectum | SER |  |
| Colorectum | MSS |  |
| Colorectum | MSI-H |  |
| Colorectum | FAP |  |
| ∗Top 15 enriched GO BP terms are showed in the bar plot of each disease state in each tissue. Each row represents a significant GO biological process which is colored according to the -log10(p.adjust). |
| Page: 1 2 3 4 5 6 7 8 9 |
| GO ID | Tissue | Disease Stage | Description | Gene Ratio | Bg Ratio | pvalue | p.adjust | Count |
| GO:003103222 | Liver | HCC | actomyosin structure organization | 109/7958 | 196/18723 | 1.39e-04 | 1.13e-03 | 109 |
| Page: 1 |
| Pathway ID | Tissue | Disease Stage | Description | Gene Ratio | Bg Ratio | pvalue | p.adjust | qvalue | Count |
| Page: 1 |
Top |
Cell-cell communication analysis |
| Identification of potential cell-cell interactions between two cell types and their ligand-receptor pairs for different disease states |
| Ligand | Receptor | LRpair | Pathway | Tissue | Disease Stage |
| Page: 1 |
Top |
Single-cell gene regulatory network inference analysis |
| Find out the significant the regulons (TFs) and the target genes of each regulon across cell types for different disease states |
| TF | Cell Type | Tissue | Disease Stage | Target Gene | RSS | Regulon Activity |
| ∗The dot plots of a searched regulon are shown for all cell subpopulations in each disease state of each tissue based on the regulon specific score inferred using pySCENIC and by calculating the average expression. |
| Page: 1 |
Top |
Somatic mutation of malignant transformation related genes |
| Annotation of somatic variants for genes involved in malignant transformation |
| Hugo Symbol | Variant Class | Variant Classification | dbSNP RS | HGVSc | HGVSp | HGVSp Short | SWISSPROT | BIOTYPE | SIFT | PolyPhen | Tumor Sample Barcode | Tissue | Histology | Sex | Age | Stage | Therapy Types | Drugs | Outcome |
| LDB3 | SNV | Missense_Mutation | rs769156627 | c.1718N>A | p.Arg573His | p.R573H | O75112 | protein_coding | deleterious(0) | probably_damaging(0.989) | TCGA-FI-A2D0-01 | Endometrium | uterine corpus endometrioid carcinoma | Female | <65 | I/II | Unknown | Unknown | SD |
| LDB3 | deletion | Frame_Shift_Del | novel | c.54delN | p.Gly20AlafsTer41 | p.G20Afs*41 | O75112 | protein_coding | TCGA-D1-A17D-01 | Endometrium | uterine corpus endometrioid carcinoma | Female | <65 | I/II | Chemotherapy | carboplatin | SD | ||
| LDB3 | deletion | Frame_Shift_Del | c.1416delC | p.Asn473ThrfsTer24 | p.N473Tfs*24 | O75112 | protein_coding | TCGA-EY-A2OM-01 | Endometrium | uterine corpus endometrioid carcinoma | Female | <65 | I/II | Chemotherapy | taxol | SD | |||
| LDB3 | deletion | Frame_Shift_Del | c.1617delG | p.Thr540ProfsTer30 | p.T540Pfs*30 | O75112 | protein_coding | TCGA-EY-A2OP-01 | Endometrium | uterine corpus endometrioid carcinoma | Female | <65 | I/II | Unknown | Unknown | SD | |||
| LDB3 | deletion | Frame_Shift_Del | c.1356delC | p.Ser453HisfsTer44 | p.S453Hfs*44 | O75112 | protein_coding | TCGA-EY-A5W2-01 | Endometrium | uterine corpus endometrioid carcinoma | Female | >=65 | I/II | Unknown | Unknown | SD | |||
| LDB3 | SNV | Missense_Mutation | c.406C>A | p.Pro136Thr | p.P136T | O75112 | protein_coding | tolerated(0.37) | benign(0) | TCGA-CC-A7IH-01 | Liver | liver hepatocellular carcinoma | Male | <65 | III/IV | Unknown | Unknown | SD | |
| LDB3 | SNV | Missense_Mutation | novel | c.29N>A | p.Pro10His | p.P10H | O75112 | protein_coding | deleterious(0) | probably_damaging(1) | TCGA-DD-AADR-01 | Liver | liver hepatocellular carcinoma | Male | <65 | I/II | Unknown | Unknown | PD |
| LDB3 | SNV | Missense_Mutation | c.1066N>A | p.Gln356Lys | p.Q356K | O75112 | protein_coding | tolerated(0.08) | benign(0.06) | TCGA-K7-A5RG-01 | Liver | liver hepatocellular carcinoma | Male | >=65 | I/II | Unknown | Unknown | SD | |
| LDB3 | SNV | Missense_Mutation | c.976G>C | p.Asp326His | p.D326H | O75112 | protein_coding | tolerated(0.14) | benign(0.005) | TCGA-44-8120-01 | Lung | lung adenocarcinoma | Male | <65 | I/II | Unknown | Unknown | SD | |
| LDB3 | SNV | Missense_Mutation | c.1390C>A | p.Pro464Thr | p.P464T | O75112 | protein_coding | tolerated(0.24) | benign(0.11) | TCGA-55-6969-01 | Lung | lung adenocarcinoma | Male | <65 | I/II | Unknown | Unknown | SD |
| Page: 1 2 3 4 5 6 7 8 9 |
Top |
Related drugs of malignant transformation related genes |
| Identification of chemicals and drugs interact with genes involved in malignant transfromation |
| (DGIdb 4.0) |
| Entrez ID | Symbol | Category | Interaction Types | Drug Claim Name | Drug Name | PMIDs |
| Page: 1 |

Copyright 2023-Present -The University of Texas Health Science Center at Houston |