
|
|||||
|
 | |
| |
| |
| |
| |
| |
|
Gene: KRT4 |
Gene summary for KRT4 |
| Gene information | Species | Human | Gene symbol | KRT4 | Gene ID | 3851 |
| Gene name | keratin 4 | |
| Gene Alias | CK-4 | |
| Cytomap | 12q13.13 | |
| Gene Type | protein-coding | GO ID | GO:0006996 | UniProtAcc | B4DRS2 |
Top |
Malignant transformation analysis |
| Identification of the aberrant gene expression in precancerous and cancerous lesions by comparing the gene expression of stem-like cells in diseased tissues with normal stem cells |
| Entrez ID | Symbol | Replicates | Species | Organ | Tissue | Adj P-value | Log2FC | Malignancy |
| 3851 | KRT4 | LZE2T | Human | Esophagus | ESCC | 4.73e-03 | 9.77e-01 | 0.082 |
| 3851 | KRT4 | LZE5T | Human | Esophagus | ESCC | 9.25e-35 | 3.23e+00 | 0.0514 |
| 3851 | KRT4 | LZE20T | Human | Esophagus | ESCC | 8.74e-18 | 2.42e+00 | 0.0662 |
| 3851 | KRT4 | LZE22D1 | Human | Esophagus | HGIN | 1.03e-15 | 9.44e-01 | 0.0595 |
| 3851 | KRT4 | LZE22T | Human | Esophagus | ESCC | 1.00e-09 | 1.47e+00 | 0.068 |
| 3851 | KRT4 | LZE24T | Human | Esophagus | ESCC | 8.20e-87 | 5.41e+00 | 0.0596 |
| 3851 | KRT4 | P8T-E | Human | Esophagus | ESCC | 4.41e-92 | 3.25e+00 | 0.0889 |
| 3851 | KRT4 | P15T-E | Human | Esophagus | ESCC | 5.26e-03 | 8.67e-01 | 0.1149 |
| 3851 | KRT4 | P23T-E | Human | Esophagus | ESCC | 1.14e-03 | 4.14e-01 | 0.108 |
| 3851 | KRT4 | P27T-E | Human | Esophagus | ESCC | 1.41e-02 | 1.75e-01 | 0.1055 |
| 3851 | KRT4 | P30T-E | Human | Esophagus | ESCC | 6.12e-09 | 9.05e-01 | 0.137 |
| 3851 | KRT4 | P31T-E | Human | Esophagus | ESCC | 1.08e-16 | 5.77e-01 | 0.1251 |
| 3851 | KRT4 | P54T-E | Human | Esophagus | ESCC | 2.11e-02 | 1.27e+00 | 0.0975 |
| 3851 | KRT4 | P62T-E | Human | Esophagus | ESCC | 5.56e-05 | 8.79e-01 | 0.1302 |
| 3851 | KRT4 | P65T-E | Human | Esophagus | ESCC | 6.37e-57 | 2.72e+00 | 0.0978 |
| 3851 | KRT4 | P74T-E | Human | Esophagus | ESCC | 1.20e-14 | 2.51e+00 | 0.1479 |
| 3851 | KRT4 | P75T-E | Human | Esophagus | ESCC | 5.39e-46 | 2.35e+00 | 0.1125 |
| 3851 | KRT4 | P80T-E | Human | Esophagus | ESCC | 4.88e-05 | 1.02e+00 | 0.155 |
| 3851 | KRT4 | P82T-E | Human | Esophagus | ESCC | 2.98e-07 | 1.21e+00 | 0.1072 |
| 3851 | KRT4 | P127T-E | Human | Esophagus | ESCC | 3.19e-68 | 2.81e+00 | 0.0826 |
| Page: 1 2 |
| Tissue | Expression Dynamics | Abbreviation |
| Esophagus | 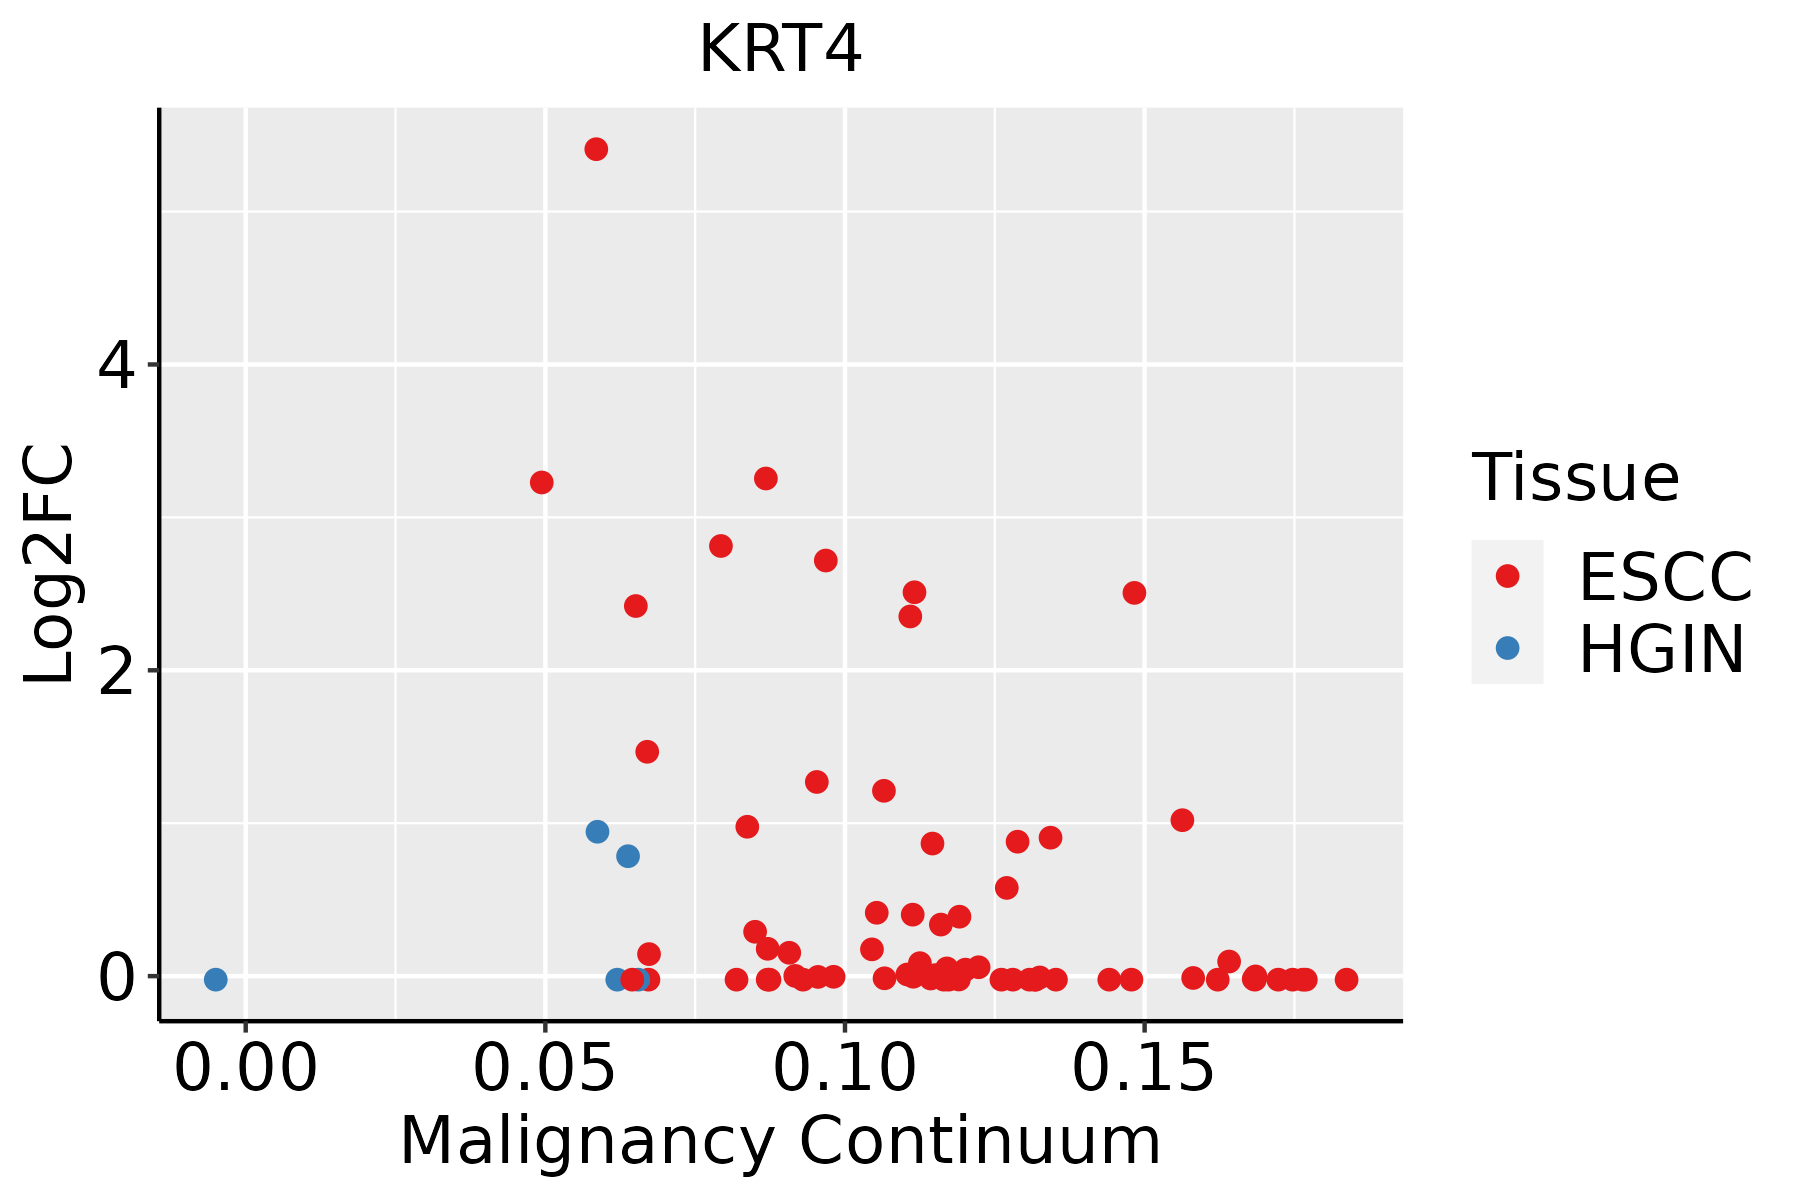 | ESCC: Esophageal squamous cell carcinoma |
| HGIN: High-grade intraepithelial neoplasias | ||
| LGIN: Low-grade intraepithelial neoplasias | ||
| Oral Cavity | 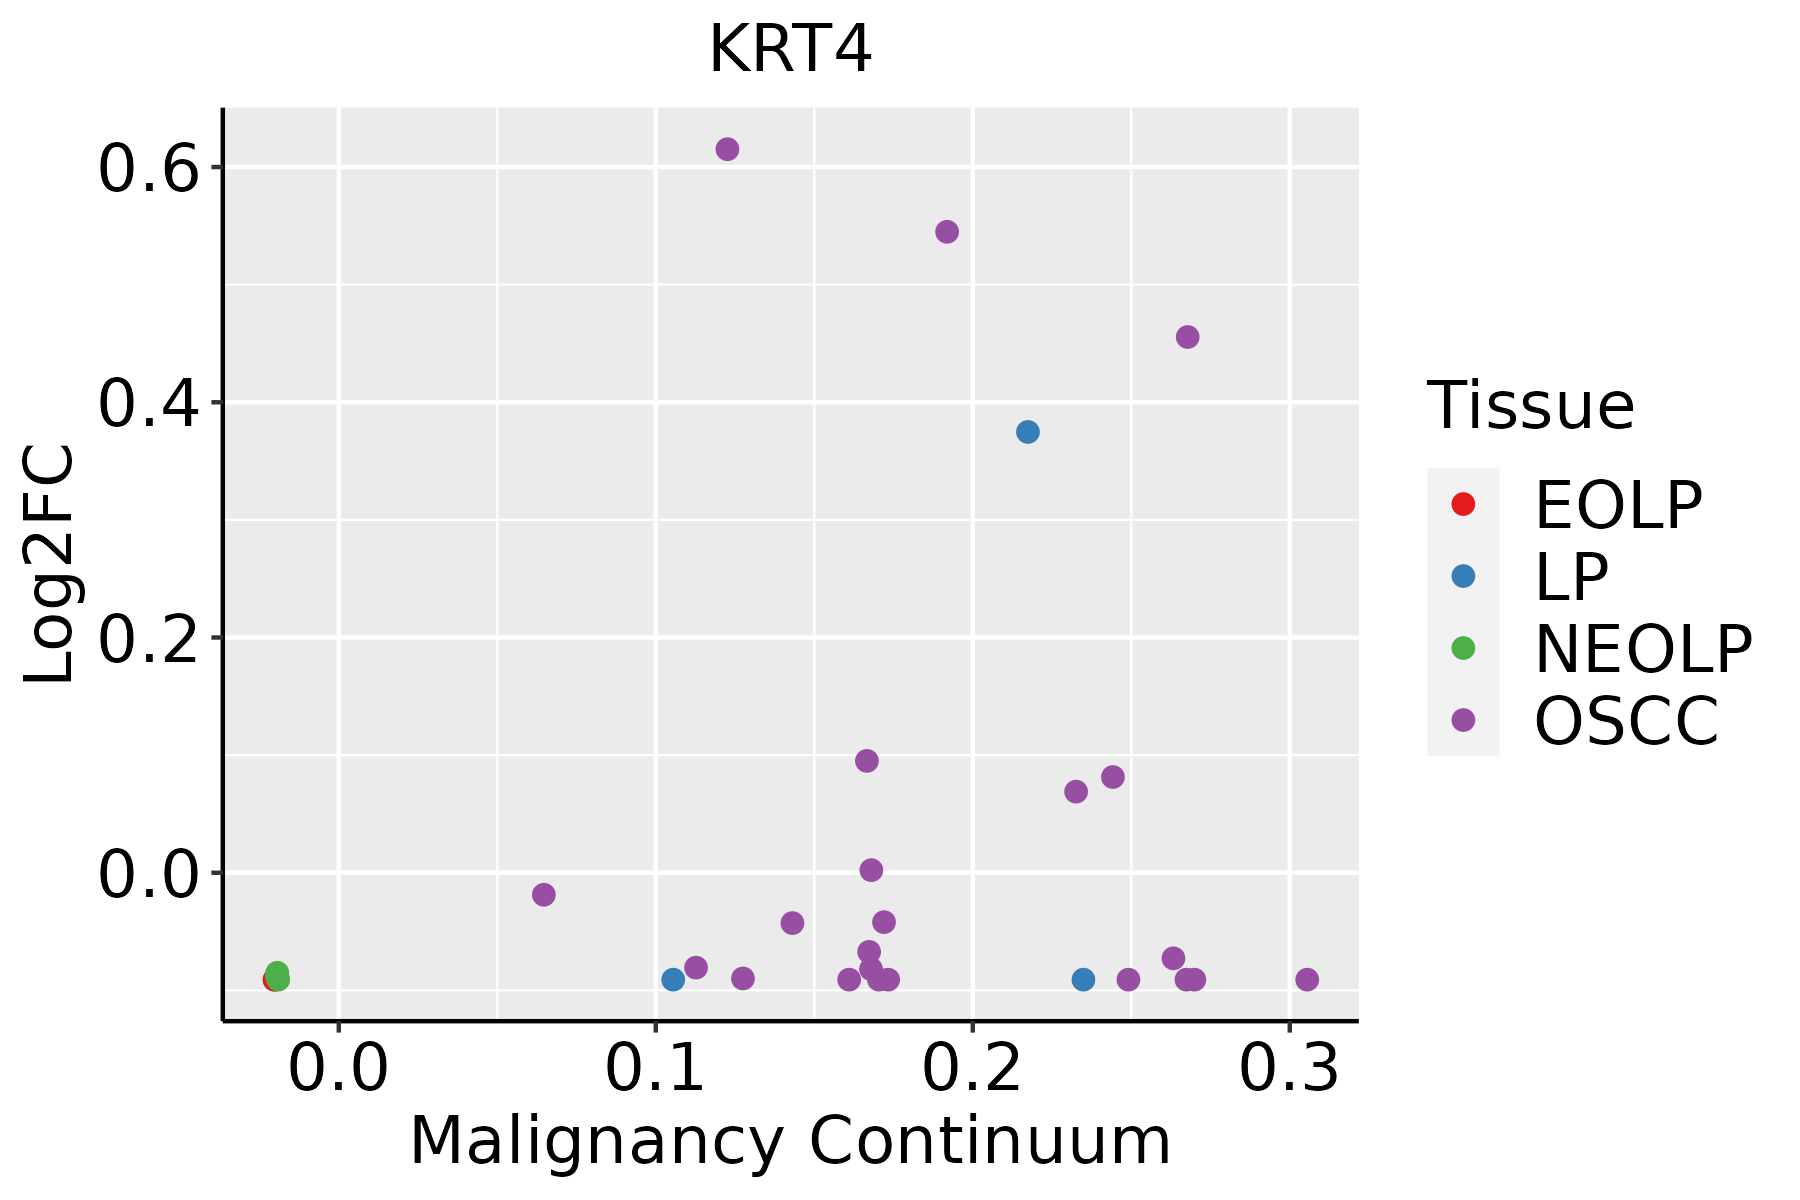 | EOLP: Erosive Oral lichen planus |
| LP: leukoplakia | ||
| NEOLP: Non-erosive oral lichen planus | ||
| OSCC: Oral squamous cell carcinoma |
| ∗log2FC in expression of this searched gene in stem-like cells from each diseased tissue sample relative to stem-like cells in normal samples in each tissue plotted against the malignancy continuum. Samples are colored based on if they are from different disease stage. |
Top |
Malignant transformation related pathway analysis |
| Find out the enriched GO biological processes and KEGG pathways involved in transition from healthy to precancer to cancer |
| Tissue | Disease Stage | Enriched GO biological Processes |
| Colorectum | AD |  |
| Colorectum | SER |  |
| Colorectum | MSS |  |
| Colorectum | MSI-H |  |
| Colorectum | FAP |  |
| ∗Top 15 enriched GO BP terms are showed in the bar plot of each disease state in each tissue. Each row represents a significant GO biological process which is colored according to the -log10(p.adjust). |
| Page: 1 2 3 4 5 6 7 8 9 |
| GO ID | Tissue | Disease Stage | Description | Gene Ratio | Bg Ratio | pvalue | p.adjust | Count |
| GO:005067318 | Esophagus | ESCC | epithelial cell proliferation | 238/8552 | 437/18723 | 1.19e-04 | 8.20e-04 | 238 |
| GO:005067817 | Esophagus | ESCC | regulation of epithelial cell proliferation | 206/8552 | 381/18723 | 5.51e-04 | 3.02e-03 | 206 |
| GO:005067310 | Oral cavity | OSCC | epithelial cell proliferation | 212/7305 | 437/18723 | 2.82e-05 | 2.61e-04 | 212 |
| GO:005067810 | Oral cavity | OSCC | regulation of epithelial cell proliferation | 180/7305 | 381/18723 | 5.88e-04 | 3.35e-03 | 180 |
| Page: 1 |
| Pathway ID | Tissue | Disease Stage | Description | Gene Ratio | Bg Ratio | pvalue | p.adjust | qvalue | Count |
| Page: 1 |
Top |
Cell-cell communication analysis |
| Identification of potential cell-cell interactions between two cell types and their ligand-receptor pairs for different disease states |
| Ligand | Receptor | LRpair | Pathway | Tissue | Disease Stage |
| Page: 1 |
Top |
Single-cell gene regulatory network inference analysis |
| Find out the significant the regulons (TFs) and the target genes of each regulon across cell types for different disease states |
| TF | Cell Type | Tissue | Disease Stage | Target Gene | RSS | Regulon Activity |
| ∗The dot plots of a searched regulon are shown for all cell subpopulations in each disease state of each tissue based on the regulon specific score inferred using pySCENIC and by calculating the average expression. |
| Page: 1 |
Top |
Somatic mutation of malignant transformation related genes |
| Annotation of somatic variants for genes involved in malignant transformation |
| Hugo Symbol | Variant Class | Variant Classification | dbSNP RS | HGVSc | HGVSp | HGVSp Short | SWISSPROT | BIOTYPE | SIFT | PolyPhen | Tumor Sample Barcode | Tissue | Histology | Sex | Age | Stage | Therapy Types | Drugs | Outcome |
| KRT4 | SNV | Missense_Mutation | c.791G>A | p.Ser264Asn | p.S264N | P19013 | protein_coding | tolerated(0.07) | benign(0.017) | TCGA-FI-A2D5-01 | Endometrium | uterine corpus endometrioid carcinoma | Female | <65 | III/IV | Chemotherapy | carboplatinum | PD | |
| KRT4 | insertion | In_Frame_Ins | novel | c.241_242insACACTGGTGGCTTTGGTGCCGGCGGCTTCGGAGCTGGTTTCG | p.Phe80_Gly81insAspThrGlyGlyPheGlyAlaGlyGlyPheGlyAlaGlyPhe | p.F80_G81insDTGGFGAGGFGAGF | P19013 | protein_coding | TCGA-AX-A0J1-01 | Endometrium | uterine corpus endometrioid carcinoma | Female | >=65 | I/II | Unknown | Unknown | SD | ||
| KRT4 | SNV | Missense_Mutation | c.196N>A | p.Ala66Thr | p.A66T | P19013 | protein_coding | deleterious(0.04) | possibly_damaging(0.844) | TCGA-CC-A7II-01 | Liver | liver hepatocellular carcinoma | Male | <65 | III/IV | Unknown | Unknown | PD | |
| KRT4 | SNV | Missense_Mutation | c.83N>T | p.Gly28Val | p.G28V | P19013 | protein_coding | tolerated(0.38) | benign(0) | TCGA-44-7667-01 | Lung | lung adenocarcinoma | Female | <65 | I/II | Unknown | Unknown | SD | |
| KRT4 | SNV | Missense_Mutation | rs377329227 | c.1259N>A | p.Arg420His | p.R420H | P19013 | protein_coding | deleterious(0.01) | benign(0.171) | TCGA-55-6968-01 | Lung | lung adenocarcinoma | Male | <65 | III/IV | Chemotherapy | unknown | PD |
| KRT4 | SNV | Missense_Mutation | novel | c.263N>T | p.Gly88Val | p.G88V | P19013 | protein_coding | tolerated(0.07) | possibly_damaging(0.811) | TCGA-55-8089-01 | Lung | lung adenocarcinoma | Male | <65 | I/II | Unknown | Unknown | SD |
| KRT4 | SNV | Missense_Mutation | novel | c.101C>A | p.Ser34Tyr | p.S34Y | P19013 | protein_coding | tolerated(0.06) | probably_damaging(0.998) | TCGA-55-8505-01 | Lung | lung adenocarcinoma | Male | <65 | III/IV | Chemotherapy | cisplatin | CR |
| KRT4 | SNV | Missense_Mutation | c.625N>G | p.Leu209Val | p.L209V | P19013 | protein_coding | deleterious(0) | possibly_damaging(0.483) | TCGA-55-A48X-01 | Lung | lung adenocarcinoma | Female | <65 | I/II | Chemotherapy | carboplatin | PD | |
| KRT4 | SNV | Missense_Mutation | c.1442N>C | p.Gly481Ala | p.G481A | P19013 | protein_coding | tolerated_low_confidence(0.08) | possibly_damaging(0.899) | TCGA-MP-A4SV-01 | Lung | lung adenocarcinoma | Male | >=65 | I/II | Unknown | Unknown | SD | |
| KRT4 | SNV | Missense_Mutation | c.233G>A | p.Gly78Glu | p.G78E | P19013 | protein_coding | deleterious(0.01) | possibly_damaging(0.816) | TCGA-18-3409-01 | Lung | lung squamous cell carcinoma | Male | >=65 | I/II | Unknown | Unknown | PD |
| Page: 1 2 3 4 5 6 7 8 |
Top |
Related drugs of malignant transformation related genes |
| Identification of chemicals and drugs interact with genes involved in malignant transfromation |
| (DGIdb 4.0) |
| Entrez ID | Symbol | Category | Interaction Types | Drug Claim Name | Drug Name | PMIDs |
| Page: 1 |

Copyright 2023-Present -The University of Texas Health Science Center at Houston |