
|
|||||
|
 | |
| |
| |
| |
| |
| |
|
Gene: CARF |
Gene summary for CARF |
| Gene information | Species | Human | Gene symbol | CARF | Gene ID | 79800 |
| Gene name | calcium responsive transcription factor | |
| Gene Alias | ALS2CR8 | |
| Cytomap | 2q33.2 | |
| Gene Type | protein-coding | GO ID | GO:0006139 | UniProtAcc | A0A024R427 |
Top |
Malignant transformation analysis |
| Identification of the aberrant gene expression in precancerous and cancerous lesions by comparing the gene expression of stem-like cells in diseased tissues with normal stem cells |
| Entrez ID | Symbol | Replicates | Species | Organ | Tissue | Adj P-value | Log2FC | Malignancy |
| 79800 | CARF | NAFLD1 | Human | Liver | NAFLD | 2.18e-02 | 4.00e-01 | -0.04 |
| 79800 | CARF | HCC1_Meng | Human | Liver | HCC | 1.33e-08 | -4.77e-02 | 0.0246 |
| 79800 | CARF | HCC2_Meng | Human | Liver | HCC | 1.34e-05 | 1.77e-02 | 0.0107 |
| 79800 | CARF | HCC1 | Human | Liver | HCC | 5.05e-12 | 2.96e+00 | 0.5336 |
| 79800 | CARF | HCC2 | Human | Liver | HCC | 1.02e-15 | 2.08e+00 | 0.5341 |
| 79800 | CARF | HCC5 | Human | Liver | HCC | 2.34e-08 | 1.68e+00 | 0.4932 |
| Page: 1 |
| Tissue | Expression Dynamics | Abbreviation |
| Liver | 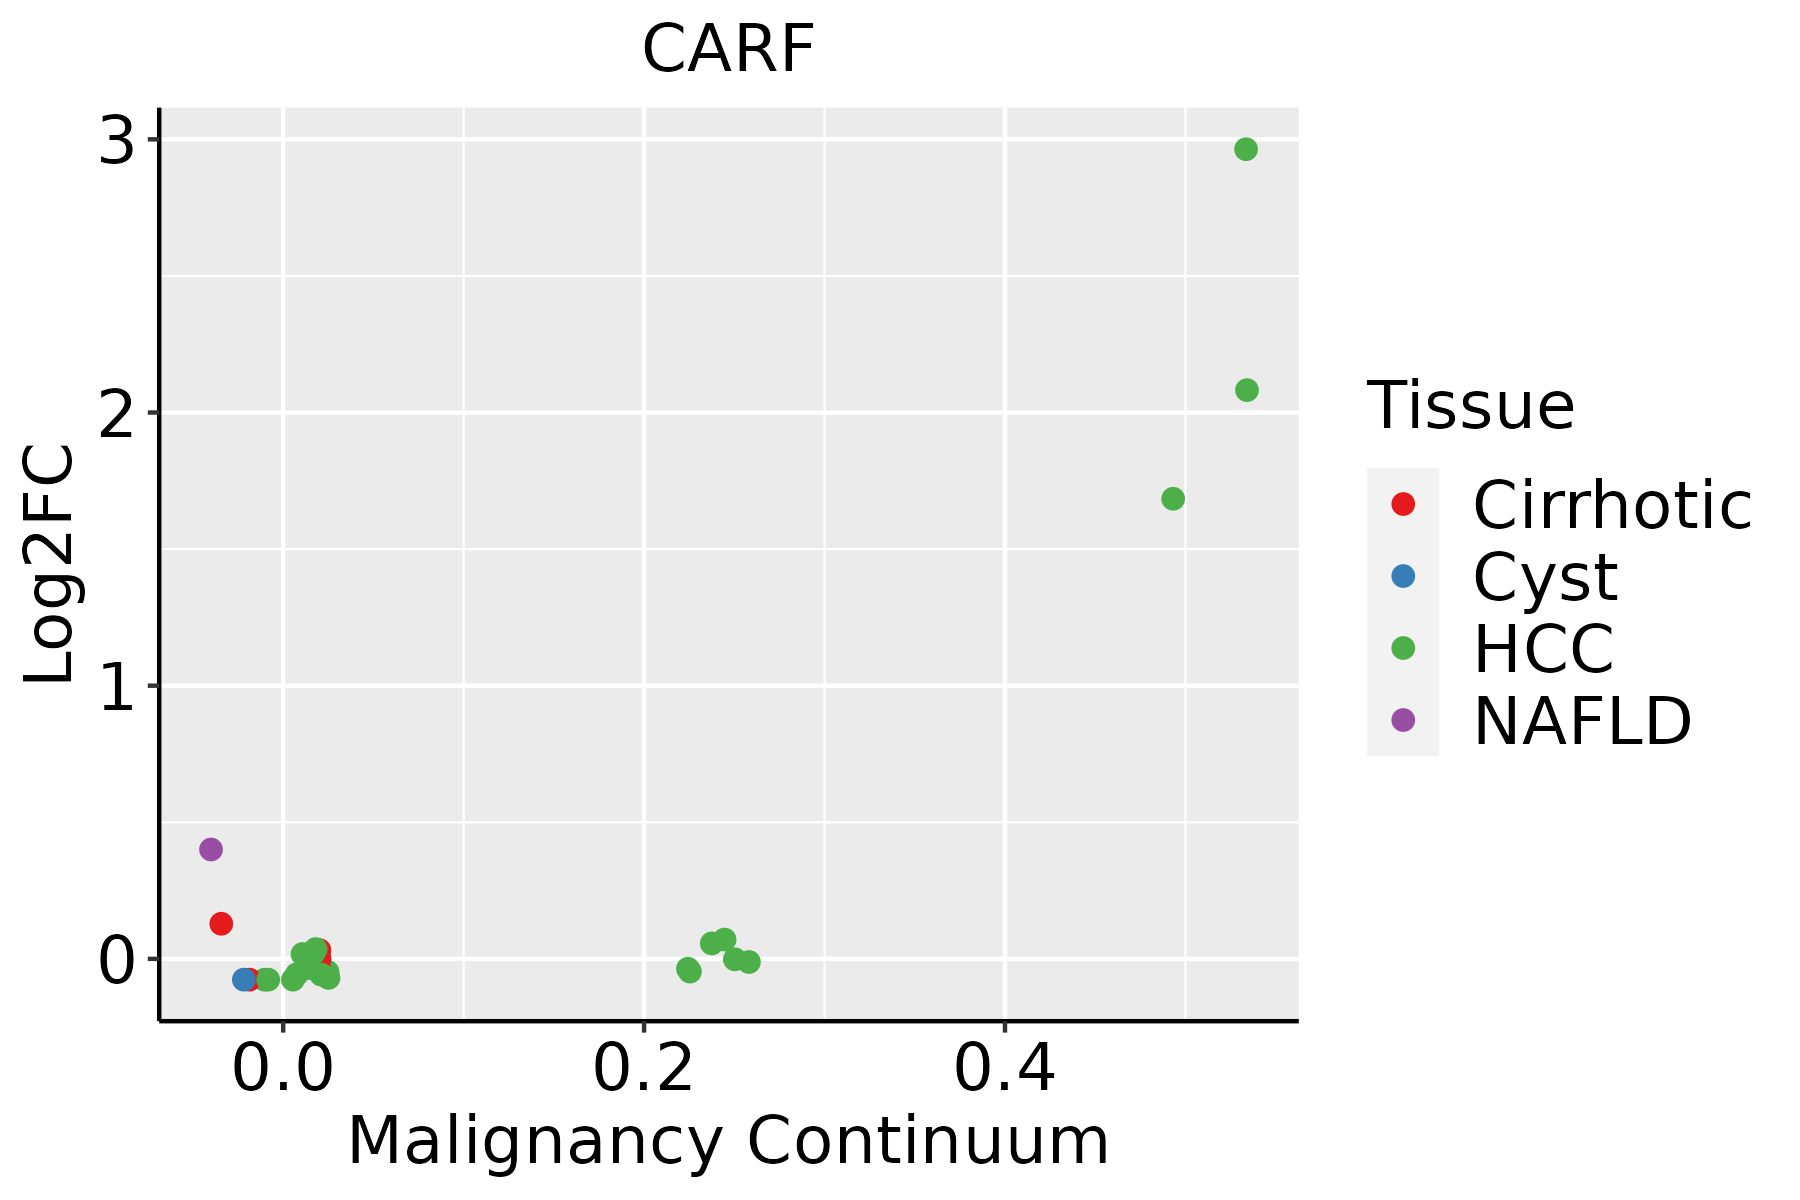 | HCC: Hepatocellular carcinoma |
| NAFLD: Non-alcoholic fatty liver disease |
| ∗log2FC in expression of this searched gene in stem-like cells from each diseased tissue sample relative to stem-like cells in normal samples in each tissue plotted against the malignancy continuum. Samples are colored based on if they are from different disease stage. |
Top |
Malignant transformation related pathway analysis |
| Find out the enriched GO biological processes and KEGG pathways involved in transition from healthy to precancer to cancer |
| Tissue | Disease Stage | Enriched GO biological Processes |
| Colorectum | AD |  |
| Colorectum | SER |  |
| Colorectum | MSS |  |
| Colorectum | MSI-H |  |
| Colorectum | FAP |  |
| ∗Top 15 enriched GO BP terms are showed in the bar plot of each disease state in each tissue. Each row represents a significant GO biological process which is colored according to the -log10(p.adjust). |
| Page: 1 2 3 4 5 6 7 8 9 |
| GO ID | Tissue | Disease Stage | Description | Gene Ratio | Bg Ratio | pvalue | p.adjust | Count |
| GO:00100387 | Liver | NAFLD | response to metal ion | 62/1882 | 373/18723 | 5.05e-05 | 1.19e-03 | 62 |
| GO:00515923 | Liver | NAFLD | response to calcium ion | 26/1882 | 149/18723 | 3.69e-03 | 3.15e-02 | 26 |
| GO:001003822 | Liver | HCC | response to metal ion | 208/7958 | 373/18723 | 1.35e-07 | 2.56e-06 | 208 |
| GO:00510902 | Liver | HCC | regulation of DNA-binding transcription factor activity | 220/7958 | 440/18723 | 8.04e-04 | 4.82e-03 | 220 |
| GO:007124112 | Liver | HCC | cellular response to inorganic substance | 119/7958 | 226/18723 | 1.26e-03 | 6.92e-03 | 119 |
| GO:005159221 | Liver | HCC | response to calcium ion | 81/7958 | 149/18723 | 2.26e-03 | 1.13e-02 | 81 |
| GO:007124812 | Liver | HCC | cellular response to metal ion | 101/7958 | 197/18723 | 7.82e-03 | 3.10e-02 | 101 |
| GO:19015221 | Liver | HCC | positive regulation of transcription from RNA polymerase II promoter involved in cellular response to chemical stimulus | 15/7958 | 22/18723 | 1.35e-02 | 4.80e-02 | 15 |
| Page: 1 |
| Pathway ID | Tissue | Disease Stage | Description | Gene Ratio | Bg Ratio | pvalue | p.adjust | qvalue | Count |
| Page: 1 |
Top |
Cell-cell communication analysis |
| Identification of potential cell-cell interactions between two cell types and their ligand-receptor pairs for different disease states |
| Ligand | Receptor | LRpair | Pathway | Tissue | Disease Stage |
| Page: 1 |
Top |
Single-cell gene regulatory network inference analysis |
| Find out the significant the regulons (TFs) and the target genes of each regulon across cell types for different disease states |
| TF | Cell Type | Tissue | Disease Stage | Target Gene | RSS | Regulon Activity |
| ∗The dot plots of a searched regulon are shown for all cell subpopulations in each disease state of each tissue based on the regulon specific score inferred using pySCENIC and by calculating the average expression. |
| Page: 1 |
Top |
Somatic mutation of malignant transformation related genes |
| Annotation of somatic variants for genes involved in malignant transformation |
| Hugo Symbol | Variant Class | Variant Classification | dbSNP RS | HGVSc | HGVSp | HGVSp Short | SWISSPROT | BIOTYPE | SIFT | PolyPhen | Tumor Sample Barcode | Tissue | Histology | Sex | Age | Stage | Therapy Types | Drugs | Outcome |
| CARF | SNV | Missense_Mutation | c.1573G>A | p.Glu525Lys | p.E525K | Q8N187 | protein_coding | deleterious(0.03) | possibly_damaging(0.65) | TCGA-H7-8501-01 | Oral cavity | head & neck squamous cell carcinoma | Male | <65 | I/II | Chemotherapy | unknown | CR | |
| CARF | SNV | Missense_Mutation | novel | c.196C>T | p.Pro66Ser | p.P66S | Q8N187 | protein_coding | tolerated_low_confidence(0.36) | benign(0.022) | TCGA-T2-A6X2-01 | Oral cavity | head & neck squamous cell carcinoma | Male | >=65 | III/IV | Unknown | Unknown | SD |
| CARF | SNV | Missense_Mutation | rs753592872 | c.1415N>C | p.Ile472Thr | p.I472T | Q8N187 | protein_coding | deleterious(0) | possibly_damaging(0.557) | TCGA-G9-6329-01 | Prostate | prostate adenocarcinoma | Male | >=65 | 7 | Unknown | Unknown | SD |
| CARF | SNV | Missense_Mutation | c.419N>A | p.Ser140Asn | p.S140N | Q8N187 | protein_coding | deleterious_low_confidence(0.04) | benign(0.165) | TCGA-CD-8536-01 | Stomach | stomach adenocarcinoma | Male | >=65 | I/II | Chemotherapy | epirubicin | CR | |
| CARF | SNV | Missense_Mutation | c.1481N>A | p.Ile494Asn | p.I494N | Q8N187 | protein_coding | tolerated(0.17) | benign(0.214) | TCGA-CD-A48A-01 | Stomach | stomach adenocarcinoma | Male | <65 | I/II | Chemotherapy | capecitabine | CR | |
| CARF | SNV | Missense_Mutation | rs371549950 | c.155N>A | p.Arg52His | p.R52H | Q8N187 | protein_coding | tolerated_low_confidence(0.55) | benign(0) | TCGA-HU-A4GN-01 | Stomach | stomach adenocarcinoma | Male | <65 | I/II | Chemotherapy | mitomycin | PD |
| CARF | SNV | Missense_Mutation | novel | c.872N>T | p.Arg291Ile | p.R291I | Q8N187 | protein_coding | deleterious(0) | probably_damaging(0.985) | TCGA-VQ-A8P2-01 | Stomach | stomach adenocarcinoma | Male | >=65 | III/IV | Unspecific | Complete Response | |
| CARF | SNV | Missense_Mutation | rs778110847 | c.1247N>A | p.Arg416His | p.R416H | Q8N187 | protein_coding | deleterious(0) | probably_damaging(0.999) | TCGA-VQ-A91D-01 | Stomach | stomach adenocarcinoma | Male | >=65 | III/IV | Chemotherapy | fluorouracil | PD |
| CARF | deletion | Frame_Shift_Del | novel | c.1421delA | p.Asn474IlefsTer10 | p.N474Ifs*10 | Q8N187 | protein_coding | TCGA-BR-8591-01 | Stomach | stomach adenocarcinoma | Male | >=65 | III/IV | Unknown | Unknown | SD | ||
| CARF | SNV | Missense_Mutation | novel | c.14N>G | p.Asn5Ser | p.N5S | Q8N187 | protein_coding | tolerated_low_confidence(0.17) | benign(0.001) | TCGA-ET-A2MX-01 | Thyroid | thyroid carcinoma | Male | <65 | I/II | Unknown | Unknown | SD |
| Page: 1 2 3 4 5 6 |
Top |
Related drugs of malignant transformation related genes |
| Identification of chemicals and drugs interact with genes involved in malignant transfromation |
| (DGIdb 4.0) |
| Entrez ID | Symbol | Category | Interaction Types | Drug Claim Name | Drug Name | PMIDs |
| Page: 1 |

Copyright 2023-Present -The University of Texas Health Science Center at Houston |