
|
|||||
|
 | |
| |
| |
| |
| |
| |
|
Gene: ATF2 |
Gene summary for ATF2 |
| Gene information | Species | Human | Gene symbol | ATF2 | Gene ID | 1386 |
| Gene name | activating transcription factor 2 | |
| Gene Alias | CRE-BP1 | |
| Cytomap | 2q31.1 | |
| Gene Type | protein-coding | GO ID | GO:0000075 | UniProtAcc | P15336 |
Top |
Malignant transformation analysis |
| Identification of the aberrant gene expression in precancerous and cancerous lesions by comparing the gene expression of stem-like cells in diseased tissues with normal stem cells |
| Entrez ID | Symbol | Replicates | Species | Organ | Tissue | Adj P-value | Log2FC | Malignancy |
| 1386 | ATF2 | LZE4T | Human | Esophagus | ESCC | 8.37e-18 | 4.11e-01 | 0.0811 |
| 1386 | ATF2 | LZE5T | Human | Esophagus | ESCC | 9.01e-07 | 2.20e-01 | 0.0514 |
| 1386 | ATF2 | LZE7T | Human | Esophagus | ESCC | 1.43e-04 | 2.24e-01 | 0.0667 |
| 1386 | ATF2 | LZE8T | Human | Esophagus | ESCC | 9.88e-05 | 1.33e-01 | 0.067 |
| 1386 | ATF2 | LZE20T | Human | Esophagus | ESCC | 3.31e-04 | 6.52e-02 | 0.0662 |
| 1386 | ATF2 | LZE24T | Human | Esophagus | ESCC | 2.08e-15 | 3.24e-01 | 0.0596 |
| 1386 | ATF2 | P2T-E | Human | Esophagus | ESCC | 3.71e-20 | 3.14e-01 | 0.1177 |
| 1386 | ATF2 | P4T-E | Human | Esophagus | ESCC | 2.21e-22 | 5.30e-01 | 0.1323 |
| 1386 | ATF2 | P5T-E | Human | Esophagus | ESCC | 1.63e-16 | 2.25e-01 | 0.1327 |
| 1386 | ATF2 | P8T-E | Human | Esophagus | ESCC | 5.61e-18 | 4.42e-01 | 0.0889 |
| 1386 | ATF2 | P9T-E | Human | Esophagus | ESCC | 2.06e-25 | 5.27e-01 | 0.1131 |
| 1386 | ATF2 | P10T-E | Human | Esophagus | ESCC | 4.73e-21 | 2.79e-01 | 0.116 |
| 1386 | ATF2 | P11T-E | Human | Esophagus | ESCC | 8.81e-10 | 5.20e-01 | 0.1426 |
| 1386 | ATF2 | P12T-E | Human | Esophagus | ESCC | 1.98e-31 | 6.36e-01 | 0.1122 |
| 1386 | ATF2 | P15T-E | Human | Esophagus | ESCC | 6.17e-33 | 7.16e-01 | 0.1149 |
| 1386 | ATF2 | P16T-E | Human | Esophagus | ESCC | 9.89e-23 | 4.17e-01 | 0.1153 |
| 1386 | ATF2 | P17T-E | Human | Esophagus | ESCC | 1.73e-02 | 2.44e-01 | 0.1278 |
| 1386 | ATF2 | P19T-E | Human | Esophagus | ESCC | 2.13e-02 | 1.71e-01 | 0.1662 |
| 1386 | ATF2 | P20T-E | Human | Esophagus | ESCC | 1.28e-13 | 4.23e-01 | 0.1124 |
| 1386 | ATF2 | P21T-E | Human | Esophagus | ESCC | 2.07e-21 | 2.89e-01 | 0.1617 |
| Page: 1 2 3 4 |
| Tissue | Expression Dynamics | Abbreviation |
| Esophagus | 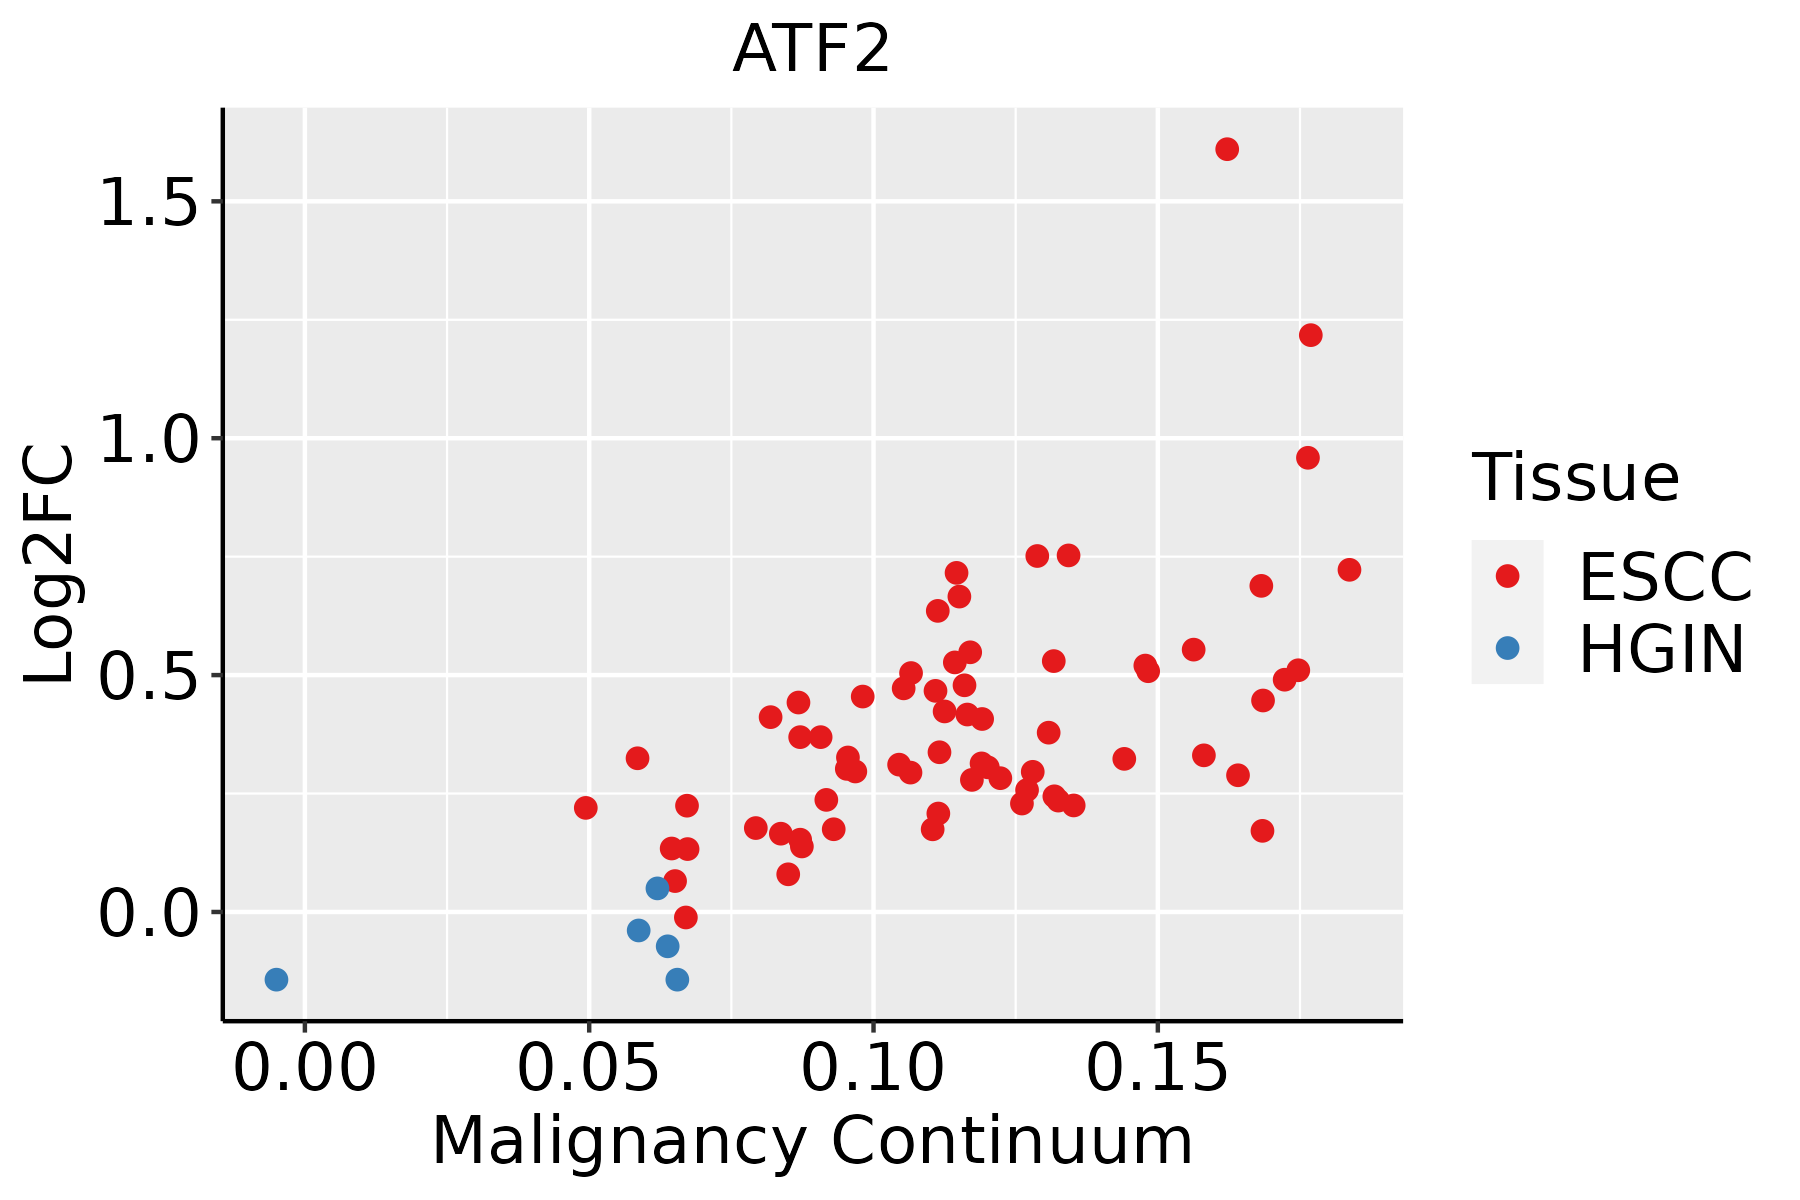 | ESCC: Esophageal squamous cell carcinoma |
| HGIN: High-grade intraepithelial neoplasias | ||
| LGIN: Low-grade intraepithelial neoplasias | ||
| Liver |  | HCC: Hepatocellular carcinoma |
| NAFLD: Non-alcoholic fatty liver disease |
| ∗log2FC in expression of this searched gene in stem-like cells from each diseased tissue sample relative to stem-like cells in normal samples in each tissue plotted against the malignancy continuum. Samples are colored based on if they are from different disease stage. |
Top |
Malignant transformation related pathway analysis |
| Find out the enriched GO biological processes and KEGG pathways involved in transition from healthy to precancer to cancer |
| Tissue | Disease Stage | Enriched GO biological Processes |
| Colorectum | AD |  |
| Colorectum | SER |  |
| Colorectum | MSS |  |
| Colorectum | MSI-H |  |
| Colorectum | FAP |  |
| ∗Top 15 enriched GO BP terms are showed in the bar plot of each disease state in each tissue. Each row represents a significant GO biological process which is colored according to the -log10(p.adjust). |
| Page: 1 2 3 4 5 6 7 8 9 |
| GO ID | Tissue | Disease Stage | Description | Gene Ratio | Bg Ratio | pvalue | p.adjust | Count |
| GO:001657015 | Esophagus | ESCC | histone modification | 323/8552 | 463/18723 | 2.61e-26 | 7.88e-24 | 323 |
| GO:0006979111 | Esophagus | ESCC | response to oxidative stress | 303/8552 | 446/18723 | 7.15e-22 | 1.30e-19 | 303 |
| GO:001820514 | Esophagus | ESCC | peptidyl-lysine modification | 259/8552 | 376/18723 | 3.90e-20 | 5.26e-18 | 259 |
| GO:0006839110 | Esophagus | ESCC | mitochondrial transport | 187/8552 | 254/18723 | 8.35e-20 | 9.81e-18 | 187 |
| GO:0062197111 | Esophagus | ESCC | cellular response to chemical stress | 234/8552 | 337/18723 | 5.37e-19 | 5.97e-17 | 234 |
| GO:000734615 | Esophagus | ESCC | regulation of mitotic cell cycle | 293/8552 | 457/18723 | 8.00e-16 | 5.64e-14 | 293 |
| GO:000170119 | Esophagus | ESCC | in utero embryonic development | 243/8552 | 367/18723 | 1.00e-15 | 6.86e-14 | 243 |
| GO:0034599111 | Esophagus | ESCC | cellular response to oxidative stress | 197/8552 | 288/18723 | 3.76e-15 | 2.15e-13 | 197 |
| GO:000700619 | Esophagus | ESCC | mitochondrial membrane organization | 93/8552 | 116/18723 | 2.16e-14 | 1.11e-12 | 93 |
| GO:000961518 | Esophagus | ESCC | response to virus | 238/8552 | 367/18723 | 6.65e-14 | 3.32e-12 | 238 |
| GO:001839413 | Esophagus | ESCC | peptidyl-lysine acetylation | 123/8552 | 169/18723 | 6.58e-13 | 2.94e-11 | 123 |
| GO:004354313 | Esophagus | ESCC | protein acylation | 165/8552 | 243/18723 | 1.69e-12 | 7.14e-11 | 165 |
| GO:000647313 | Esophagus | ESCC | protein acetylation | 140/8552 | 201/18723 | 4.37e-12 | 1.69e-10 | 140 |
| GO:0048732111 | Esophagus | ESCC | gland development | 269/8552 | 436/18723 | 7.81e-12 | 2.95e-10 | 269 |
| GO:000703314 | Esophagus | ESCC | vacuole organization | 127/8552 | 180/18723 | 1.04e-11 | 3.85e-10 | 127 |
| GO:001839313 | Esophagus | ESCC | internal peptidyl-lysine acetylation | 114/8552 | 158/18723 | 1.16e-11 | 4.24e-10 | 114 |
| GO:000647513 | Esophagus | ESCC | internal protein amino acid acetylation | 115/8552 | 160/18723 | 1.43e-11 | 5.08e-10 | 115 |
| GO:0008637110 | Esophagus | ESCC | apoptotic mitochondrial changes | 83/8552 | 107/18723 | 1.43e-11 | 5.08e-10 | 83 |
| GO:00165735 | Esophagus | ESCC | histone acetylation | 110/8552 | 152/18723 | 1.95e-11 | 6.81e-10 | 110 |
| GO:190198713 | Esophagus | ESCC | regulation of cell cycle phase transition | 242/8552 | 390/18723 | 3.86e-11 | 1.26e-09 | 242 |
| Page: 1 2 3 4 5 6 7 8 |
| Pathway ID | Tissue | Disease Stage | Description | Gene Ratio | Bg Ratio | pvalue | p.adjust | qvalue | Count |
| hsa05166211 | Esophagus | ESCC | Human T-cell leukemia virus 1 infection | 164/4205 | 222/8465 | 8.13e-14 | 2.09e-12 | 1.07e-12 | 164 |
| hsa05020210 | Esophagus | ESCC | Prion disease | 193/4205 | 273/8465 | 6.42e-13 | 1.34e-11 | 6.89e-12 | 193 |
| hsa04714211 | Esophagus | ESCC | Thermogenesis | 163/4205 | 232/8465 | 9.22e-11 | 1.14e-09 | 5.86e-10 | 163 |
| hsa0466810 | Esophagus | ESCC | TNF signaling pathway | 89/4205 | 114/8465 | 3.36e-10 | 4.01e-09 | 2.06e-09 | 89 |
| hsa0520325 | Esophagus | ESCC | Viral carcinogenesis | 137/4205 | 204/8465 | 2.47e-07 | 1.88e-06 | 9.62e-07 | 137 |
| hsa05163210 | Esophagus | ESCC | Human cytomegalovirus infection | 148/4205 | 225/8465 | 5.73e-07 | 4.00e-06 | 2.05e-06 | 148 |
| hsa051619 | Esophagus | ESCC | Hepatitis B | 108/4205 | 162/8465 | 7.68e-06 | 4.15e-05 | 2.12e-05 | 108 |
| hsa049268 | Esophagus | ESCC | Relaxin signaling pathway | 81/4205 | 129/8465 | 1.72e-03 | 5.09e-03 | 2.61e-03 | 81 |
| hsa0421114 | Esophagus | ESCC | Longevity regulating pathway | 58/4205 | 89/8465 | 2.19e-03 | 6.16e-03 | 3.16e-03 | 58 |
| hsa0492816 | Esophagus | ESCC | Parathyroid hormone synthesis, secretion and action | 66/4205 | 106/8465 | 5.86e-03 | 1.47e-02 | 7.51e-03 | 66 |
| hsa041517 | Esophagus | ESCC | PI3K-Akt signaling pathway | 197/4205 | 354/8465 | 1.24e-02 | 2.83e-02 | 1.45e-02 | 197 |
| hsa0492214 | Esophagus | ESCC | Glucagon signaling pathway | 64/4205 | 107/8465 | 2.18e-02 | 4.80e-02 | 2.46e-02 | 64 |
| hsa05166310 | Esophagus | ESCC | Human T-cell leukemia virus 1 infection | 164/4205 | 222/8465 | 8.13e-14 | 2.09e-12 | 1.07e-12 | 164 |
| hsa0502038 | Esophagus | ESCC | Prion disease | 193/4205 | 273/8465 | 6.42e-13 | 1.34e-11 | 6.89e-12 | 193 |
| hsa04714310 | Esophagus | ESCC | Thermogenesis | 163/4205 | 232/8465 | 9.22e-11 | 1.14e-09 | 5.86e-10 | 163 |
| hsa0466817 | Esophagus | ESCC | TNF signaling pathway | 89/4205 | 114/8465 | 3.36e-10 | 4.01e-09 | 2.06e-09 | 89 |
| hsa0520335 | Esophagus | ESCC | Viral carcinogenesis | 137/4205 | 204/8465 | 2.47e-07 | 1.88e-06 | 9.62e-07 | 137 |
| hsa0516338 | Esophagus | ESCC | Human cytomegalovirus infection | 148/4205 | 225/8465 | 5.73e-07 | 4.00e-06 | 2.05e-06 | 148 |
| hsa0516114 | Esophagus | ESCC | Hepatitis B | 108/4205 | 162/8465 | 7.68e-06 | 4.15e-05 | 2.12e-05 | 108 |
| hsa0492616 | Esophagus | ESCC | Relaxin signaling pathway | 81/4205 | 129/8465 | 1.72e-03 | 5.09e-03 | 2.61e-03 | 81 |
| Page: 1 2 3 |
Top |
Cell-cell communication analysis |
| Identification of potential cell-cell interactions between two cell types and their ligand-receptor pairs for different disease states |
| Ligand | Receptor | LRpair | Pathway | Tissue | Disease Stage |
| Page: 1 |
Top |
Single-cell gene regulatory network inference analysis |
| Find out the significant the regulons (TFs) and the target genes of each regulon across cell types for different disease states |
| TF | Cell Type | Tissue | Disease Stage | Target Gene | RSS | Regulon Activity |
| ATF2 | GOB | Colorectum | CRC | AC090630.1,FGF13,PHTF1, etc. | 4.49e-02 |  |
| ATF2 | GOB | Colorectum | FAP | AC090630.1,FGF13,PHTF1, etc. | 1.14e-01 |  |
| ATF2 | EE | Colorectum | FAP | AC090630.1,FGF13,PHTF1, etc. | 8.37e-03 | |
| ATF2 | CD8TCM | Colorectum | SER | OGG1,STAMBPL1,CFAP97, etc. | 4.11e-02 |  |
| ATF2 | KER | Esophagus | ADJ | CHKA,VIT,BLOC1S5, etc. | 2.30e-01 |  |
| ATF2 | INMON | Esophagus | ESCC | ZFHX4,TMOD2,PCGF6, etc. | 7.46e-02 |  |
| ATF2 | GRA | Oral cavity | LP | ZNF625,MB21D2,SMG8, etc. | 2.26e-01 |  |
| ATF2 | NKT | Pancreas | ADJ | AC109322.2,GEN1,OSBPL5, etc. | 4.05e-01 |  |
| ATF2 | NKT | Pancreas | PanIN | AC109322.2,GEN1,OSBPL5, etc. | 8.99e-02 |  |
| ∗The dot plots of a searched regulon are shown for all cell subpopulations in each disease state of each tissue based on the regulon specific score inferred using pySCENIC and by calculating the average expression. |
| Page: 1 |
Top |
Somatic mutation of malignant transformation related genes |
| Annotation of somatic variants for genes involved in malignant transformation |
| Hugo Symbol | Variant Class | Variant Classification | dbSNP RS | HGVSc | HGVSp | HGVSp Short | SWISSPROT | BIOTYPE | SIFT | PolyPhen | Tumor Sample Barcode | Tissue | Histology | Sex | Age | Stage | Therapy Types | Drugs | Outcome |
| ATF2 | SNV | Missense_Mutation | c.23A>T | p.Asn8Ile | p.N8I | P15336 | protein_coding | deleterious_low_confidence(0.01) | benign(0.125) | TCGA-EJ-7314-01 | Prostate | prostate adenocarcinoma | Male | <65 | 7 | Unknown | Unknown | SD | |
| ATF2 | SNV | Missense_Mutation | novel | c.1412N>T | p.Ala471Val | p.A471V | P15336 | protein_coding | tolerated(0.05) | benign(0.003) | TCGA-XK-AAIW-01 | Prostate | prostate adenocarcinoma | Male | >=65 | 9 | Unknown | Unknown | PD |
| ATF2 | SNV | Missense_Mutation | novel | c.912N>T | p.Arg304Ser | p.R304S | P15336 | protein_coding | tolerated(0.81) | benign(0.001) | TCGA-YL-A8S9-01 | Prostate | prostate adenocarcinoma | Male | <65 | 9 | Unknown | Unknown | PD |
| ATF2 | SNV | Missense_Mutation | c.133C>A | p.His45Asn | p.H45N | P15336 | protein_coding | deleterious(0) | probably_damaging(0.995) | TCGA-CD-A4MG-01 | Stomach | stomach adenocarcinoma | Male | >=65 | I/II | Unknown | Unknown | PD |
| Page: 1 2 3 4 5 6 |
Top |
Related drugs of malignant transformation related genes |
| Identification of chemicals and drugs interact with genes involved in malignant transfromation |
| (DGIdb 4.0) |
| Entrez ID | Symbol | Category | Interaction Types | Drug Claim Name | Drug Name | PMIDs |
| 1386 | ATF2 | TRANSCRIPTION FACTOR | 2-METHOXYESTRADIOL | 2-METHOXYESTRADIOL | 15691880 | |
| 1386 | ATF2 | TRANSCRIPTION FACTOR | GLUCOCORTICOID | 17525285 | ||
| 1386 | ATF2 | TRANSCRIPTION FACTOR | TGFBETA1 | 16125722 | ||
| 1386 | ATF2 | TRANSCRIPTION FACTOR | STZ | STREPTOZOCIN | 12805110 | |
| 1386 | ATF2 | TRANSCRIPTION FACTOR | fentanyl | FENTANYL | 30106255 | |
| 1386 | ATF2 | TRANSCRIPTION FACTOR | H2O2 | 9773928 | ||
| 1386 | ATF2 | TRANSCRIPTION FACTOR | ALPHA-DIFLUOROMETHYLORNITHINE | 17804813 |
| Page: 1 |

Copyright 2023-Present -The University of Texas Health Science Center at Houston |