
|
|||||
|
 | |
| |
| |
| |
| |
| |
|
Gene: ZDHHC9 |
Gene summary for ZDHHC9 |
| Gene information | Species | Human | Gene symbol | ZDHHC9 | Gene ID | 51114 |
| Gene name | zinc finger DHHC-type palmitoyltransferase 9 | |
| Gene Alias | CGI89 | |
| Cytomap | Xq26.1 | |
| Gene Type | protein-coding | GO ID | GO:0000165 | UniProtAcc | Q9Y397 |
Top |
Malignant transformation analysis |
| Identification of the aberrant gene expression in precancerous and cancerous lesions by comparing the gene expression of stem-like cells in diseased tissues with normal stem cells |
| Entrez ID | Symbol | Replicates | Species | Organ | Tissue | Adj P-value | Log2FC | Malignancy |
| 51114 | ZDHHC9 | HTA11_347_2000001011 | Human | Colorectum | AD | 1.18e-04 | 3.21e-01 | -0.1954 |
| 51114 | ZDHHC9 | HTA11_1391_2000001011 | Human | Colorectum | AD | 7.67e-07 | 4.53e-01 | -0.059 |
| 51114 | ZDHHC9 | HTA11_866_3004761011 | Human | Colorectum | AD | 1.34e-02 | 2.87e-01 | 0.096 |
| 51114 | ZDHHC9 | HTA11_99999965062_69753 | Human | Colorectum | MSI-H | 5.79e-04 | 1.01e+00 | 0.3487 |
| 51114 | ZDHHC9 | HTA11_99999965104_69814 | Human | Colorectum | MSS | 4.13e-15 | 8.89e-01 | 0.281 |
| 51114 | ZDHHC9 | HTA11_99999971662_82457 | Human | Colorectum | MSS | 2.14e-25 | 8.70e-01 | 0.3859 |
| 51114 | ZDHHC9 | HTA11_99999973899_84307 | Human | Colorectum | MSS | 2.61e-06 | 8.02e-01 | 0.2585 |
| 51114 | ZDHHC9 | HTA11_99999974143_84620 | Human | Colorectum | MSS | 7.12e-22 | 8.18e-01 | 0.3005 |
| 51114 | ZDHHC9 | A015-C-203 | Human | Colorectum | FAP | 8.30e-05 | -9.59e-02 | -0.1294 |
| 51114 | ZDHHC9 | A002-C-201 | Human | Colorectum | FAP | 1.00e-02 | -1.56e-01 | 0.0324 |
| 51114 | ZDHHC9 | A002-C-205 | Human | Colorectum | FAP | 5.87e-04 | -1.73e-01 | -0.1236 |
| 51114 | ZDHHC9 | A002-C-114 | Human | Colorectum | FAP | 1.29e-02 | -1.36e-01 | -0.1561 |
| 51114 | ZDHHC9 | A015-C-104 | Human | Colorectum | FAP | 2.02e-04 | -1.01e-01 | -0.1899 |
| 51114 | ZDHHC9 | A002-C-016 | Human | Colorectum | FAP | 1.26e-06 | -1.53e-01 | 0.0521 |
| 51114 | ZDHHC9 | A002-C-116 | Human | Colorectum | FAP | 2.94e-07 | -1.78e-01 | -0.0452 |
| 51114 | ZDHHC9 | A018-E-020 | Human | Colorectum | FAP | 1.55e-04 | -1.90e-01 | -0.2034 |
| 51114 | ZDHHC9 | F034 | Human | Colorectum | FAP | 8.15e-05 | -1.58e-01 | -0.0665 |
| 51114 | ZDHHC9 | LZE4T | Human | Esophagus | ESCC | 5.87e-06 | 1.33e-01 | 0.0811 |
| 51114 | ZDHHC9 | LZE7T | Human | Esophagus | ESCC | 1.75e-08 | 6.48e-01 | 0.0667 |
| 51114 | ZDHHC9 | LZE8T | Human | Esophagus | ESCC | 7.88e-06 | 8.92e-02 | 0.067 |
| Page: 1 2 3 4 5 6 7 |
| Tissue | Expression Dynamics | Abbreviation |
| Colorectum (GSE201348) |  | FAP: Familial adenomatous polyposis |
| CRC: Colorectal cancer | ||
| Colorectum (HTA11) | 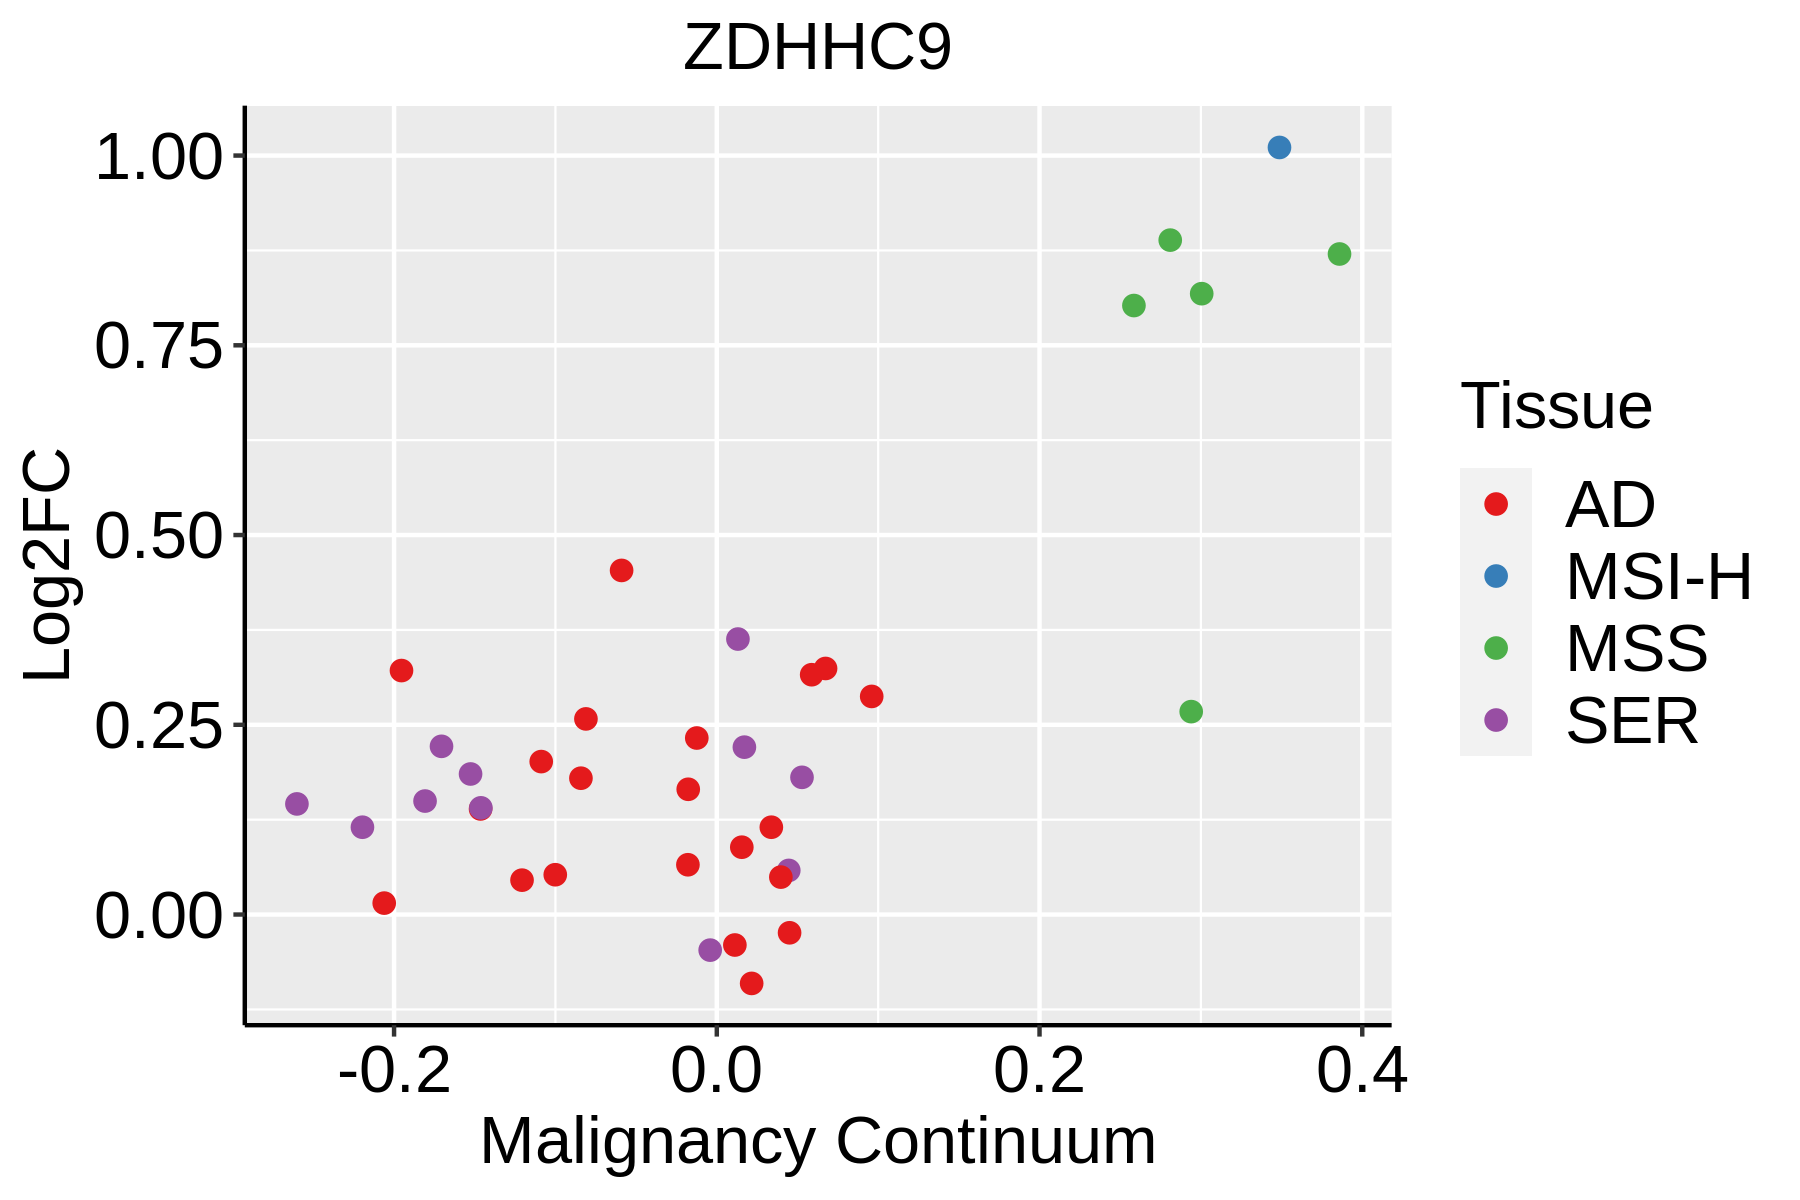 | AD: Adenomas |
| SER: Sessile serrated lesions | ||
| MSI-H: Microsatellite-high colorectal cancer | ||
| MSS: Microsatellite stable colorectal cancer | ||
| Esophagus | 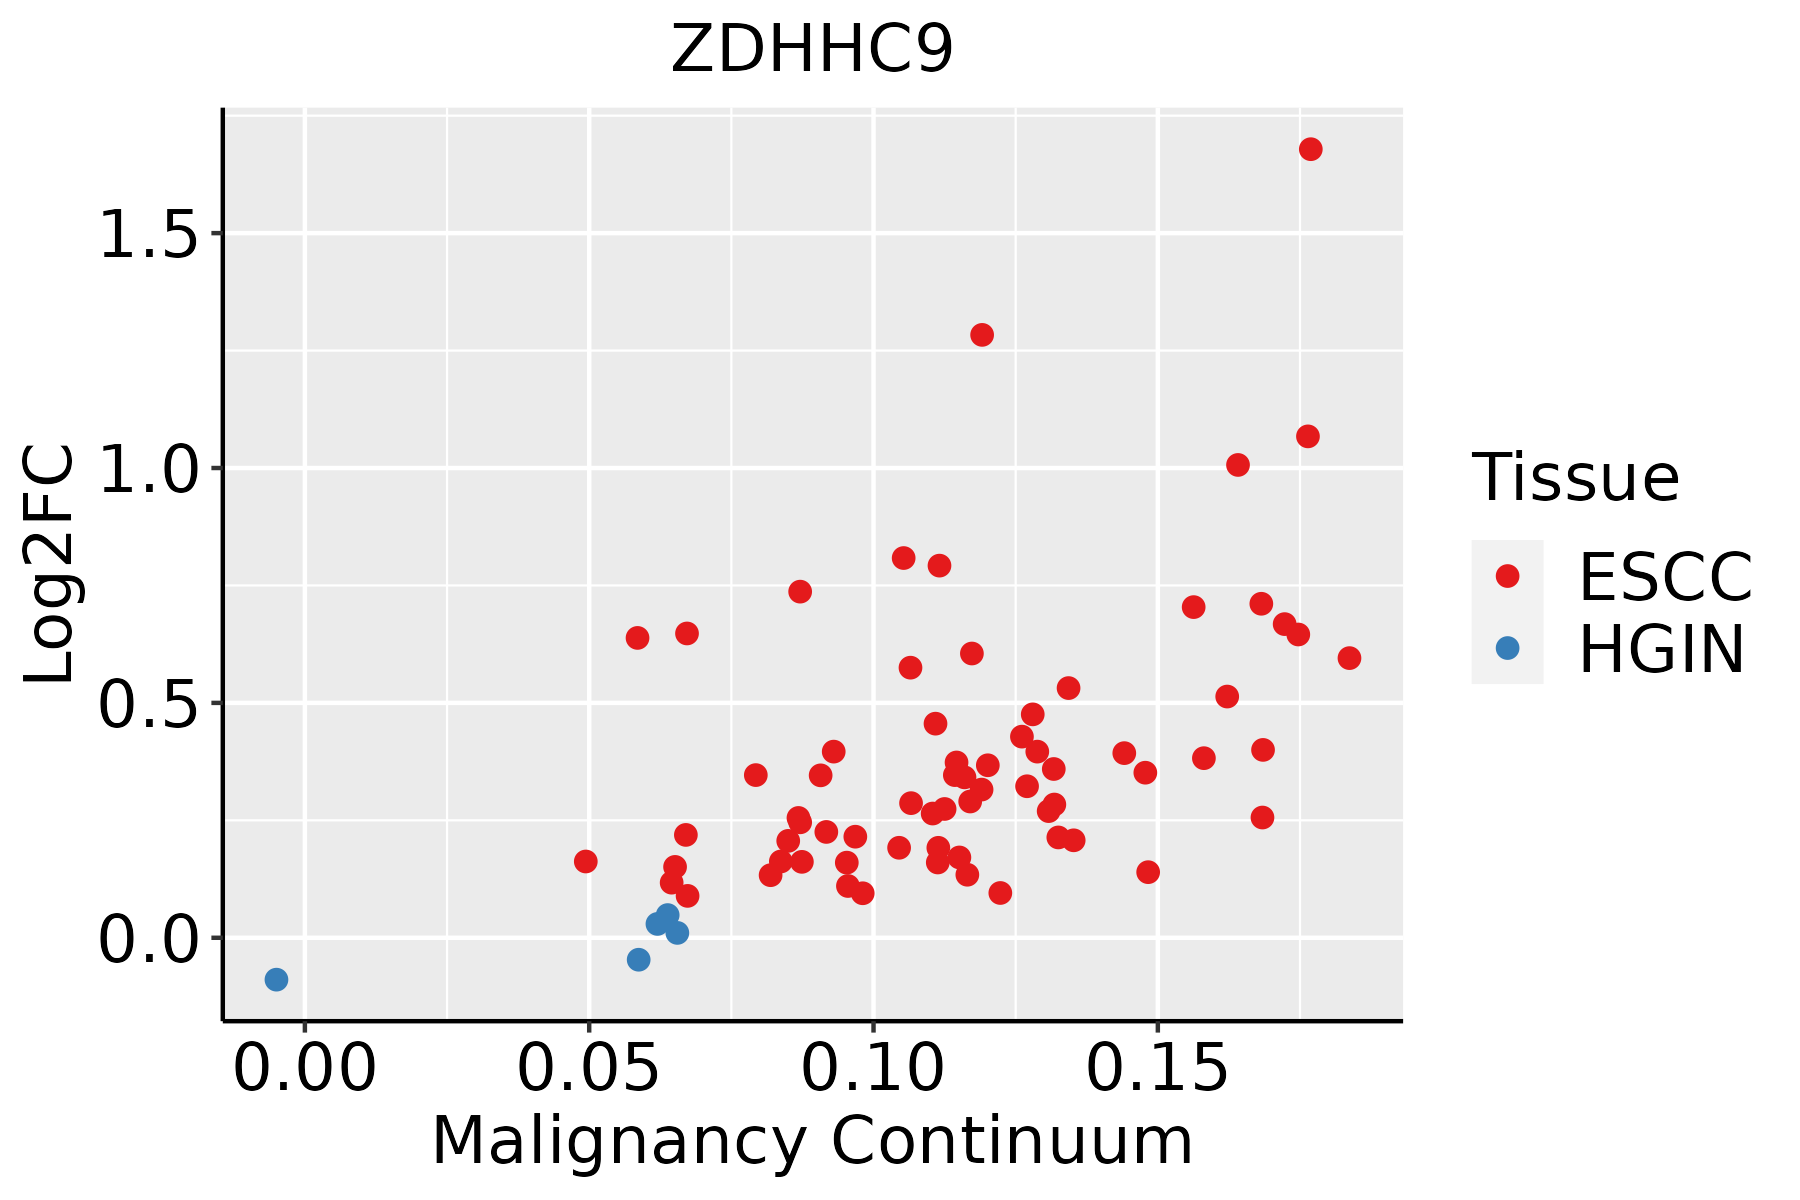 | ESCC: Esophageal squamous cell carcinoma |
| HGIN: High-grade intraepithelial neoplasias | ||
| LGIN: Low-grade intraepithelial neoplasias | ||
| Liver | 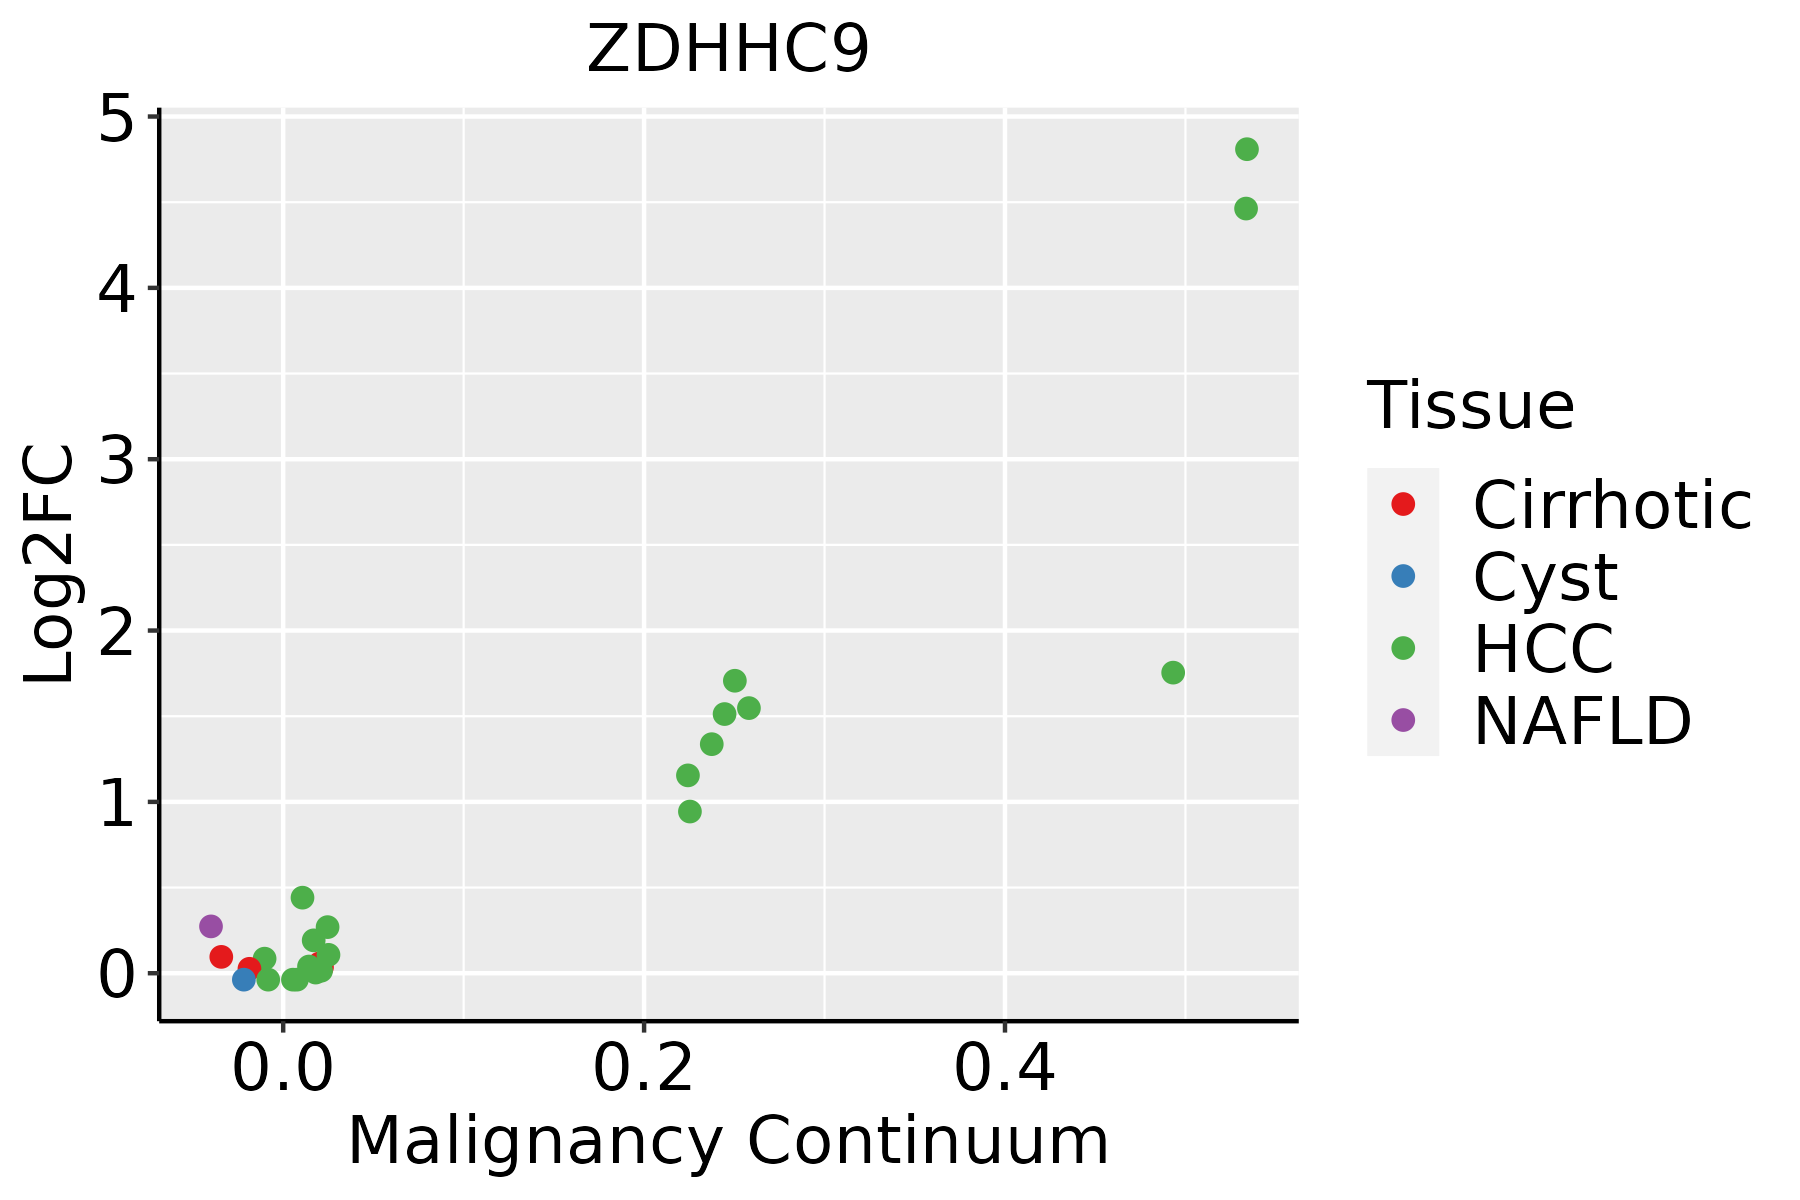 | HCC: Hepatocellular carcinoma |
| NAFLD: Non-alcoholic fatty liver disease | ||
| Lung | 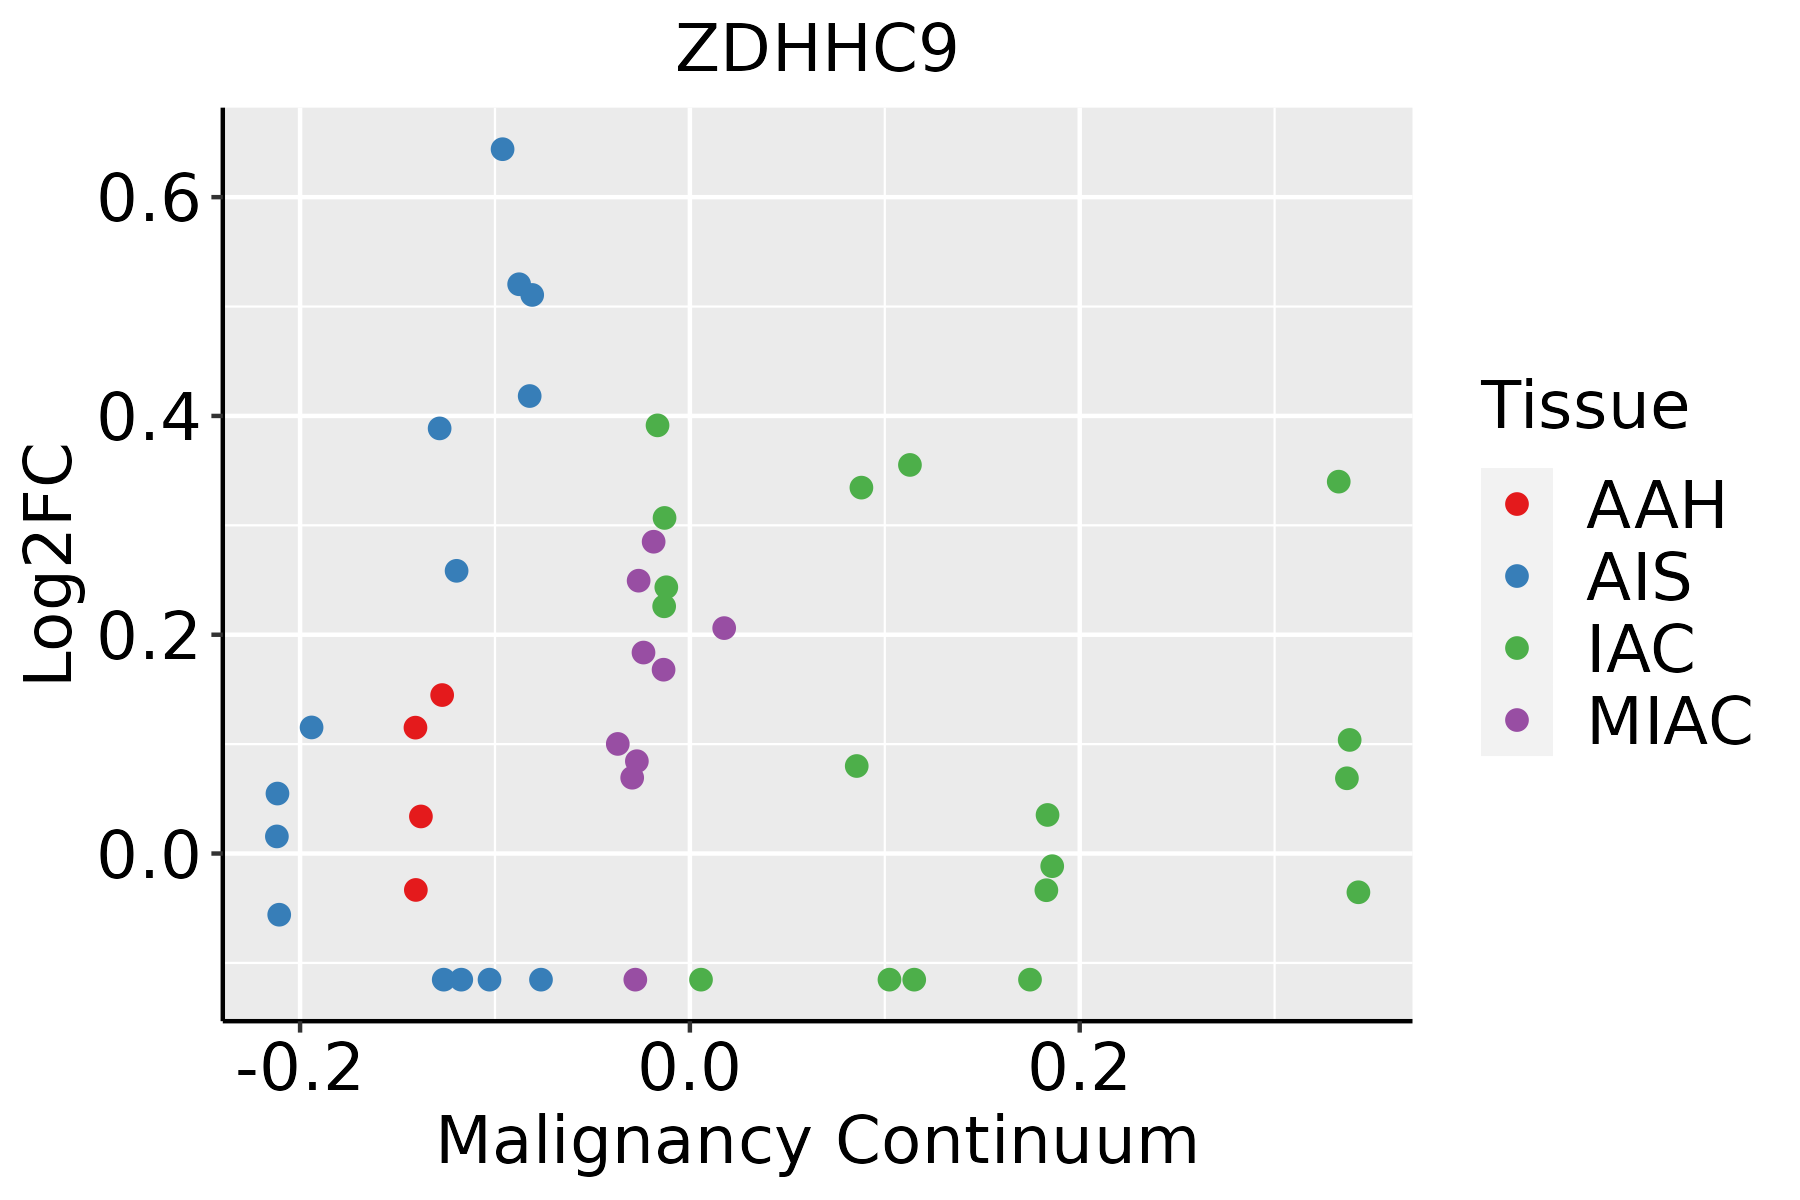 | AAH: Atypical adenomatous hyperplasia |
| AIS: Adenocarcinoma in situ | ||
| IAC: Invasive lung adenocarcinoma | ||
| MIA: Minimally invasive adenocarcinoma | ||
| Oral Cavity |  | EOLP: Erosive Oral lichen planus |
| LP: leukoplakia | ||
| NEOLP: Non-erosive oral lichen planus | ||
| OSCC: Oral squamous cell carcinoma | ||
| Thyroid |  | ATC: Anaplastic thyroid cancer |
| HT: Hashimoto's thyroiditis | ||
| PTC: Papillary thyroid cancer |
| ∗log2FC in expression of this searched gene in stem-like cells from each diseased tissue sample relative to stem-like cells in normal samples in each tissue plotted against the malignancy continuum. Samples are colored based on if they are from different disease stage. |
Top |
Malignant transformation related pathway analysis |
| Find out the enriched GO biological processes and KEGG pathways involved in transition from healthy to precancer to cancer |
| Tissue | Disease Stage | Enriched GO biological Processes |
| Colorectum | AD |  |
| Colorectum | SER |  |
| Colorectum | MSS |  |
| Colorectum | MSI-H |  |
| Colorectum | FAP |  |
| ∗Top 15 enriched GO BP terms are showed in the bar plot of each disease state in each tissue. Each row represents a significant GO biological process which is colored according to the -log10(p.adjust). |
| Page: 1 2 3 4 5 6 7 8 9 |
| GO ID | Tissue | Disease Stage | Description | Gene Ratio | Bg Ratio | pvalue | p.adjust | Count |
| GO:0090150 | Colorectum | AD | establishment of protein localization to membrane | 100/3918 | 260/18723 | 6.01e-11 | 6.33e-09 | 100 |
| GO:0006605 | Colorectum | AD | protein targeting | 105/3918 | 314/18723 | 1.39e-07 | 6.44e-06 | 105 |
| GO:00901502 | Colorectum | MSS | establishment of protein localization to membrane | 90/3467 | 260/18723 | 4.11e-10 | 3.49e-08 | 90 |
| GO:00066052 | Colorectum | MSS | protein targeting | 97/3467 | 314/18723 | 6.76e-08 | 3.46e-06 | 97 |
| GO:00066053 | Colorectum | MSI-H | protein targeting | 44/1319 | 314/18723 | 9.50e-06 | 4.55e-04 | 44 |
| GO:00901503 | Colorectum | MSI-H | establishment of protein localization to membrane | 32/1319 | 260/18723 | 1.47e-03 | 2.23e-02 | 32 |
| GO:00901504 | Colorectum | FAP | establishment of protein localization to membrane | 69/2622 | 260/18723 | 6.40e-08 | 4.54e-06 | 69 |
| GO:00066054 | Colorectum | FAP | protein targeting | 74/2622 | 314/18723 | 3.21e-06 | 1.17e-04 | 74 |
| GO:0006612 | Colorectum | FAP | protein targeting to membrane | 30/2622 | 131/18723 | 3.95e-03 | 2.75e-02 | 30 |
| GO:0006605111 | Esophagus | ESCC | protein targeting | 229/8552 | 314/18723 | 4.93e-23 | 1.01e-20 | 229 |
| GO:0090150110 | Esophagus | ESCC | establishment of protein localization to membrane | 182/8552 | 260/18723 | 1.27e-15 | 8.19e-14 | 182 |
| GO:004354313 | Esophagus | ESCC | protein acylation | 165/8552 | 243/18723 | 1.69e-12 | 7.14e-11 | 165 |
| GO:00421573 | Esophagus | ESCC | lipoprotein metabolic process | 86/8552 | 135/18723 | 1.78e-05 | 1.57e-04 | 86 |
| GO:00064973 | Esophagus | ESCC | protein lipidation | 62/8552 | 92/18723 | 2.08e-05 | 1.80e-04 | 62 |
| GO:00421583 | Esophagus | ESCC | lipoprotein biosynthetic process | 64/8552 | 96/18723 | 2.61e-05 | 2.20e-04 | 64 |
| GO:00066124 | Esophagus | ESCC | protein targeting to membrane | 83/8552 | 131/18723 | 3.31e-05 | 2.73e-04 | 83 |
| GO:0043543 | Liver | NAFLD | protein acylation | 43/1882 | 243/18723 | 1.70e-04 | 3.07e-03 | 43 |
| GO:000660512 | Liver | HCC | protein targeting | 219/7958 | 314/18723 | 7.74e-23 | 1.49e-20 | 219 |
| GO:009015012 | Liver | HCC | establishment of protein localization to membrane | 168/7958 | 260/18723 | 4.07e-13 | 2.13e-11 | 168 |
| GO:00435432 | Liver | HCC | protein acylation | 157/7958 | 243/18723 | 2.40e-12 | 1.12e-10 | 157 |
| Page: 1 2 3 |
| Pathway ID | Tissue | Disease Stage | Description | Gene Ratio | Bg Ratio | pvalue | p.adjust | qvalue | Count |
| Page: 1 |
Top |
Cell-cell communication analysis |
| Identification of potential cell-cell interactions between two cell types and their ligand-receptor pairs for different disease states |
| Ligand | Receptor | LRpair | Pathway | Tissue | Disease Stage |
| Page: 1 |
Top |
Single-cell gene regulatory network inference analysis |
| Find out the significant the regulons (TFs) and the target genes of each regulon across cell types for different disease states |
| TF | Cell Type | Tissue | Disease Stage | Target Gene | RSS | Regulon Activity |
| ∗The dot plots of a searched regulon are shown for all cell subpopulations in each disease state of each tissue based on the regulon specific score inferred using pySCENIC and by calculating the average expression. |
| Page: 1 |
Top |
Somatic mutation of malignant transformation related genes |
| Annotation of somatic variants for genes involved in malignant transformation |
| Hugo Symbol | Variant Class | Variant Classification | dbSNP RS | HGVSc | HGVSp | HGVSp Short | SWISSPROT | BIOTYPE | SIFT | PolyPhen | Tumor Sample Barcode | Tissue | Histology | Sex | Age | Stage | Therapy Types | Drugs | Outcome |
| ZDHHC9 | SNV | Missense_Mutation | c.907N>T | p.Pro303Ser | p.P303S | Q9Y397 | protein_coding | tolerated(0.27) | benign(0.007) | TCGA-BR-6852-01 | Stomach | stomach adenocarcinoma | Female | <65 | I/II | Unknown | Unknown | SD | |
| ZDHHC9 | SNV | Missense_Mutation | c.248T>C | p.Leu83Pro | p.L83P | Q9Y397 | protein_coding | deleterious(0) | probably_damaging(1) | TCGA-BR-8078-01 | Stomach | stomach adenocarcinoma | Female | >=65 | I/II | Unknown | Unknown | SD | |
| ZDHHC9 | insertion | Frame_Shift_Ins | novel | c.534_535insTACCACC | p.Arg179TyrfsTer82 | p.R179Yfs*82 | Q9Y397 | protein_coding | TCGA-BR-8677-01 | Stomach | stomach adenocarcinoma | Female | >=65 | III/IV | Unknown | Unknown | SD |
| Page: 1 2 3 4 5 |
Top |
Related drugs of malignant transformation related genes |
| Identification of chemicals and drugs interact with genes involved in malignant transfromation |
| (DGIdb 4.0) |
| Entrez ID | Symbol | Category | Interaction Types | Drug Claim Name | Drug Name | PMIDs |
| Page: 1 |

Copyright 2023-Present -The University of Texas Health Science Center at Houston |